Oracle Cloud Guard is a robust security and compliance platform designed to protect cloud resources and data. It offers a comprehensive suite of tools and capabilities to help organizations monitor, manage, and mitigate security risks effectively. With its advanced features, Cloud Guard enables businesses to maintain a strong security posture and comply with various industry regulations
One of the key strengths of Cloud Guard is its ability to integrate seamlessly with other Oracle Cloud Infrastructure (OCI) services, such as OCI Logging and Logging Analytics. This integration allows for advanced log analysis and monitoring, providing a deeper understanding of security events and helping organizations make informed decisions to enhance their security strategies.
OCI Logging Analytics is designed to collect, aggregate, and analyze log data generated by various OCI services and resources. It offers a centralized logging platform, allowing organizations to efficiently manage and analyze logs from different sources in one place.
In this blog, we will explore two set of logs that can be collected from Cloud Guard:
1. Cloud Guard Raw Logs
2. Cloud Guard Query Results Logs
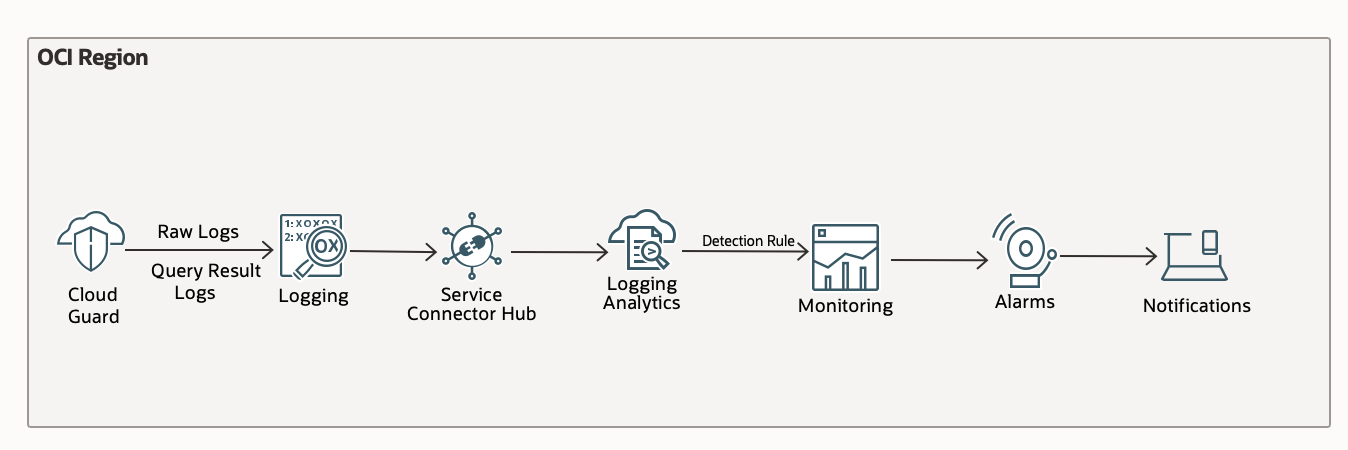
Both of these logs can be enabled using foundational OCI Logging service and then sent to Logging Analytics for advanced analysis. Once the logs are collected in Logging Analytics, you can derive insights such as SELinux status on hosts, Cron job detections, processes running per host, non-oracle users per hosts. These insights can be added to a dashboard for reporting and used for alerting as shown in this blog. This combined approach enhances visibility, accelerates incident response, and ultimately strengthens your overall cloud security posture.
Below is a flow diagram showing log collection and moving them to logging analytics for further analysis and alert set up.
Instance Security in Cloud Guard
Instance Security is a Oracle Cloud Guard detector recipe that monitors compute hosts for suspicious activity. It runs OSquery under the hood which exposes OS data and collects important security information about compute hosts such as security alerts, vulnerabilities, and open ports to provide you with actionable guidance for detection and prevention.
OCI Instance Security Detector Recipe—Enterprise (Oracle managed) provides full service functionality. It gives you alerts based on Oracle ready-to-use detections, and lets you query your fleet using custom and scheduled queries. This ready-to-use detector recipe uses all the Instance Security detector rules which are detailed in OCI Instance Security Detector Rules.
You can run on-demand queries on Compute instances periodically, or on an on-demand basis to give you real-time visibility into the state of your machine. After you have run a query and are happy with the query result, you can schedule the query to run at a regular frequency. Queries are SQLite understandable SQL constructed using the OSquery SQL language.
Instance Security is integrated with the OCI Logging service. We will take a look at how to ingest and analyze the logs enabled in OCI Logging into OCI Logging Analytics to derive actionable insights.
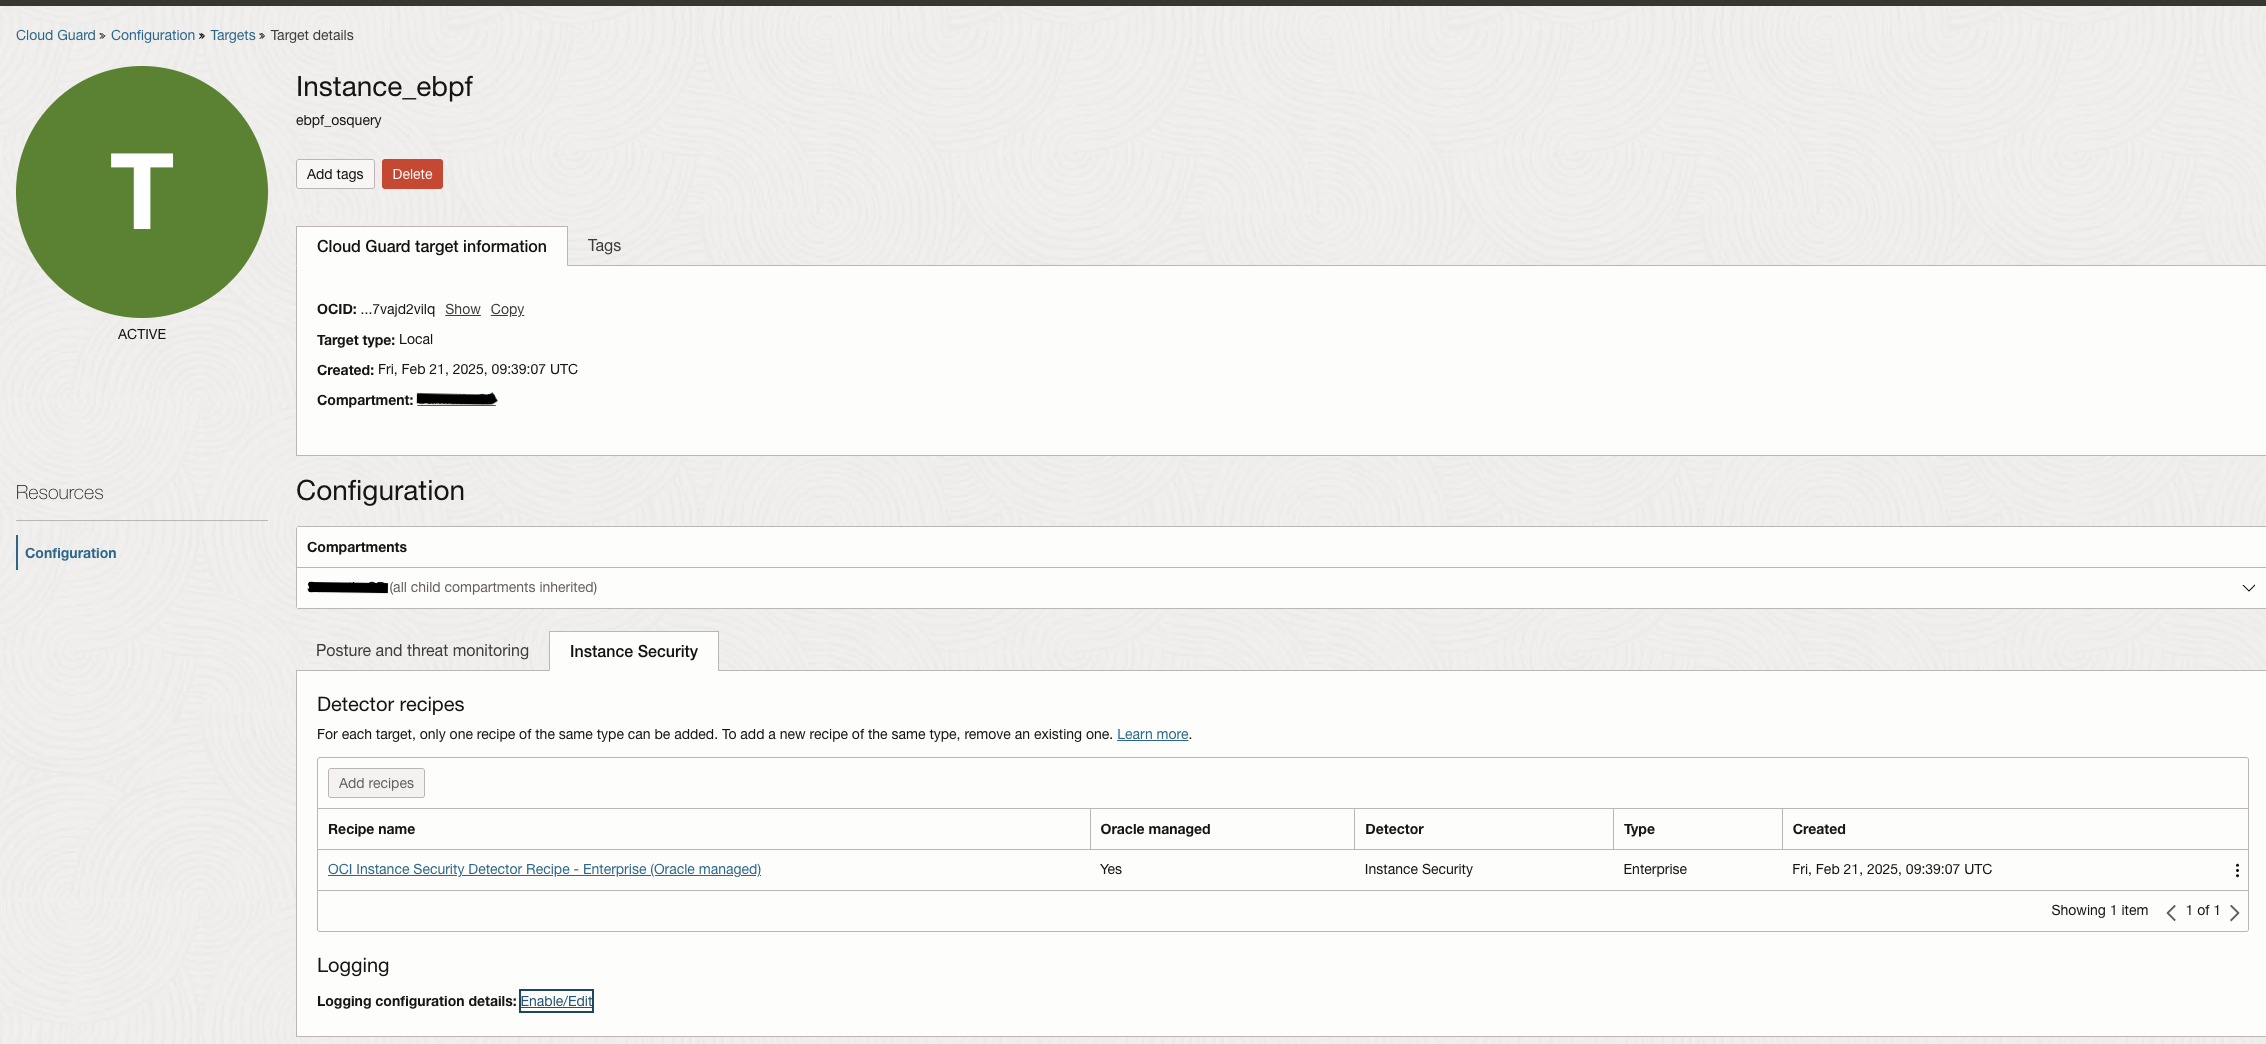
First requirement is to enable instance security detetctor recipe on a new or existing Target. Once enabled, you can collect raw logs of Instance Security and/or create scheduled queries and collect their corresponding query result logs. The image below shows a target with Instance Security Recipe enabled.
Collecting Cloud Guard Raw Logs and Analyzing in Logging Analytics
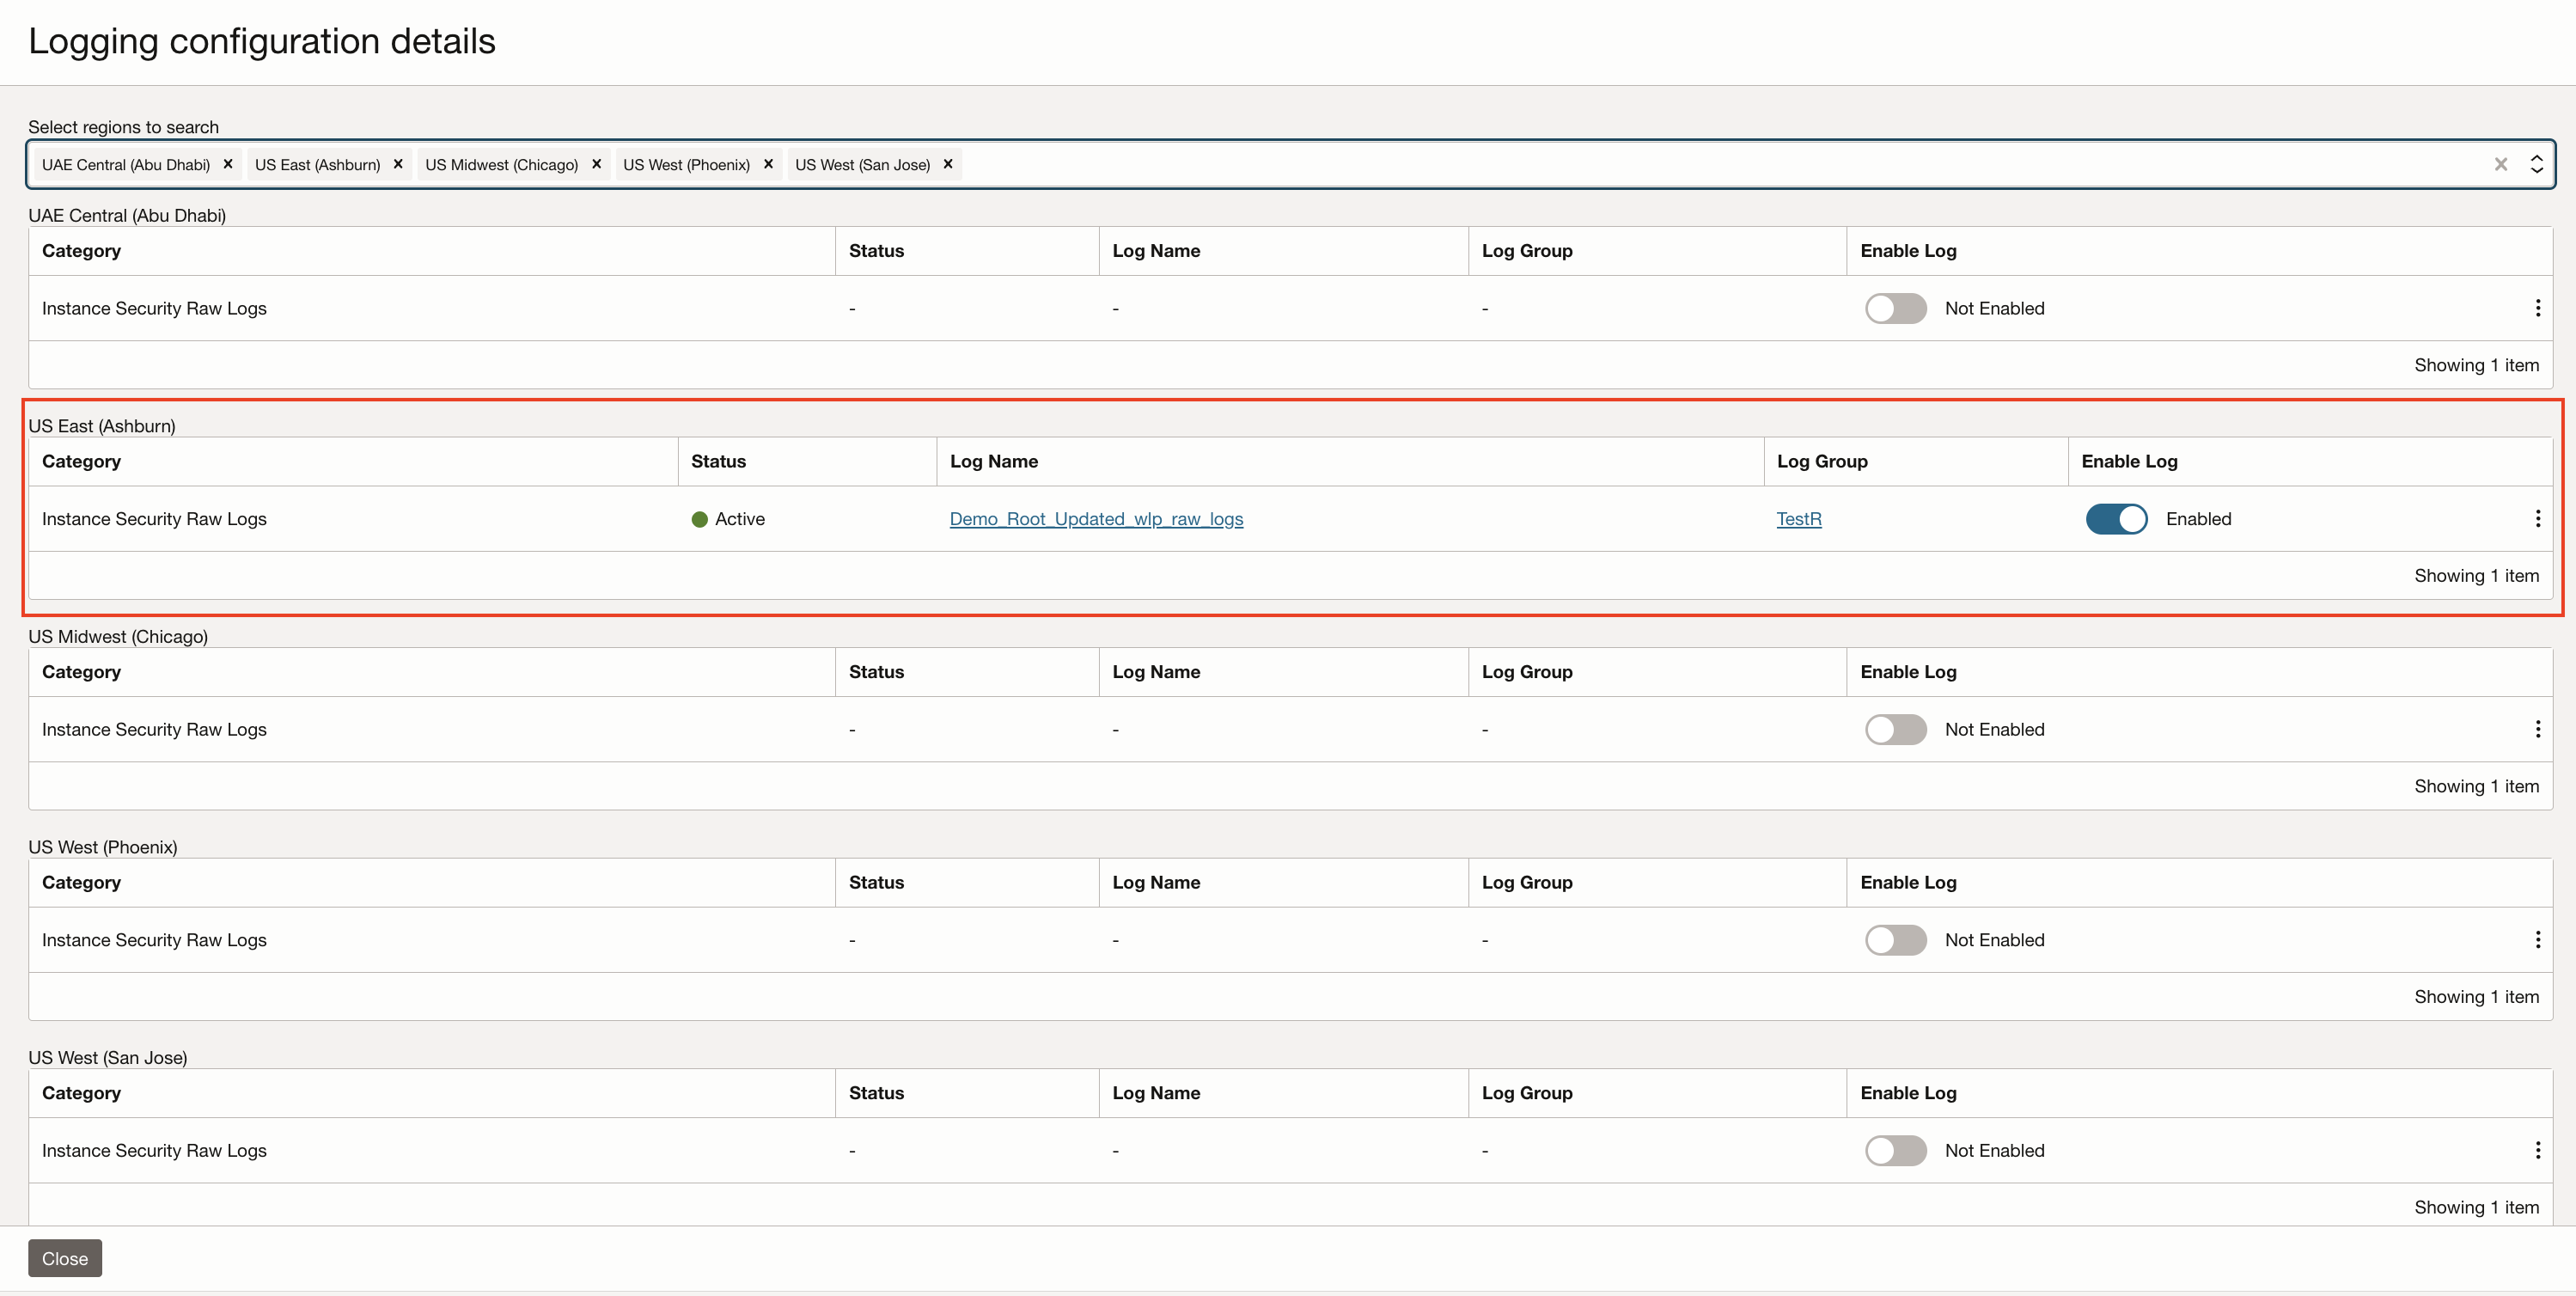
After the Instance Security Detector Recipe is attached to a target, navigate to the Logging section on the same page and enable Instance Security Raw Logs in the region of interest.
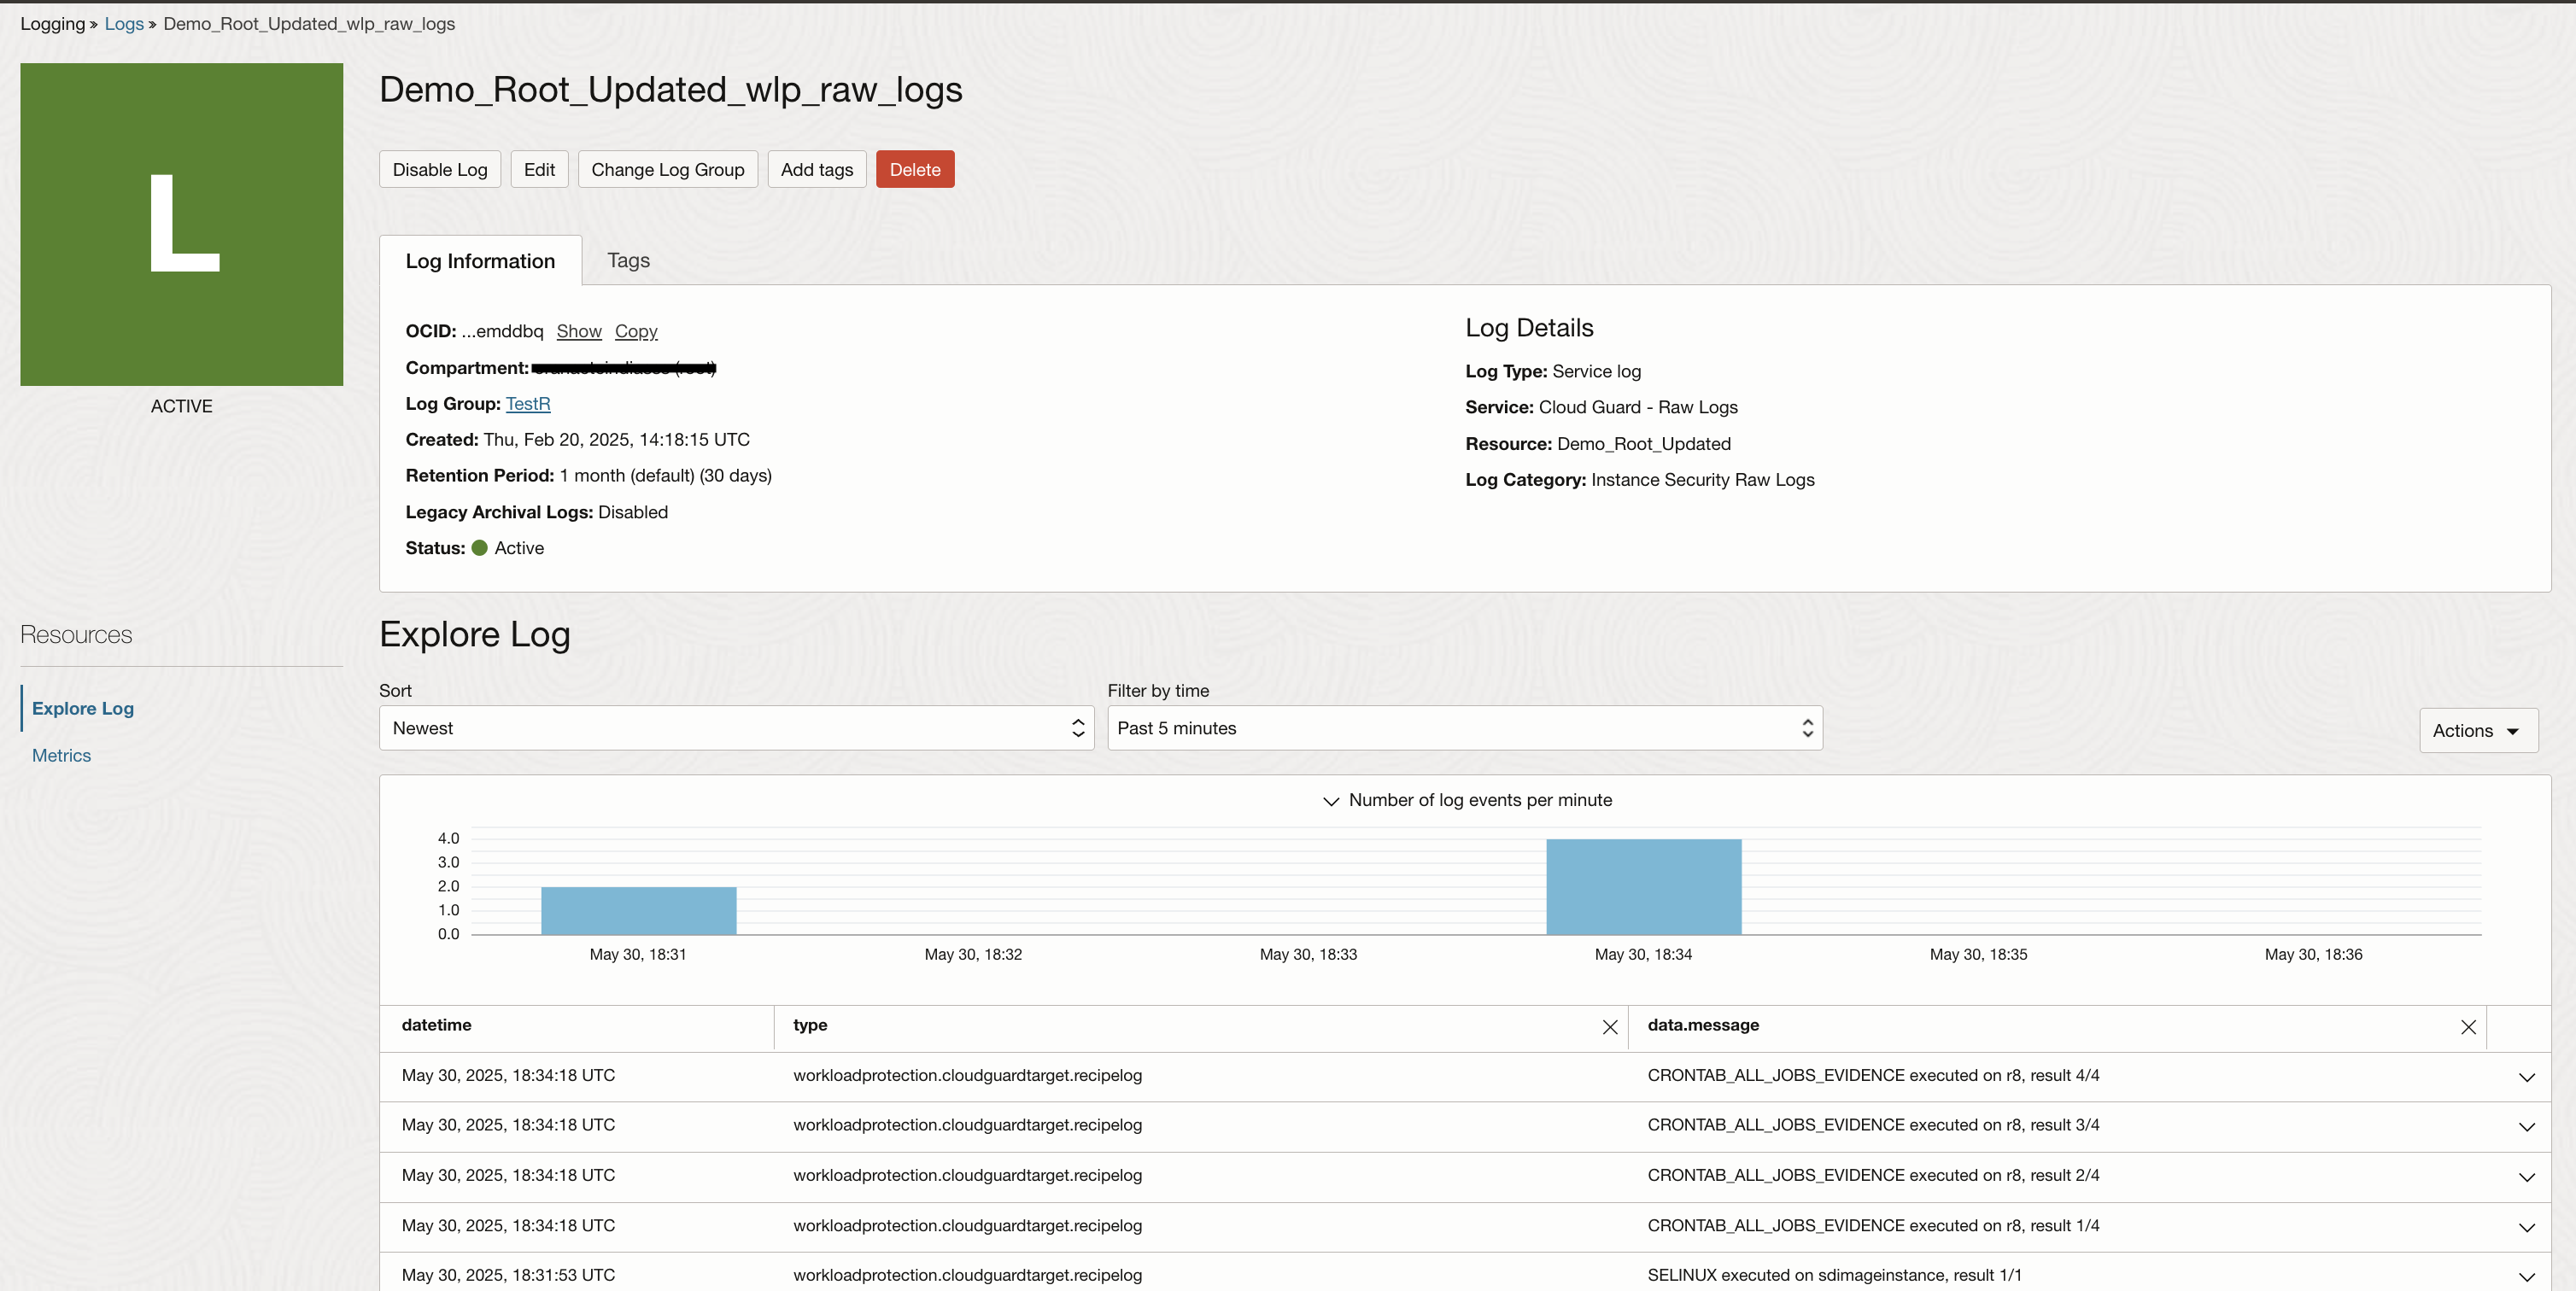
Incoming logs can be verified by navigating to the Log in OCI Logging service as shown in the image below.
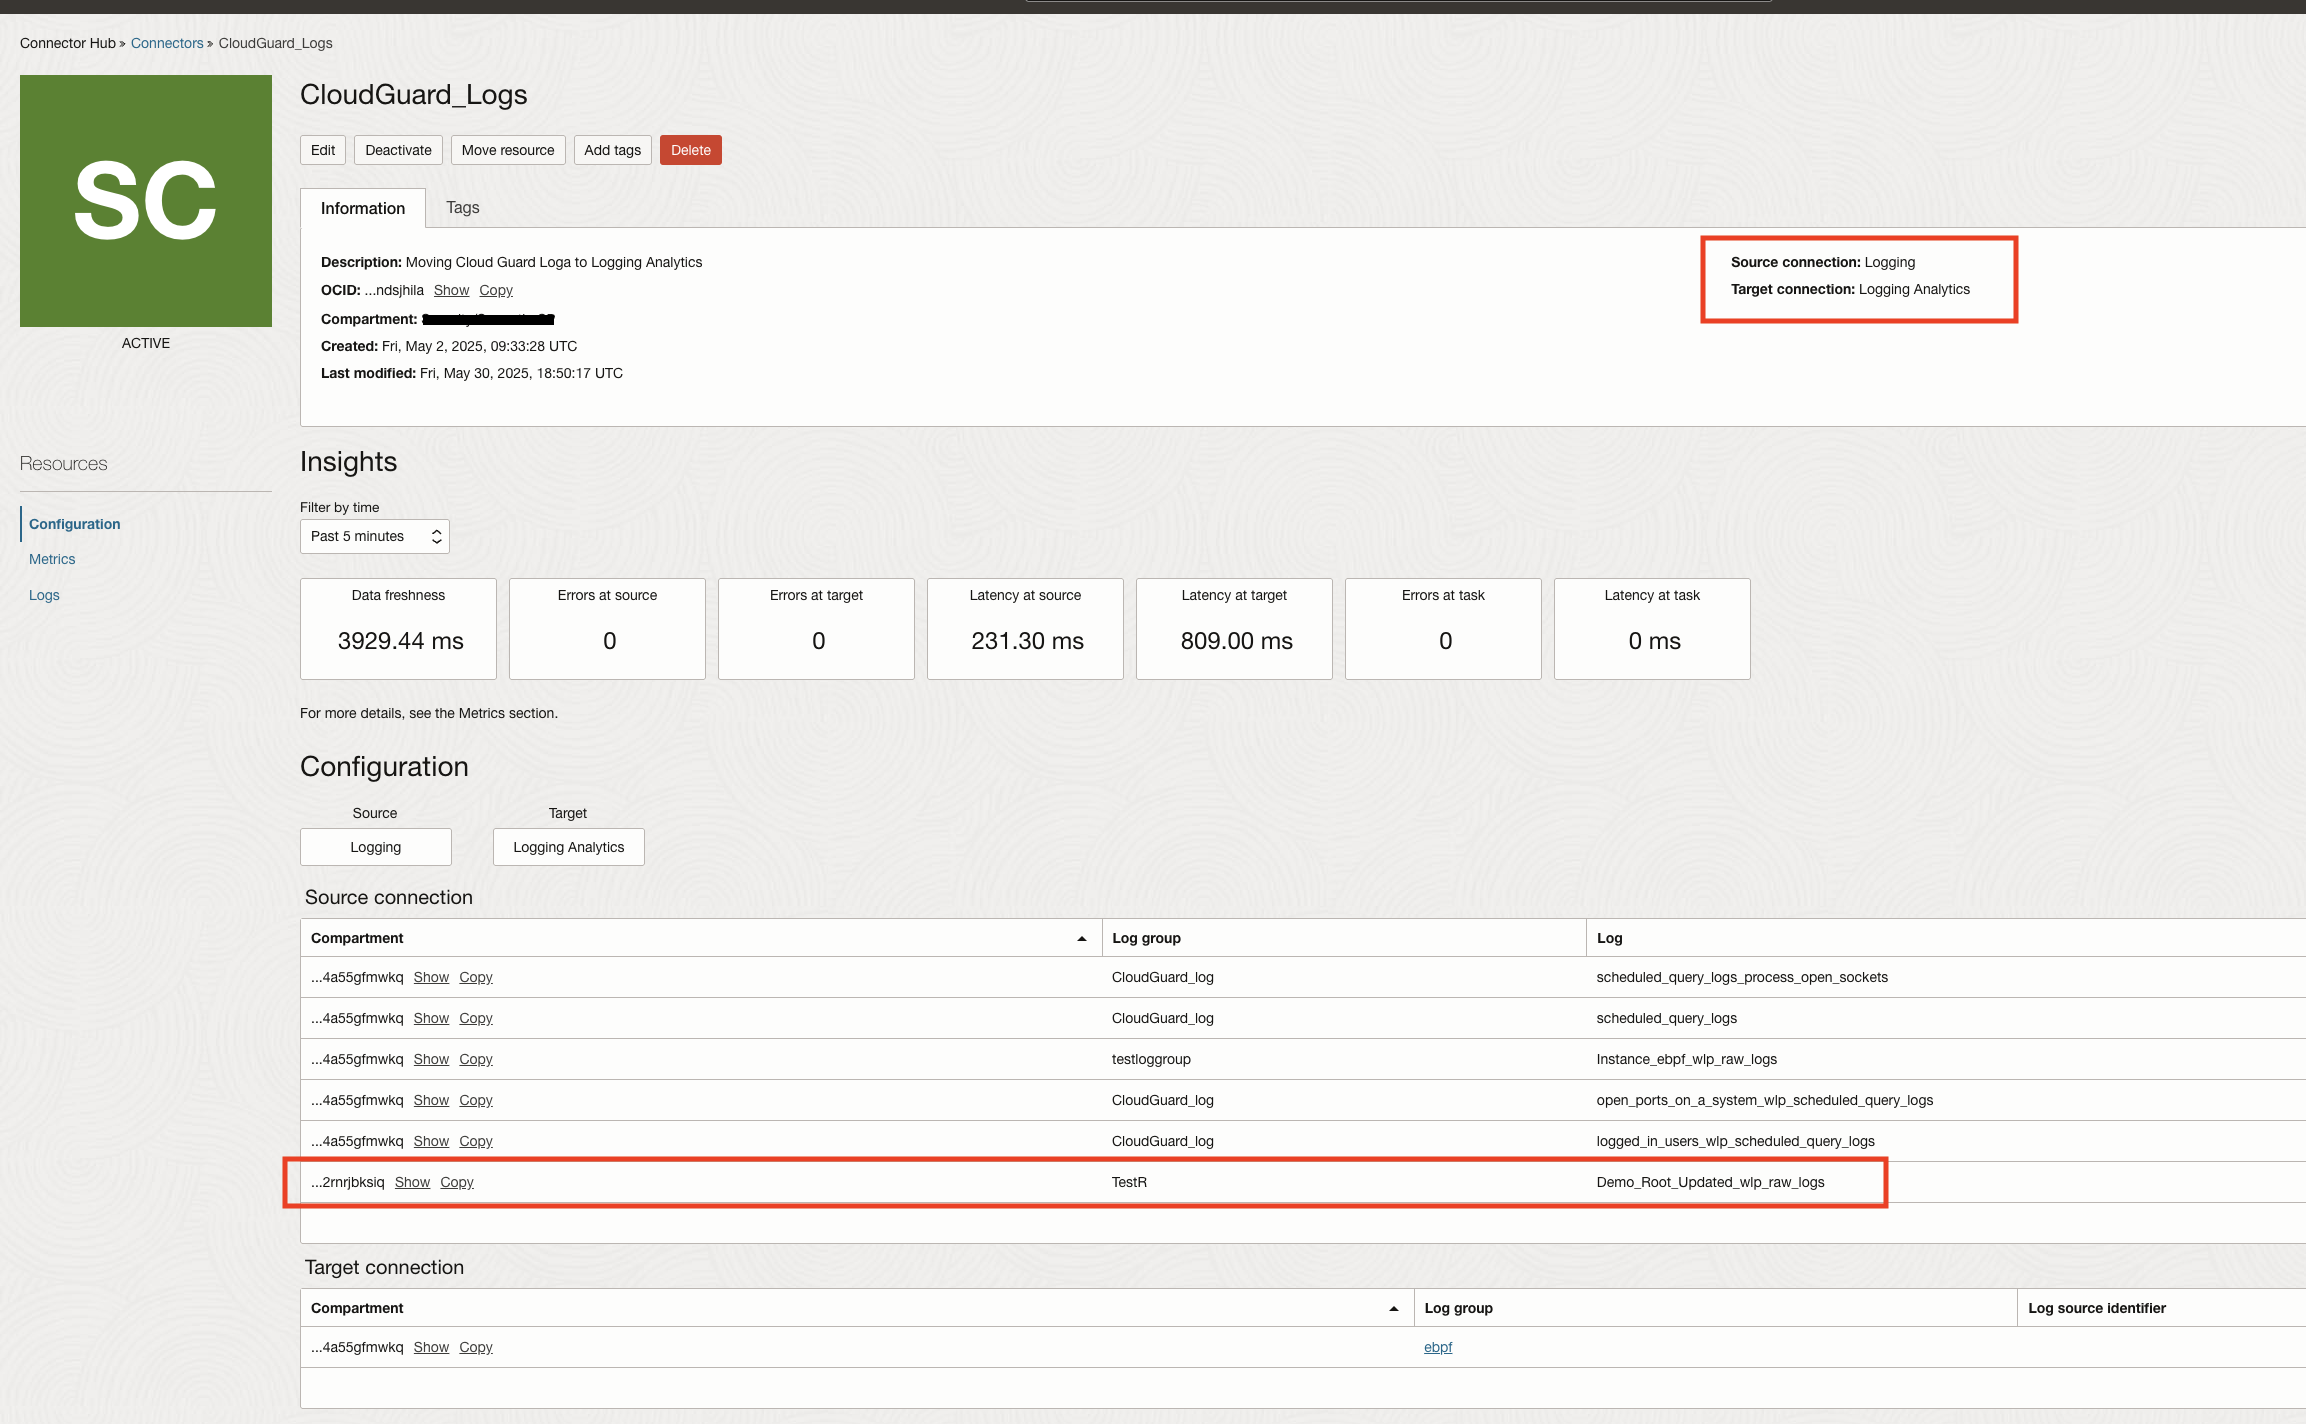
In order to gain more insights into the logs collected in OCI Logging, it is recommended to move them to Logging Analytics. Log data can be sent seamlessly using Connector Hub. Single connector can be used to move different logs to same destination service.
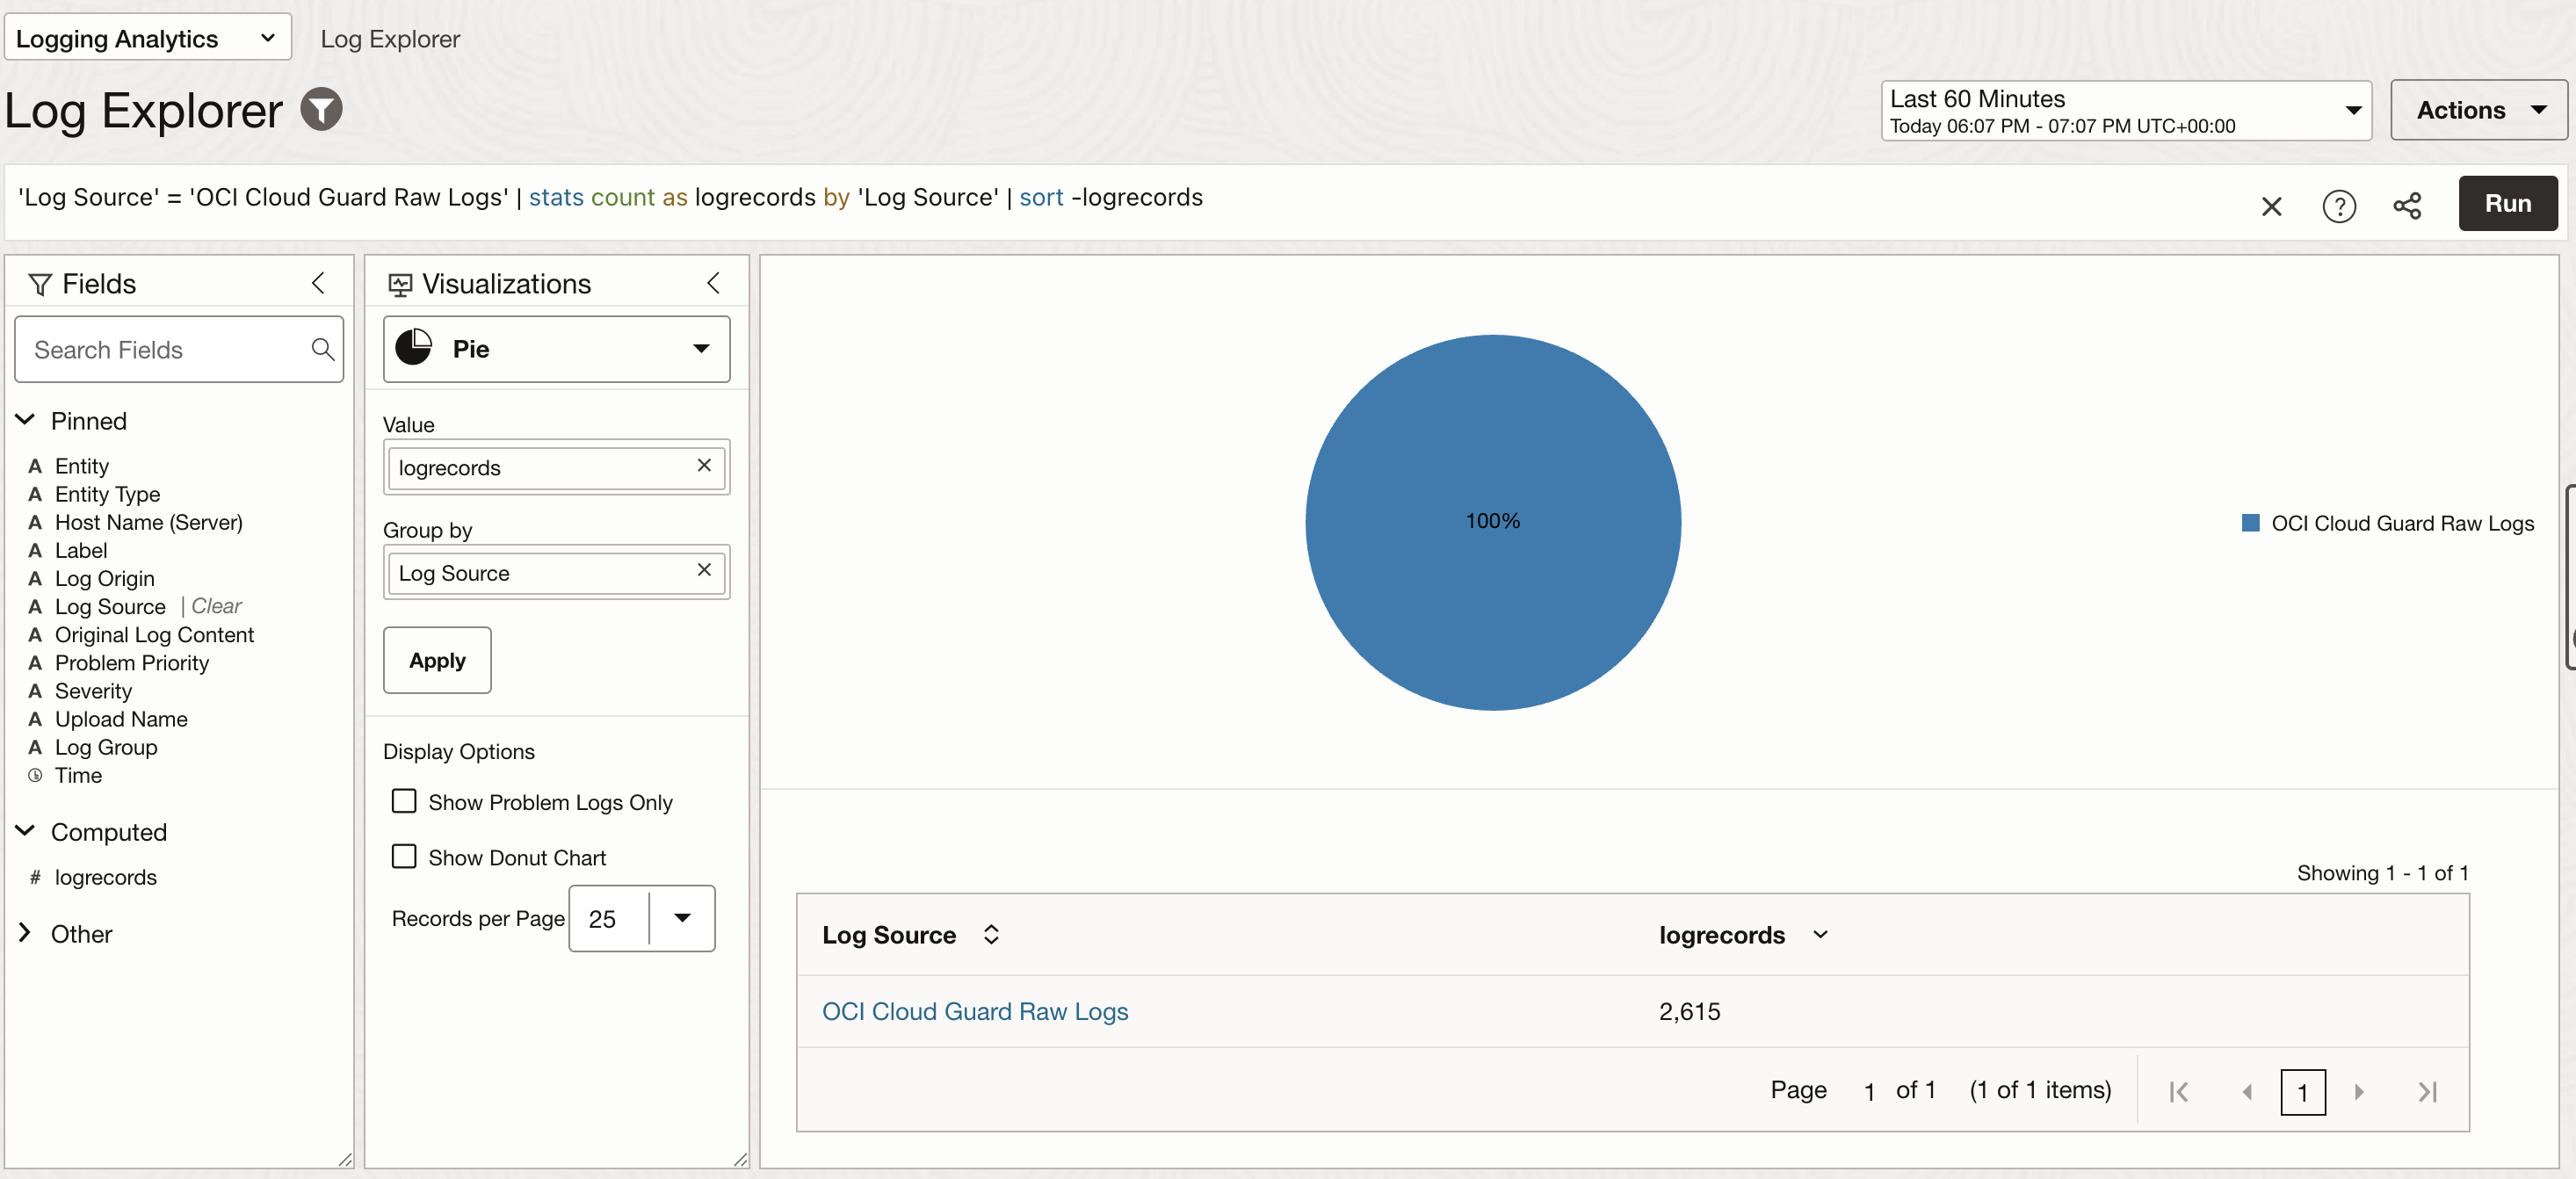
Once the cloud guard raw logs are available in Logging Analytics they will all be grouped under OCI Cloud Guard Raw Logs log source as shown in the image below. Please note that the logs are by default categorized by Log Sources in Logging Analytics.
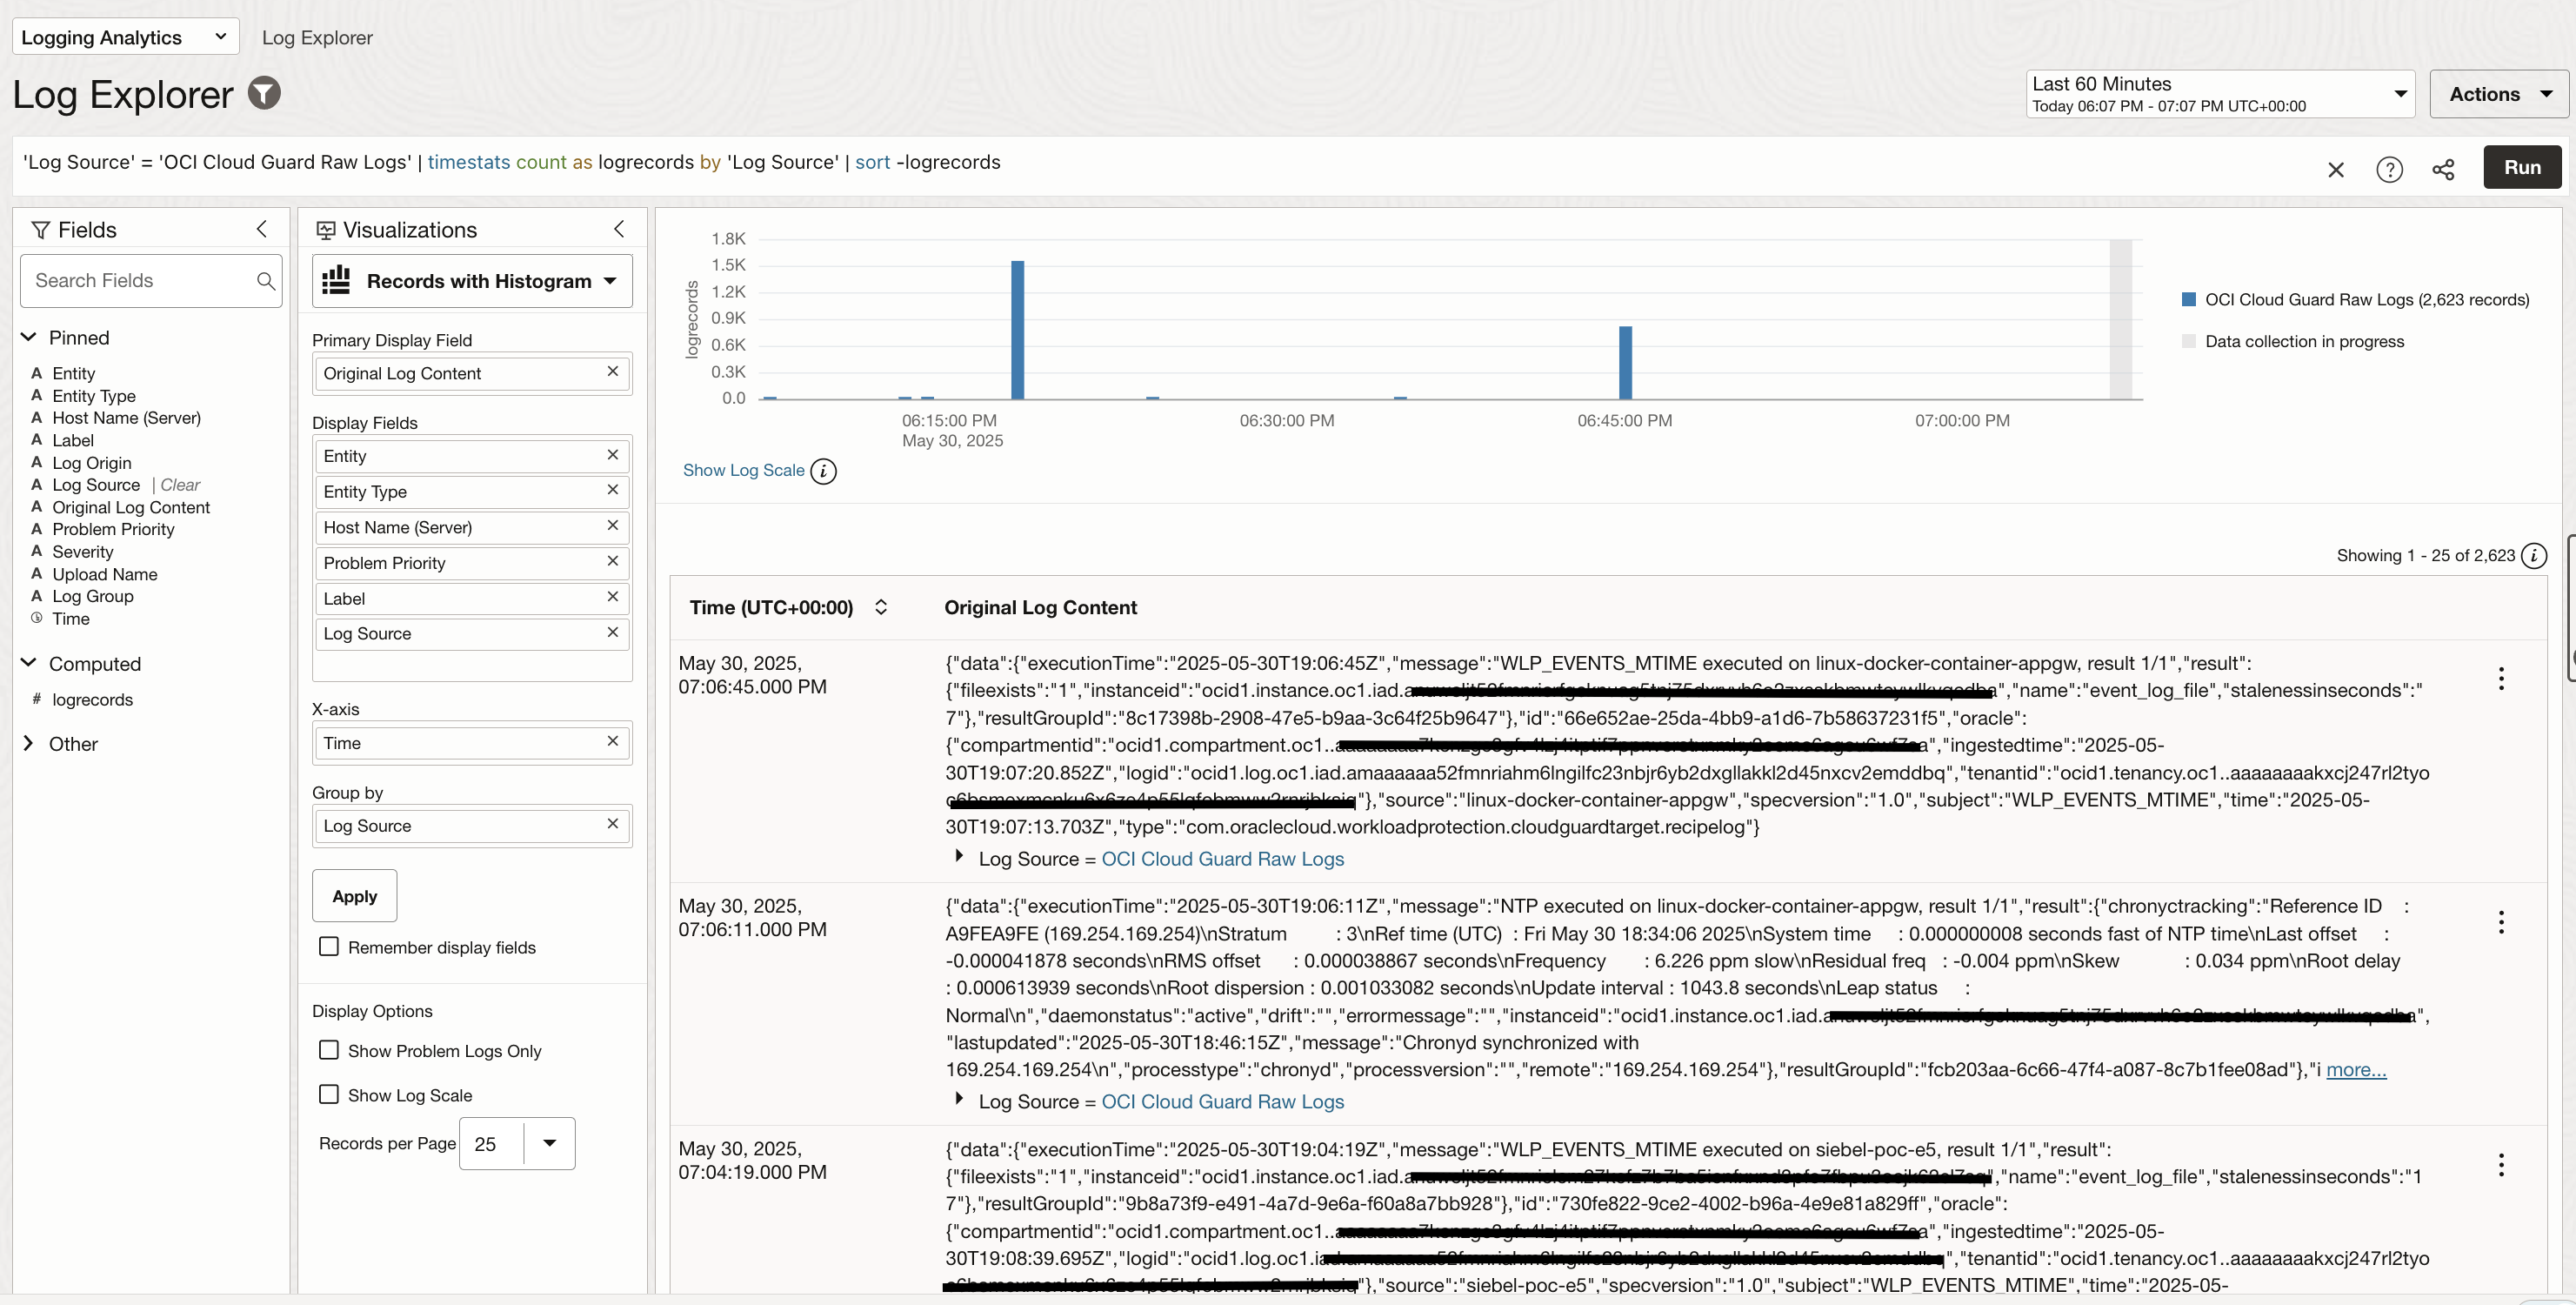
You can deep dive into individual log events by changing the visualization type to Records with Histogram.
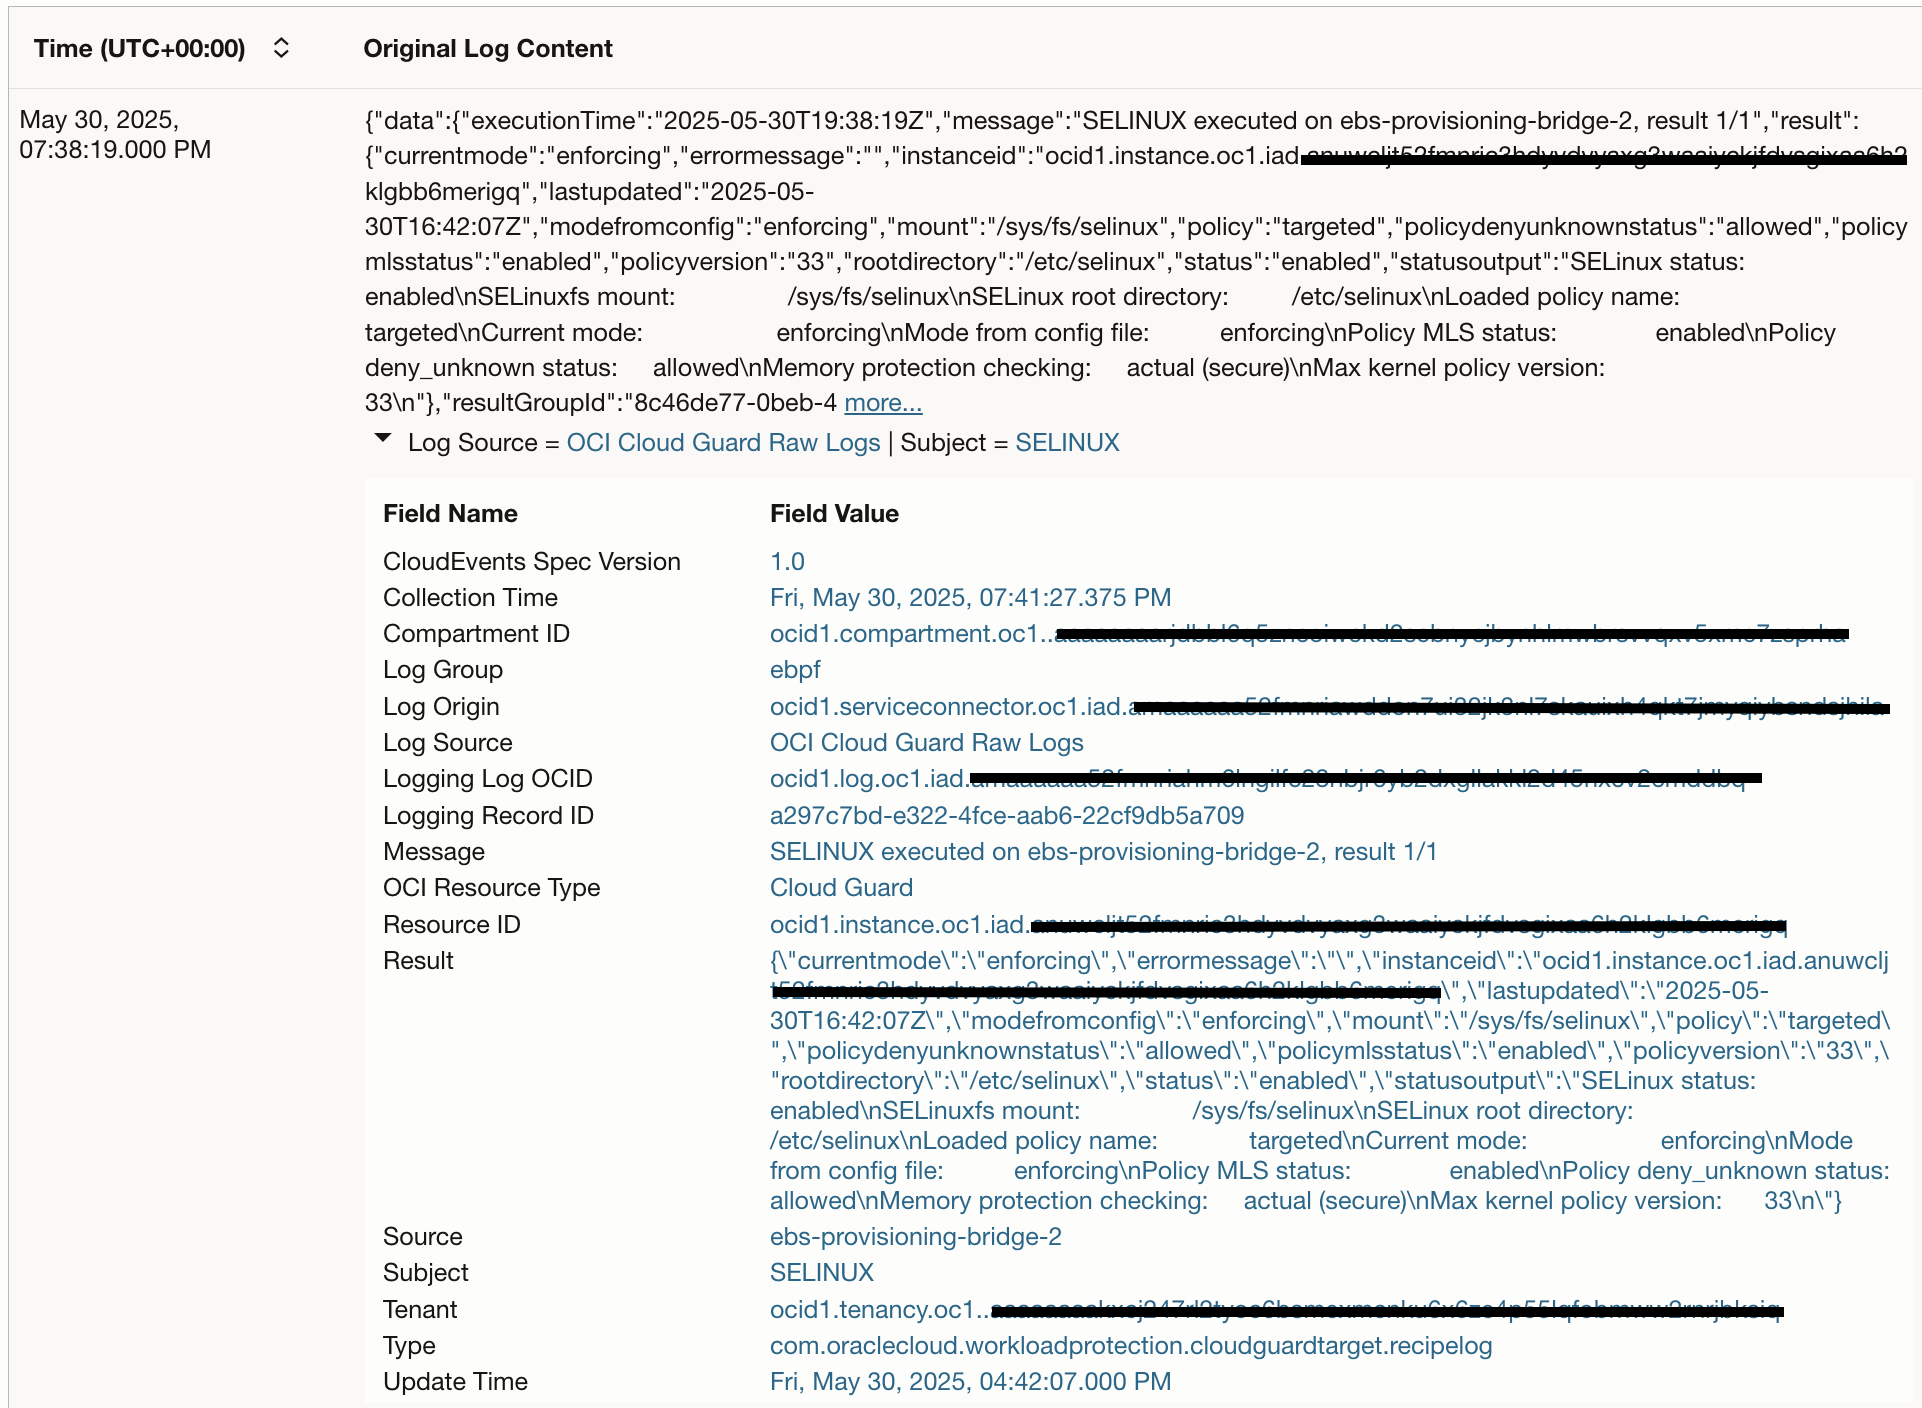
You can also select one particular log record and look into the details. The image below shows a log record for verifying SELinux on a compute instance.
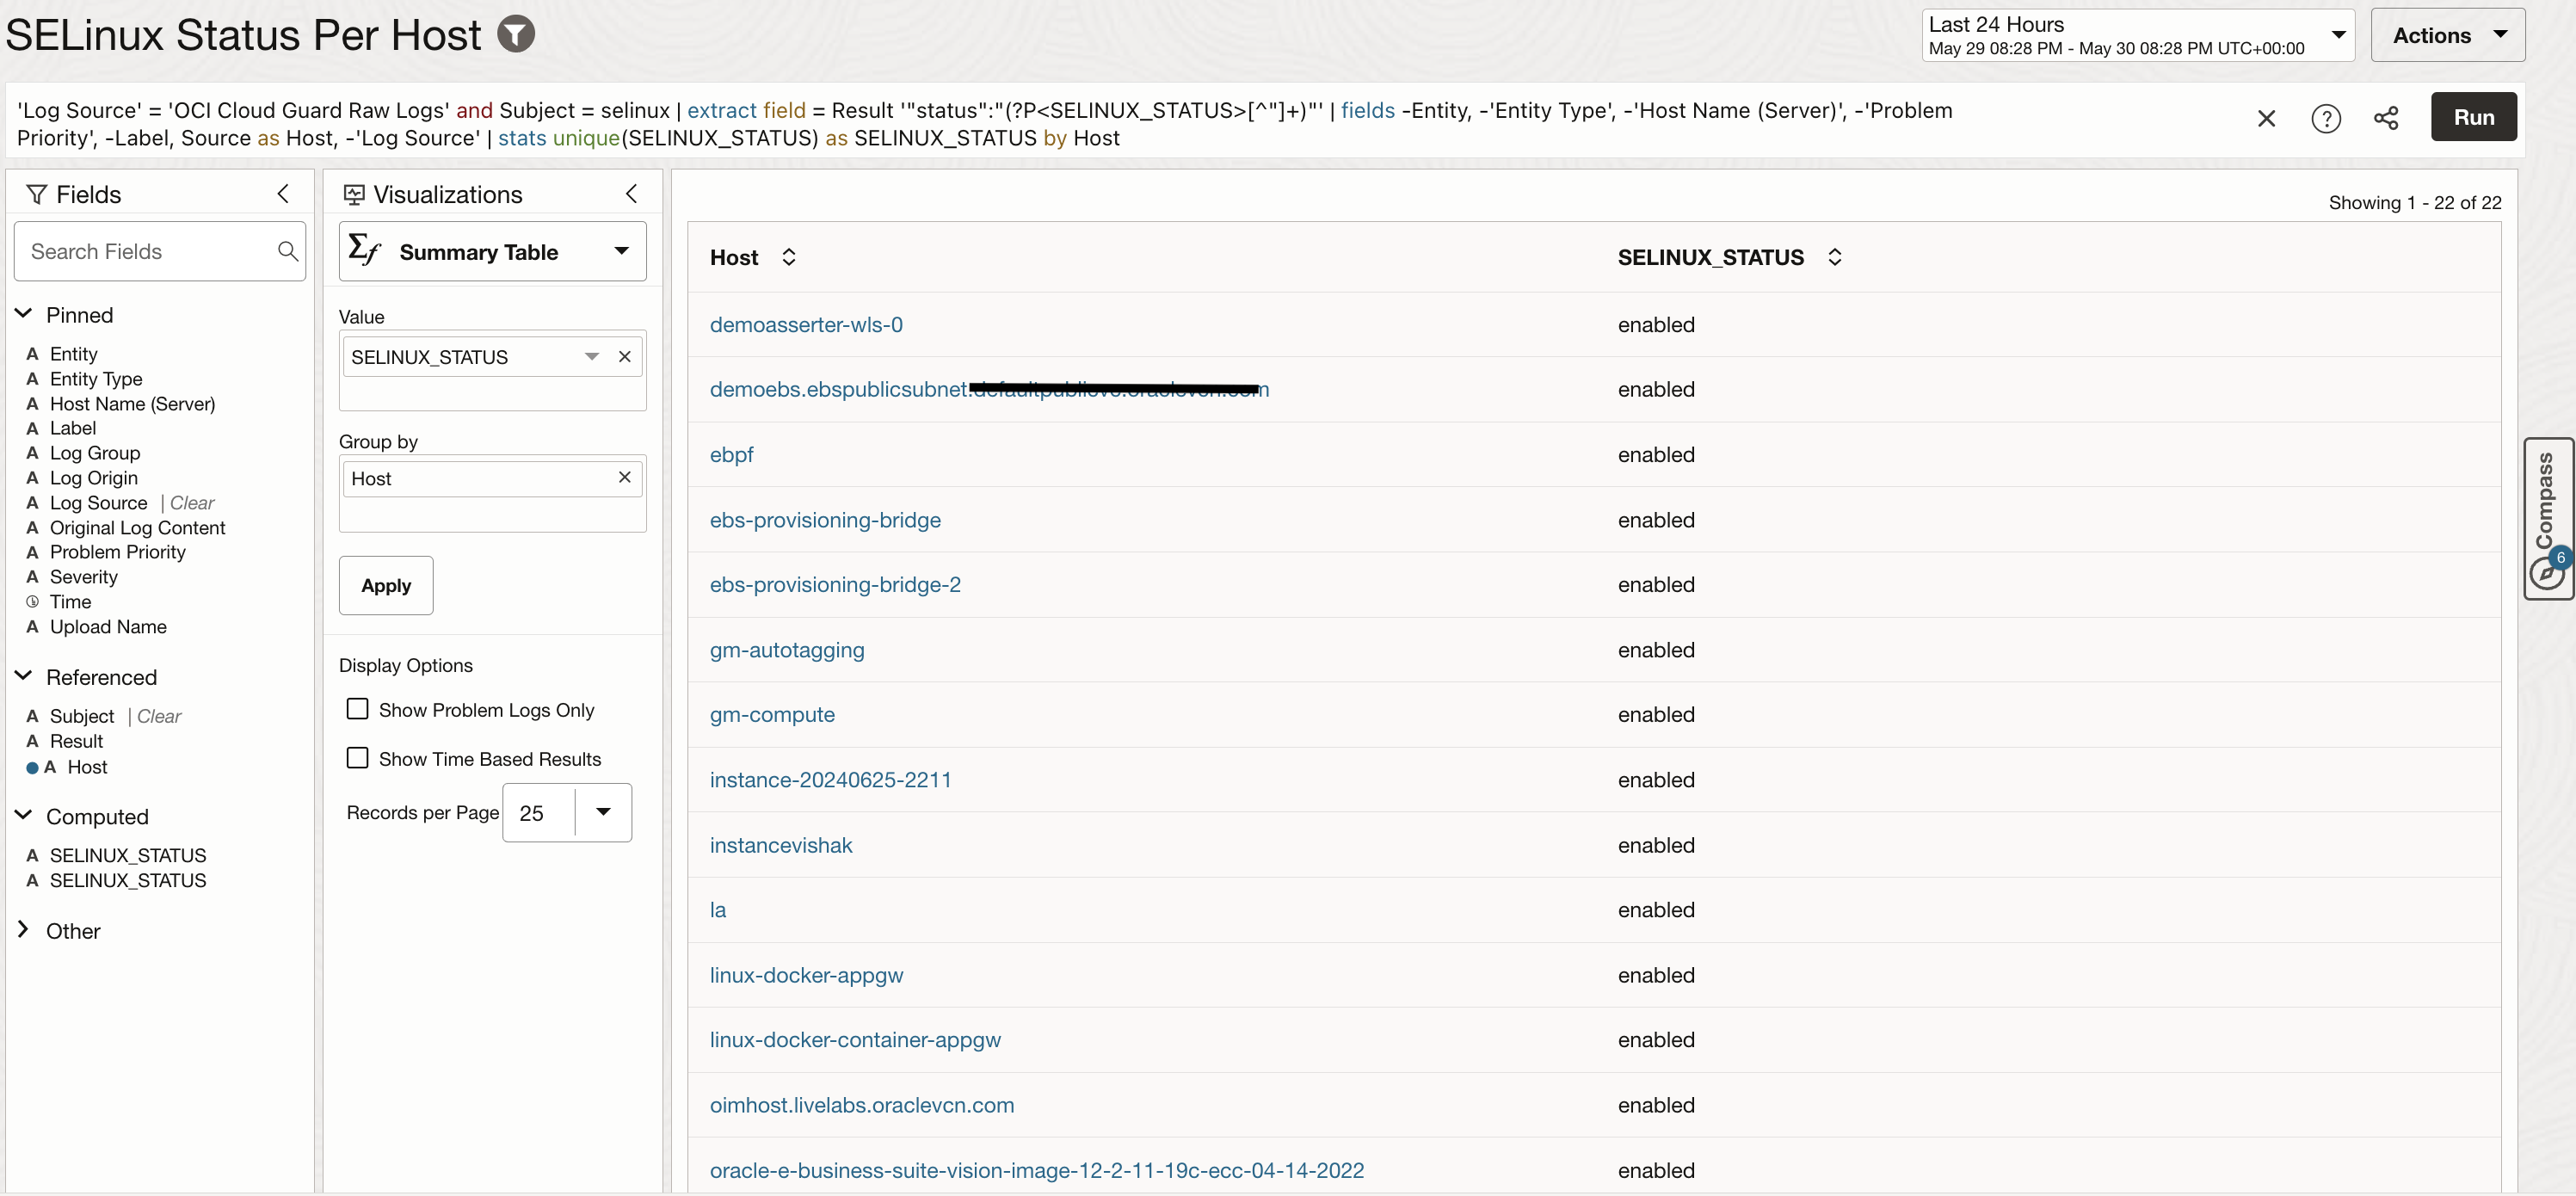
A search can be refined with advanced query language and different visualization types available in Logging Analytics. The image below shows one example search to check latest SELinux status on all scanned hosts. SELinux is important to maintain system security and is automatically checked on hosts by Cloud Guard Instance Security Recipe. The results shown in this image are built on raw logs and presented in an easy to read format using search query and visualization so that it can also be added to a dashboard for easy reporting.
Sample Query to check SELinux status: ‘Log Source’ = ‘OCI Cloud Guard Raw Logs’ and Subject = selinux | extract field = Result ‘”status”:”(?P<SELINUX_STATUS>[^”]+)”‘ | fields -Entity, -‘Entity Type’, -‘Host Name (Server)’, -‘Problem Priority’, -Label, Source as Host, -‘Log Source’ | stats unique(SELINUX_STATUS) as SELINUX_STATUS by Host
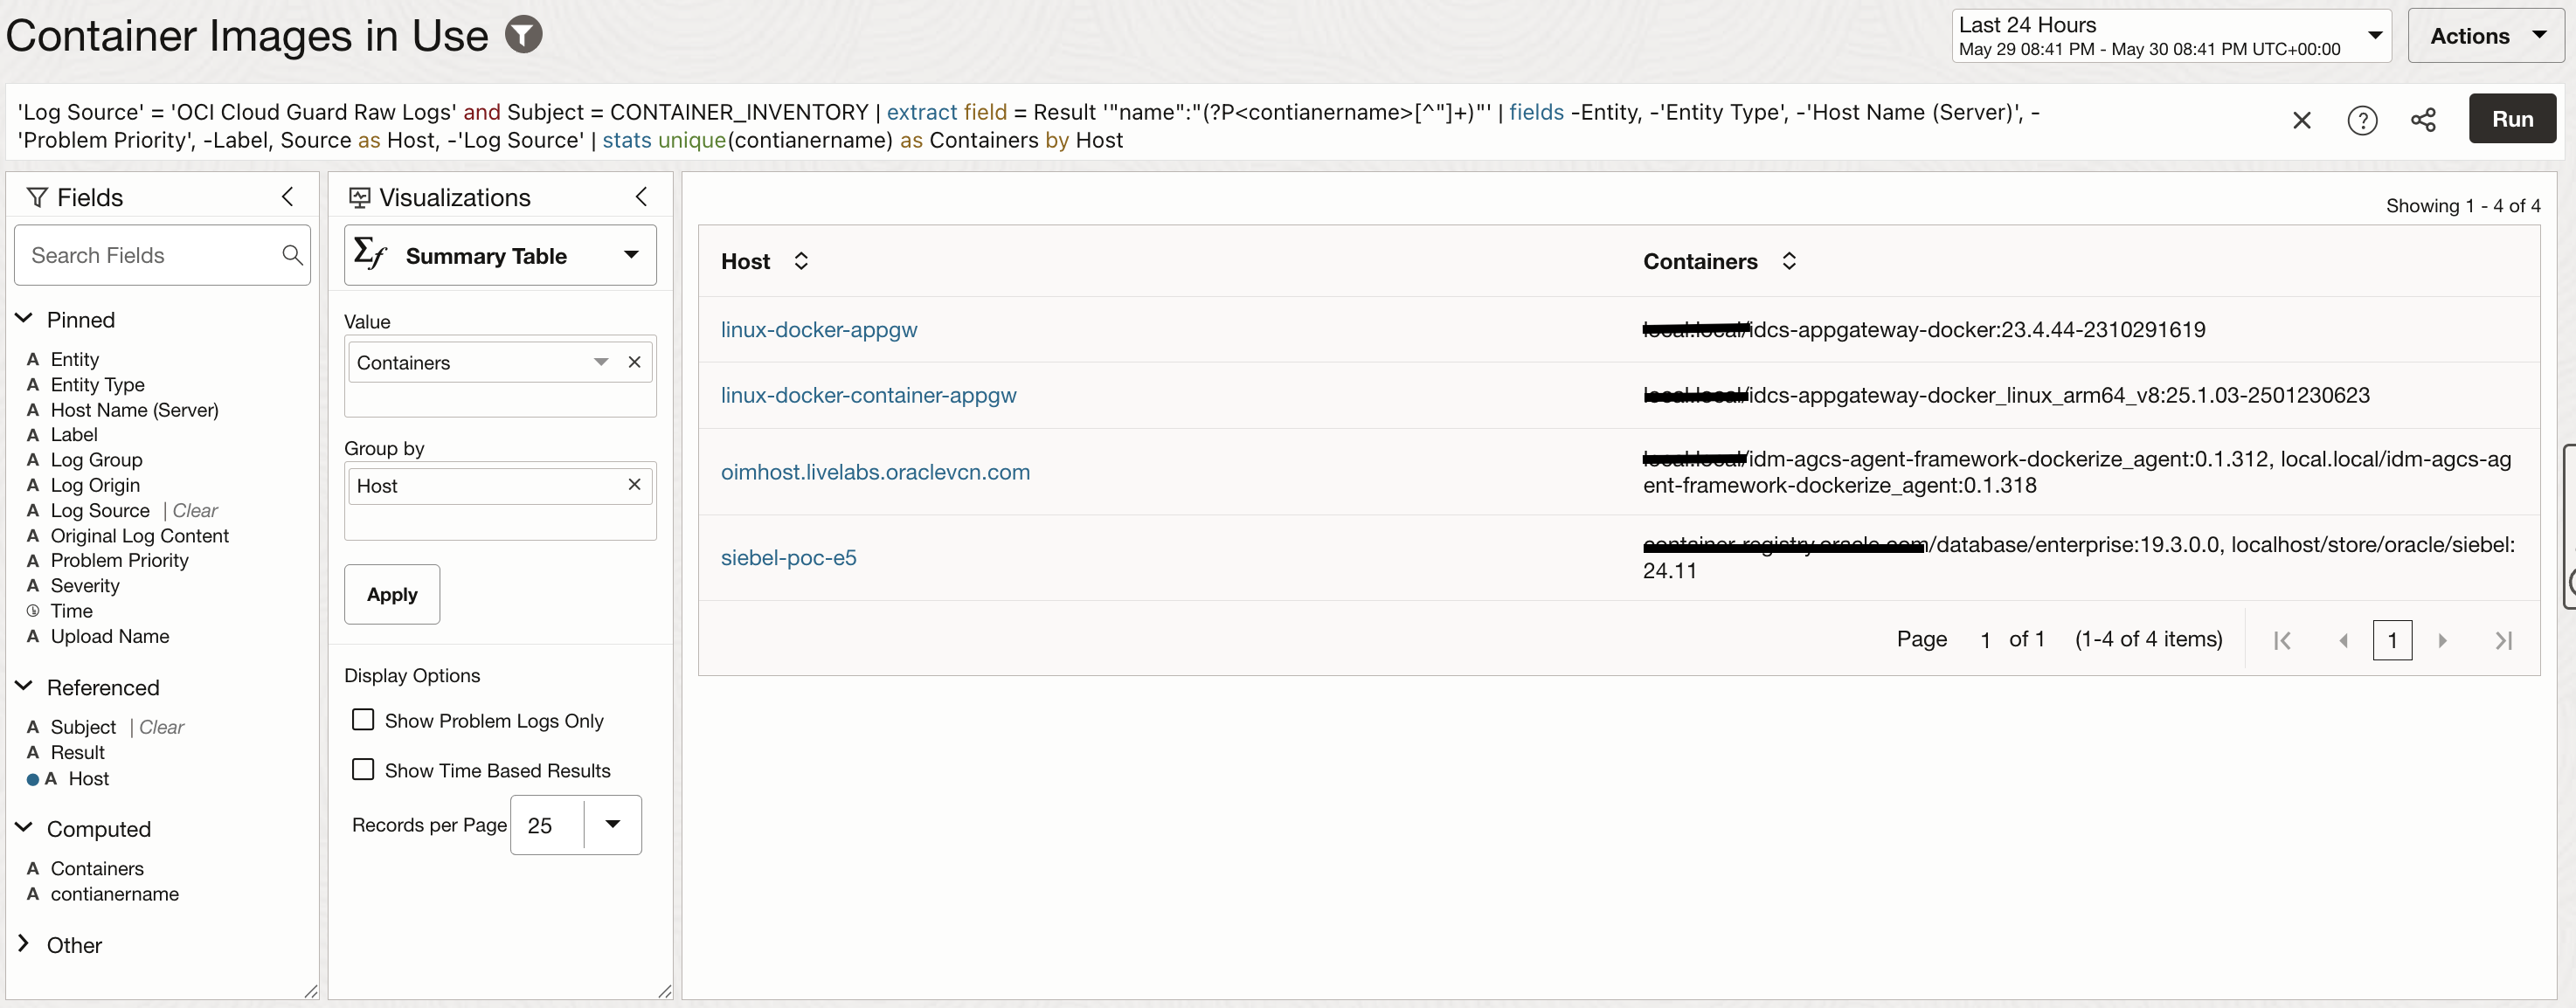
Another example query is to check for container images being used actively and map them to the corresponding hosts.
Sample query to find active container images: ‘Log Source’ = ‘OCI Cloud Guard Raw Logs’ and Subject = CONTAINER_INVENTORY | extract field = Result ‘”name”:”(?P<contianername>[^”]+)”‘ | fields -Entity, -‘Entity Type’, -‘Host Name (Server)’, -‘Problem Priority’, -Label, Source as Host, -‘Log Source’ | stats unique(contianername) as Containers by Host
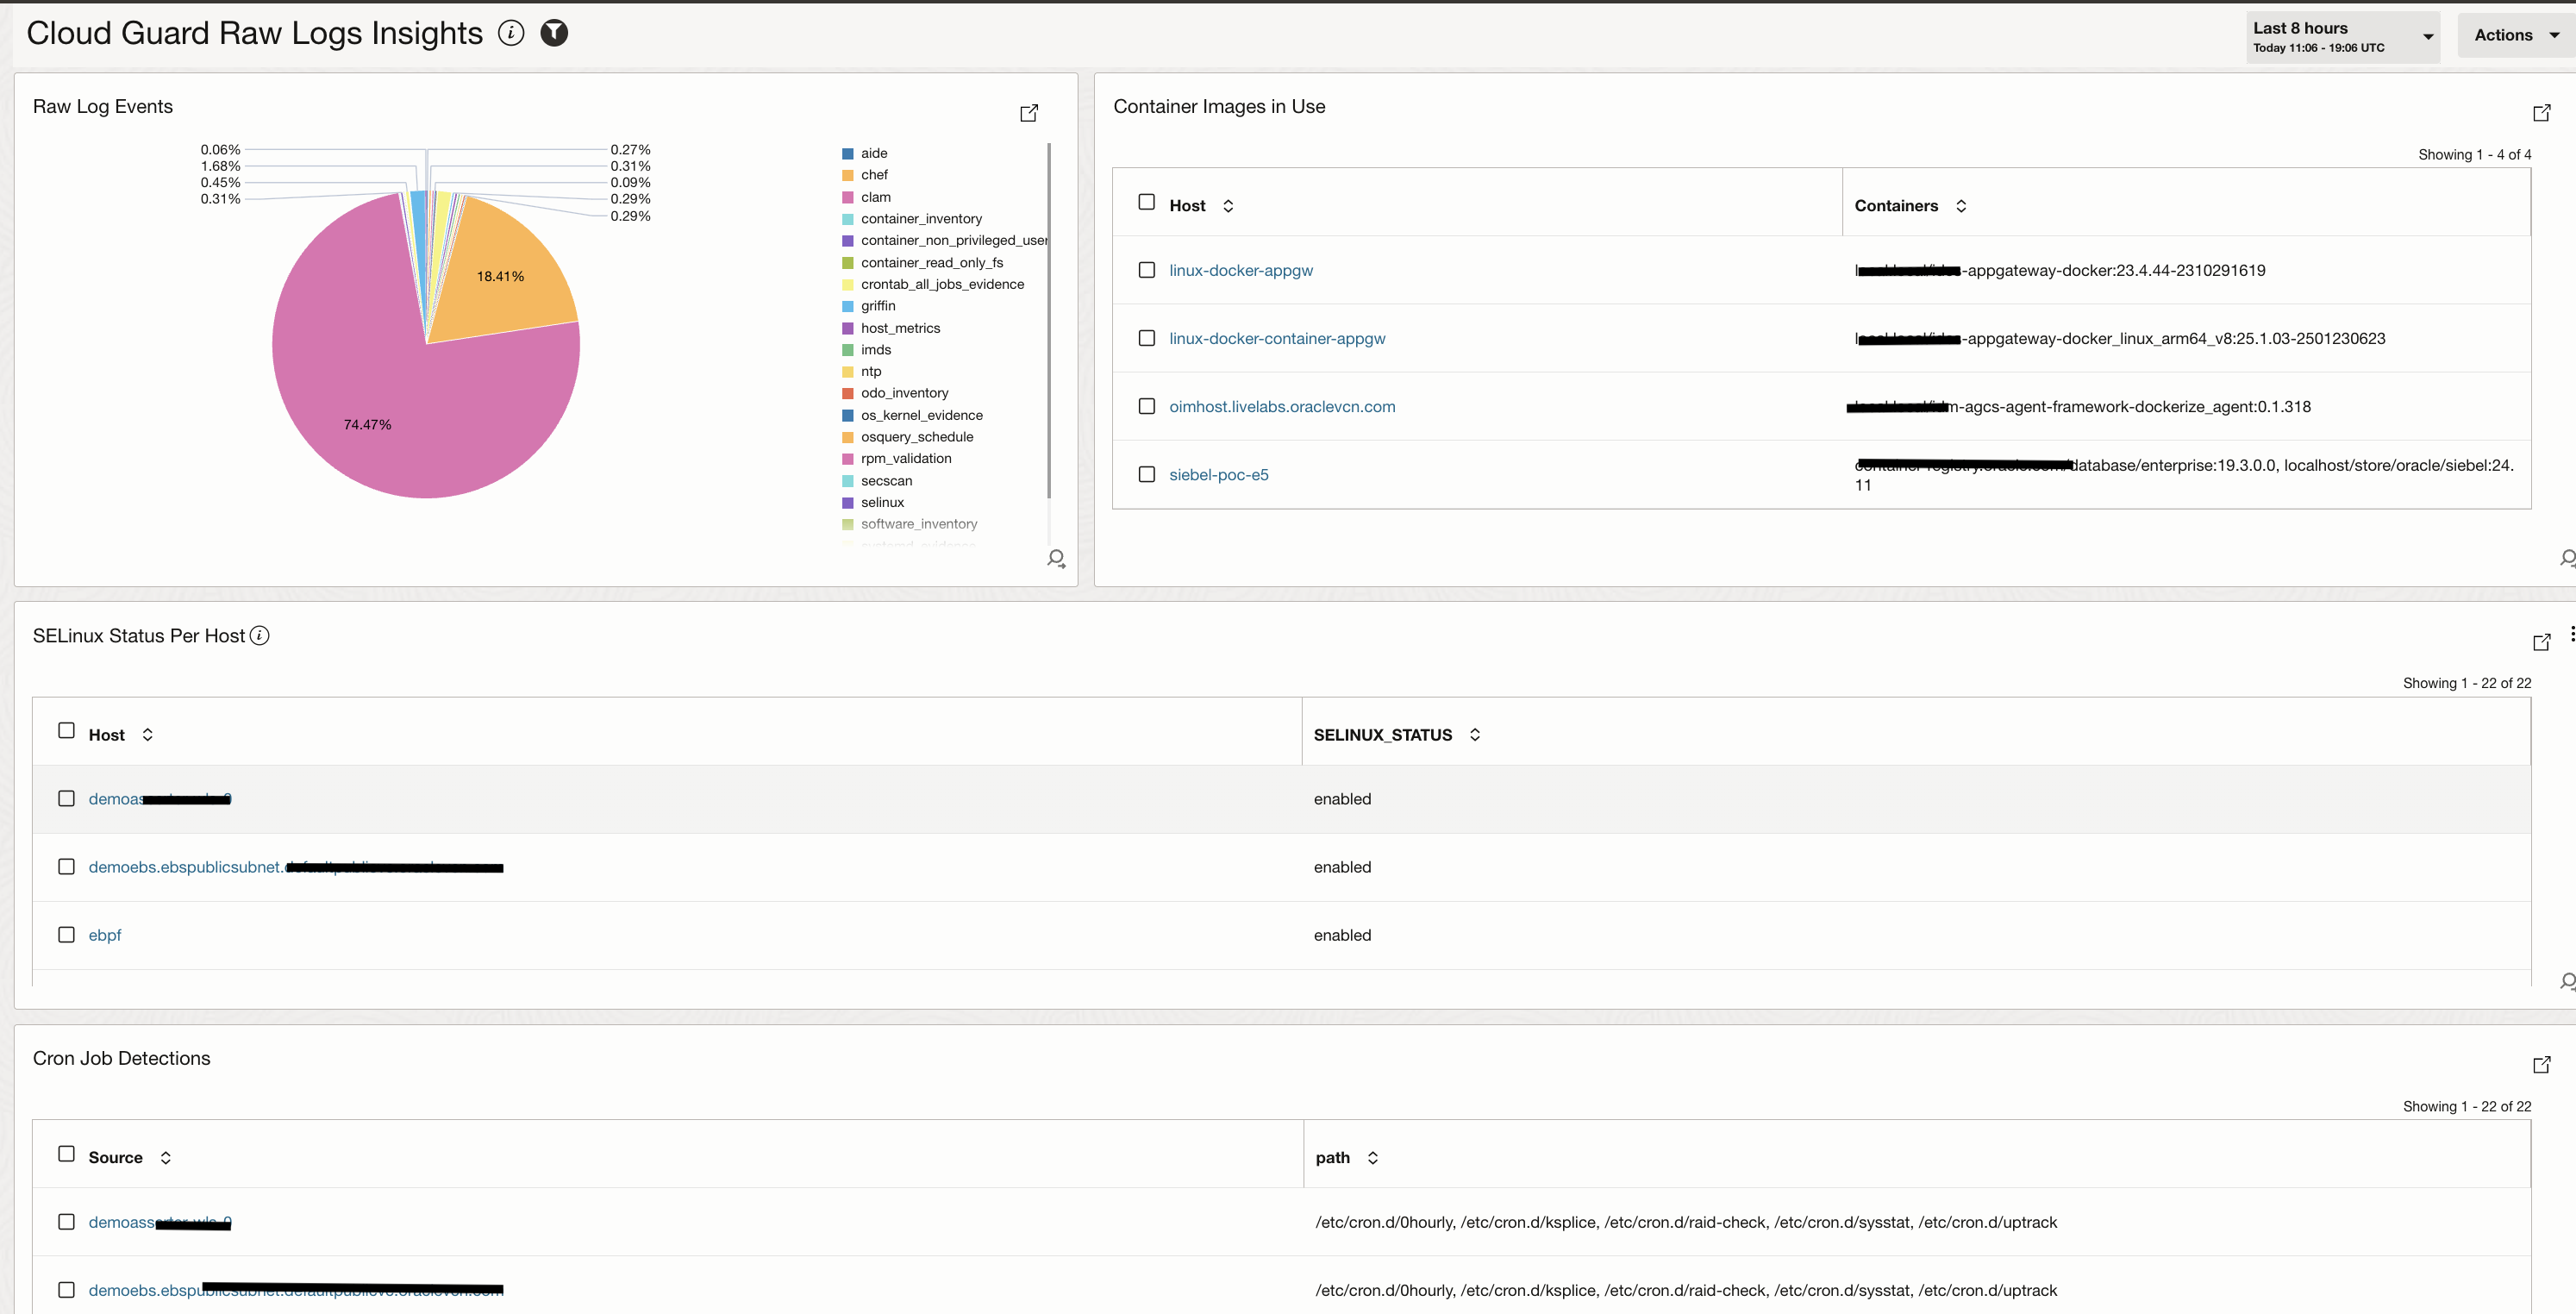
Multiple searches can be created using advanced query language in Logging Analytics and these searches can be saved as widgets and added to a dashboard. The image below shows a sample dashboard created on top of Cloud Guard Raw Logs and these are the widgets added:
- Raw Log Events: Percentage of logs coming from all the events cetgorized in the raw logs.
- Container Images in Linux: Fetching containers for every host.
- SELinux Status Per Host: Publishing status of SELinux on every host
- Cron Job Detections: Tracking cron files on every host.
Collecting Cloud Guard Query Result Logs and Analyzing in Logging Analytics
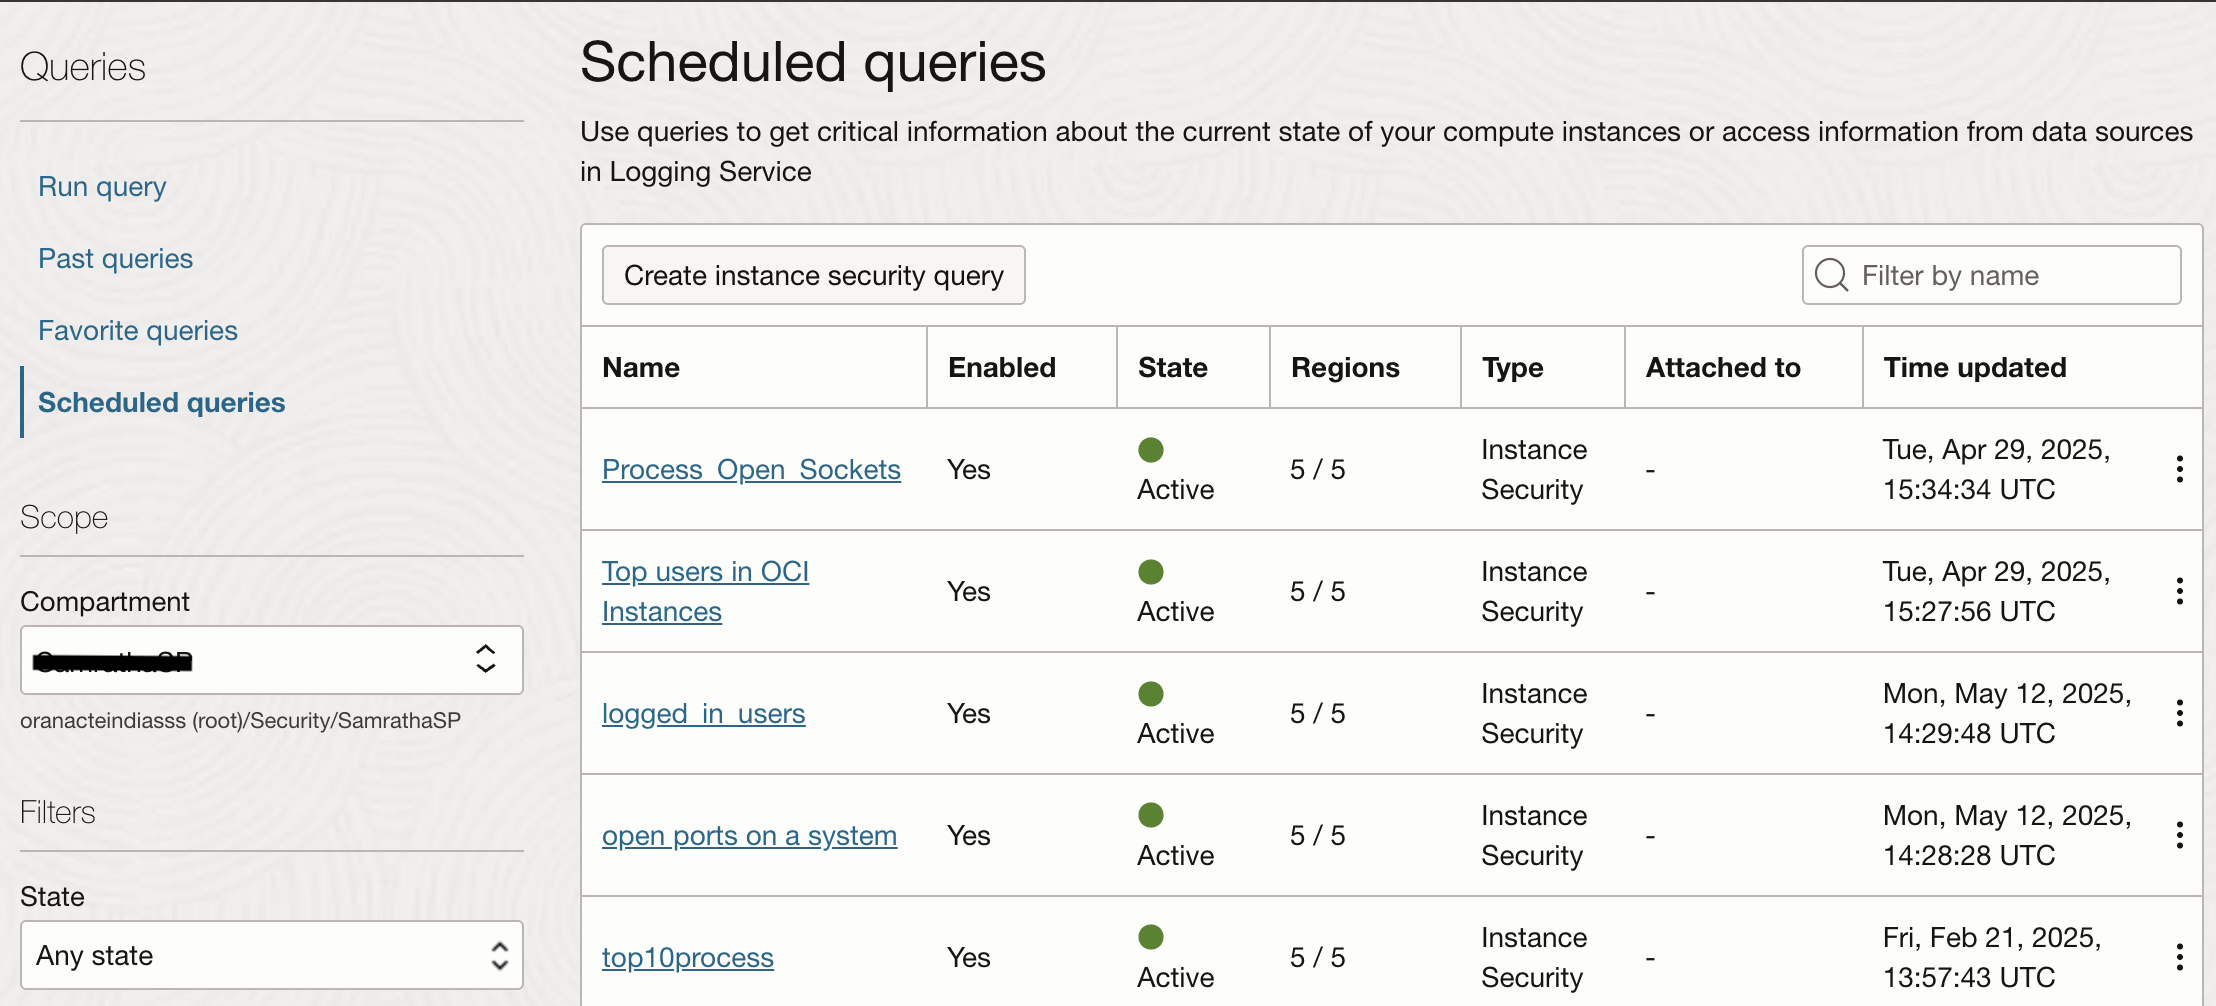
Custom queries let you to inspect instances in real time. You can run a query over all targets or specific targets, or over a managed list of instances or a custom list of instances. Onve you are happy with the results of a query you can schedule them to run on defined interval. The image below shows couple of queries scheduled to run on compute instances in specific tagets.
Enable Logs on Scheduled Queries
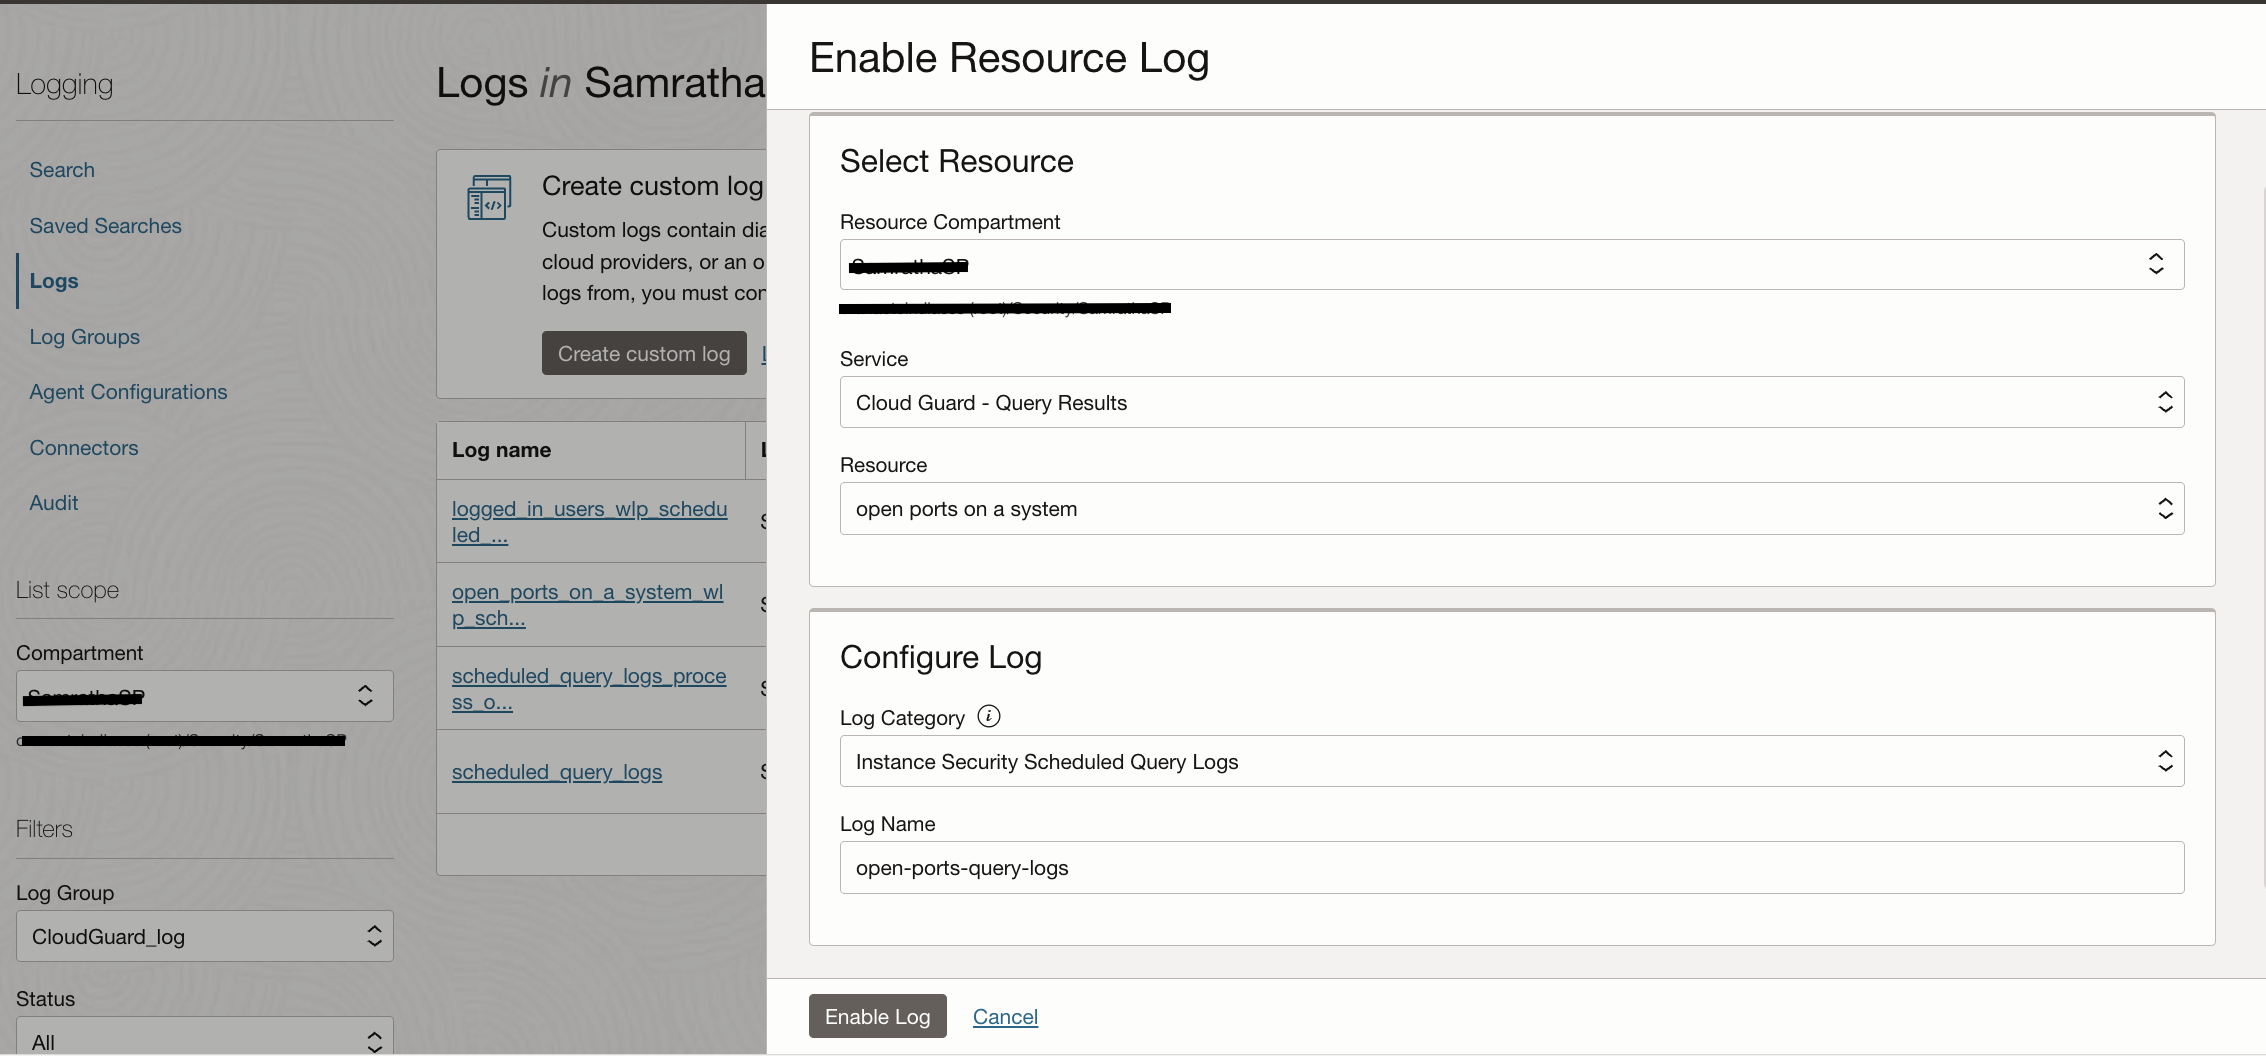
Navigate to Observability & Management in the OCI Console and click on Logging -> Logs. From here, you can enable Service Logs to collect Query Logs from the Scheduled Queries.
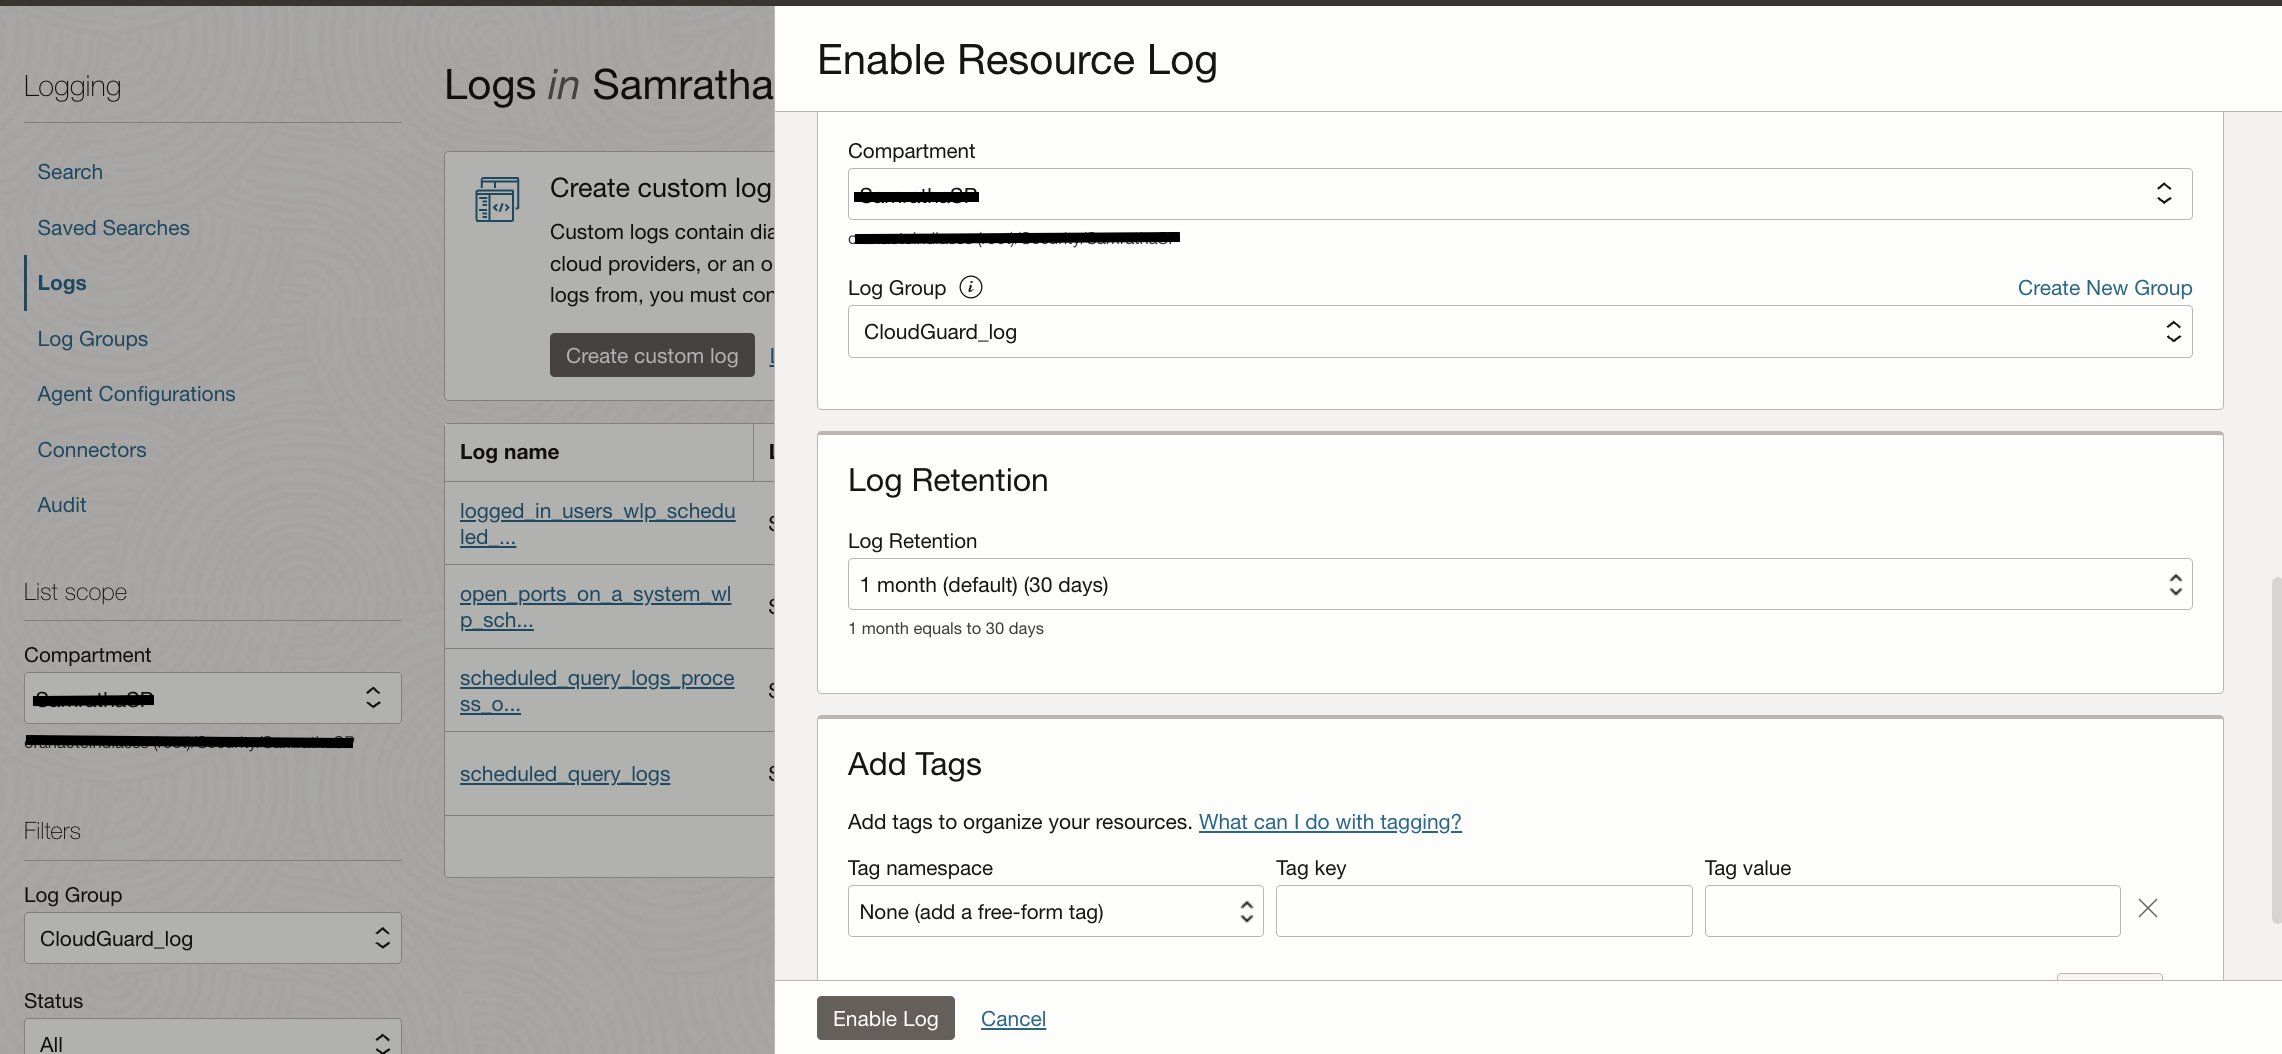
Select the Compartment where queries are created, Service name and the query name in Resource. Choose the Log Category as Instance Security Scehduled Query Logs and give a Log Name. Log Groups are pre-requisite to enabling any Service Logs as they are logical containers for logs. Choose a retention period between 1 month to 6 months in order to store these logs in OCI Logging service.
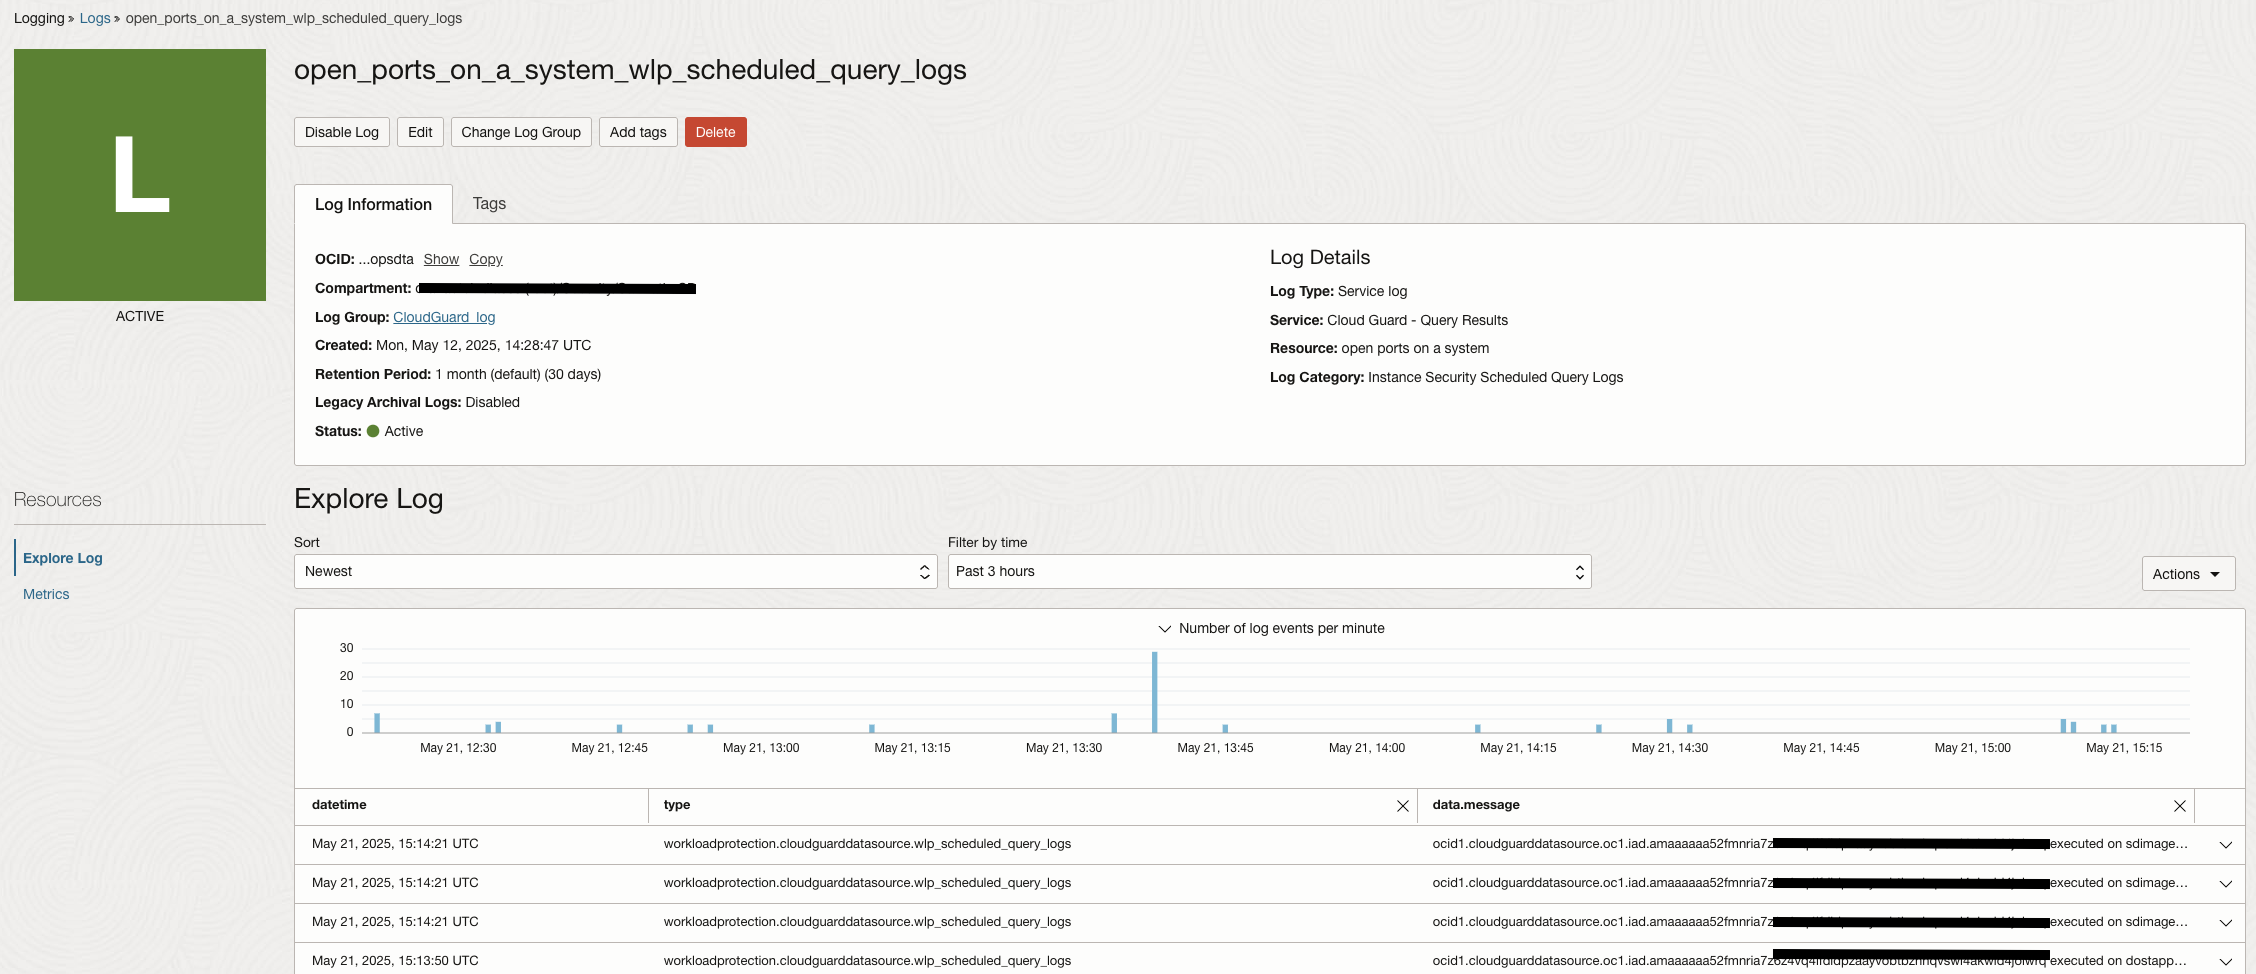
The log collection can be verified by clicking on the log name as shown in the image below.
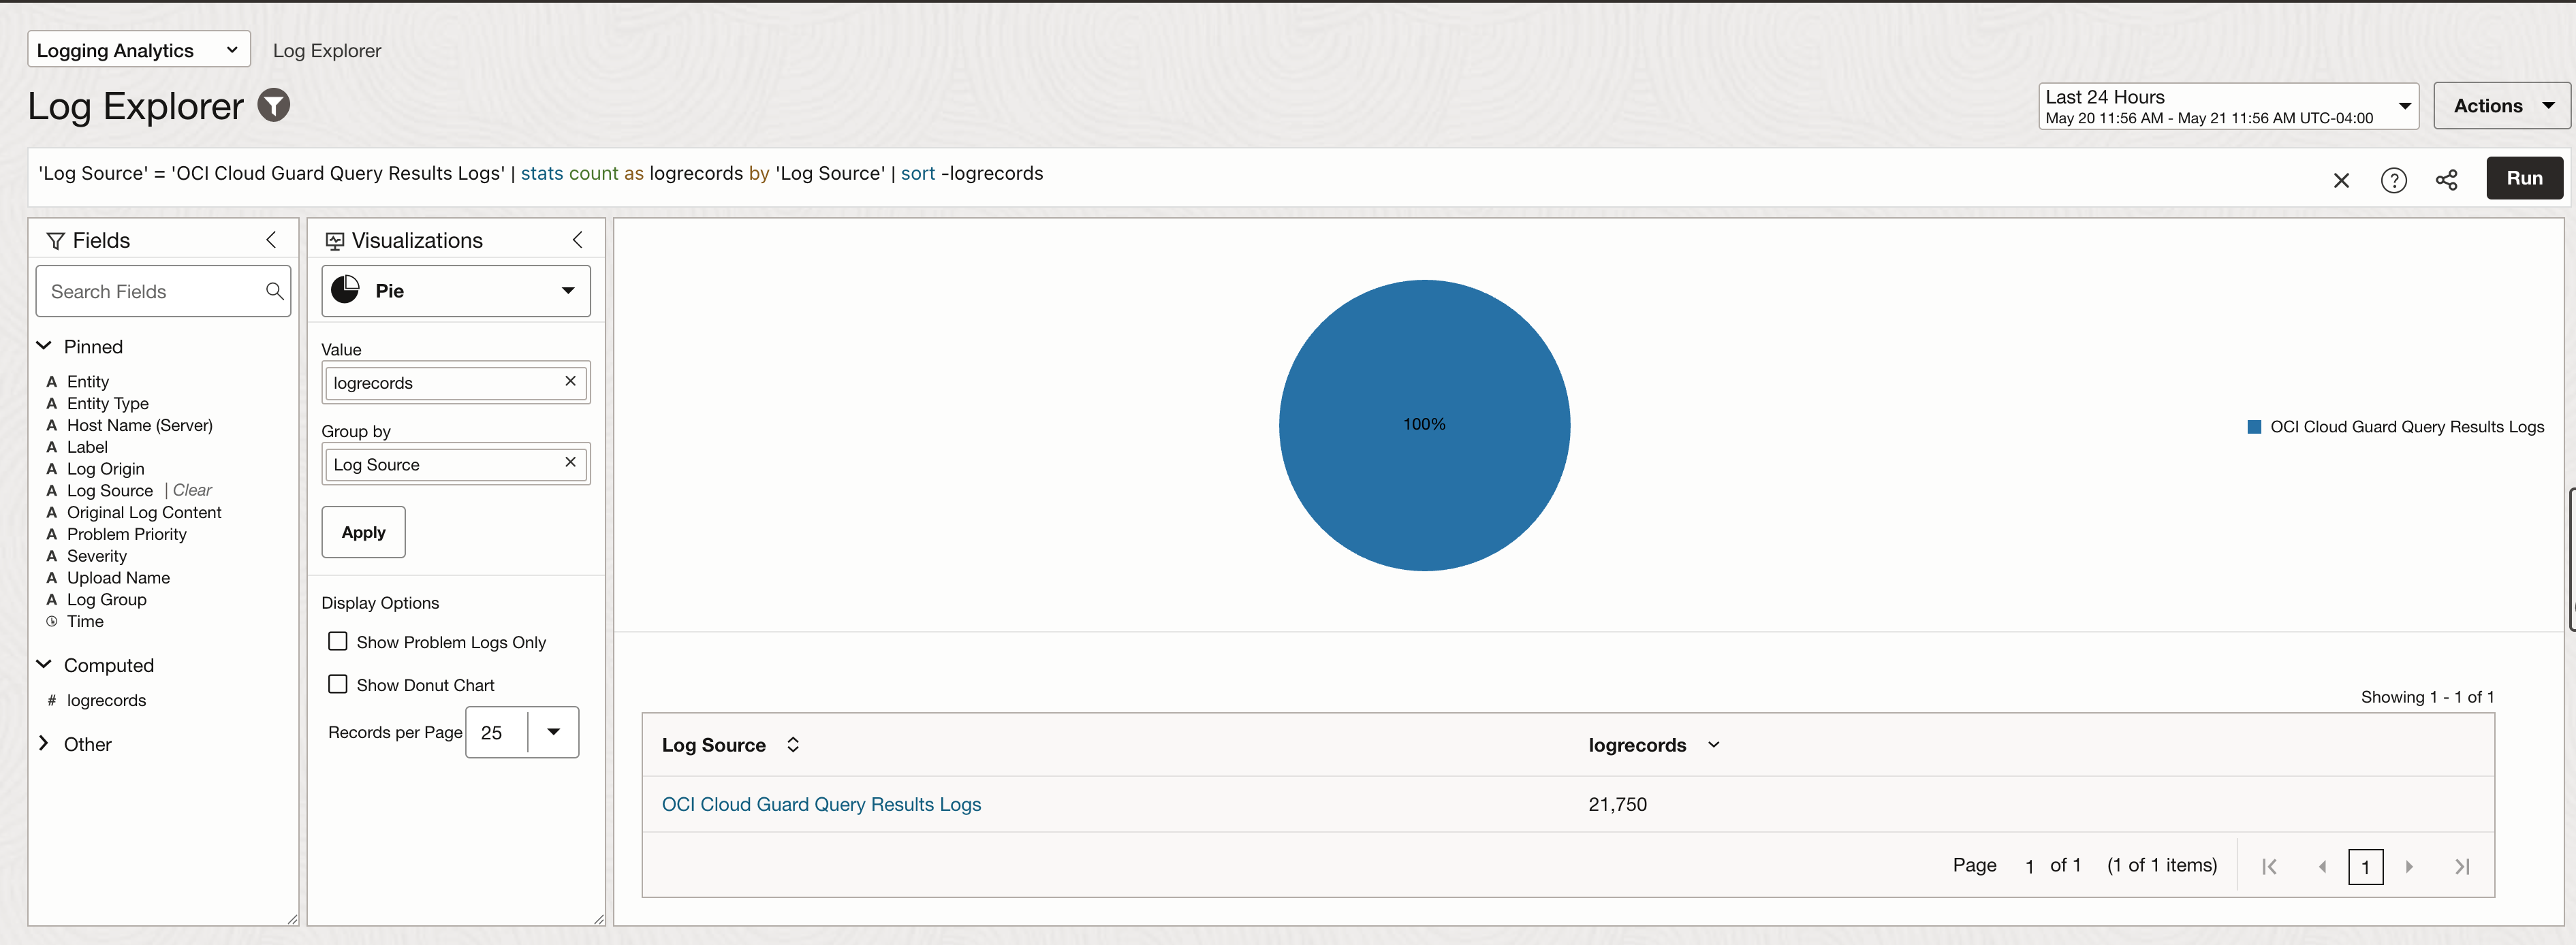
You can enable logs on different Cloud Guard Scheduled Queries and move them to Logging Analytics for advanced analysis using Connector Hub. Once the query results logs are available in Logging Analytics they will all be grouped under OCI Cloud Guard Query Results Logs as shown in the image below.
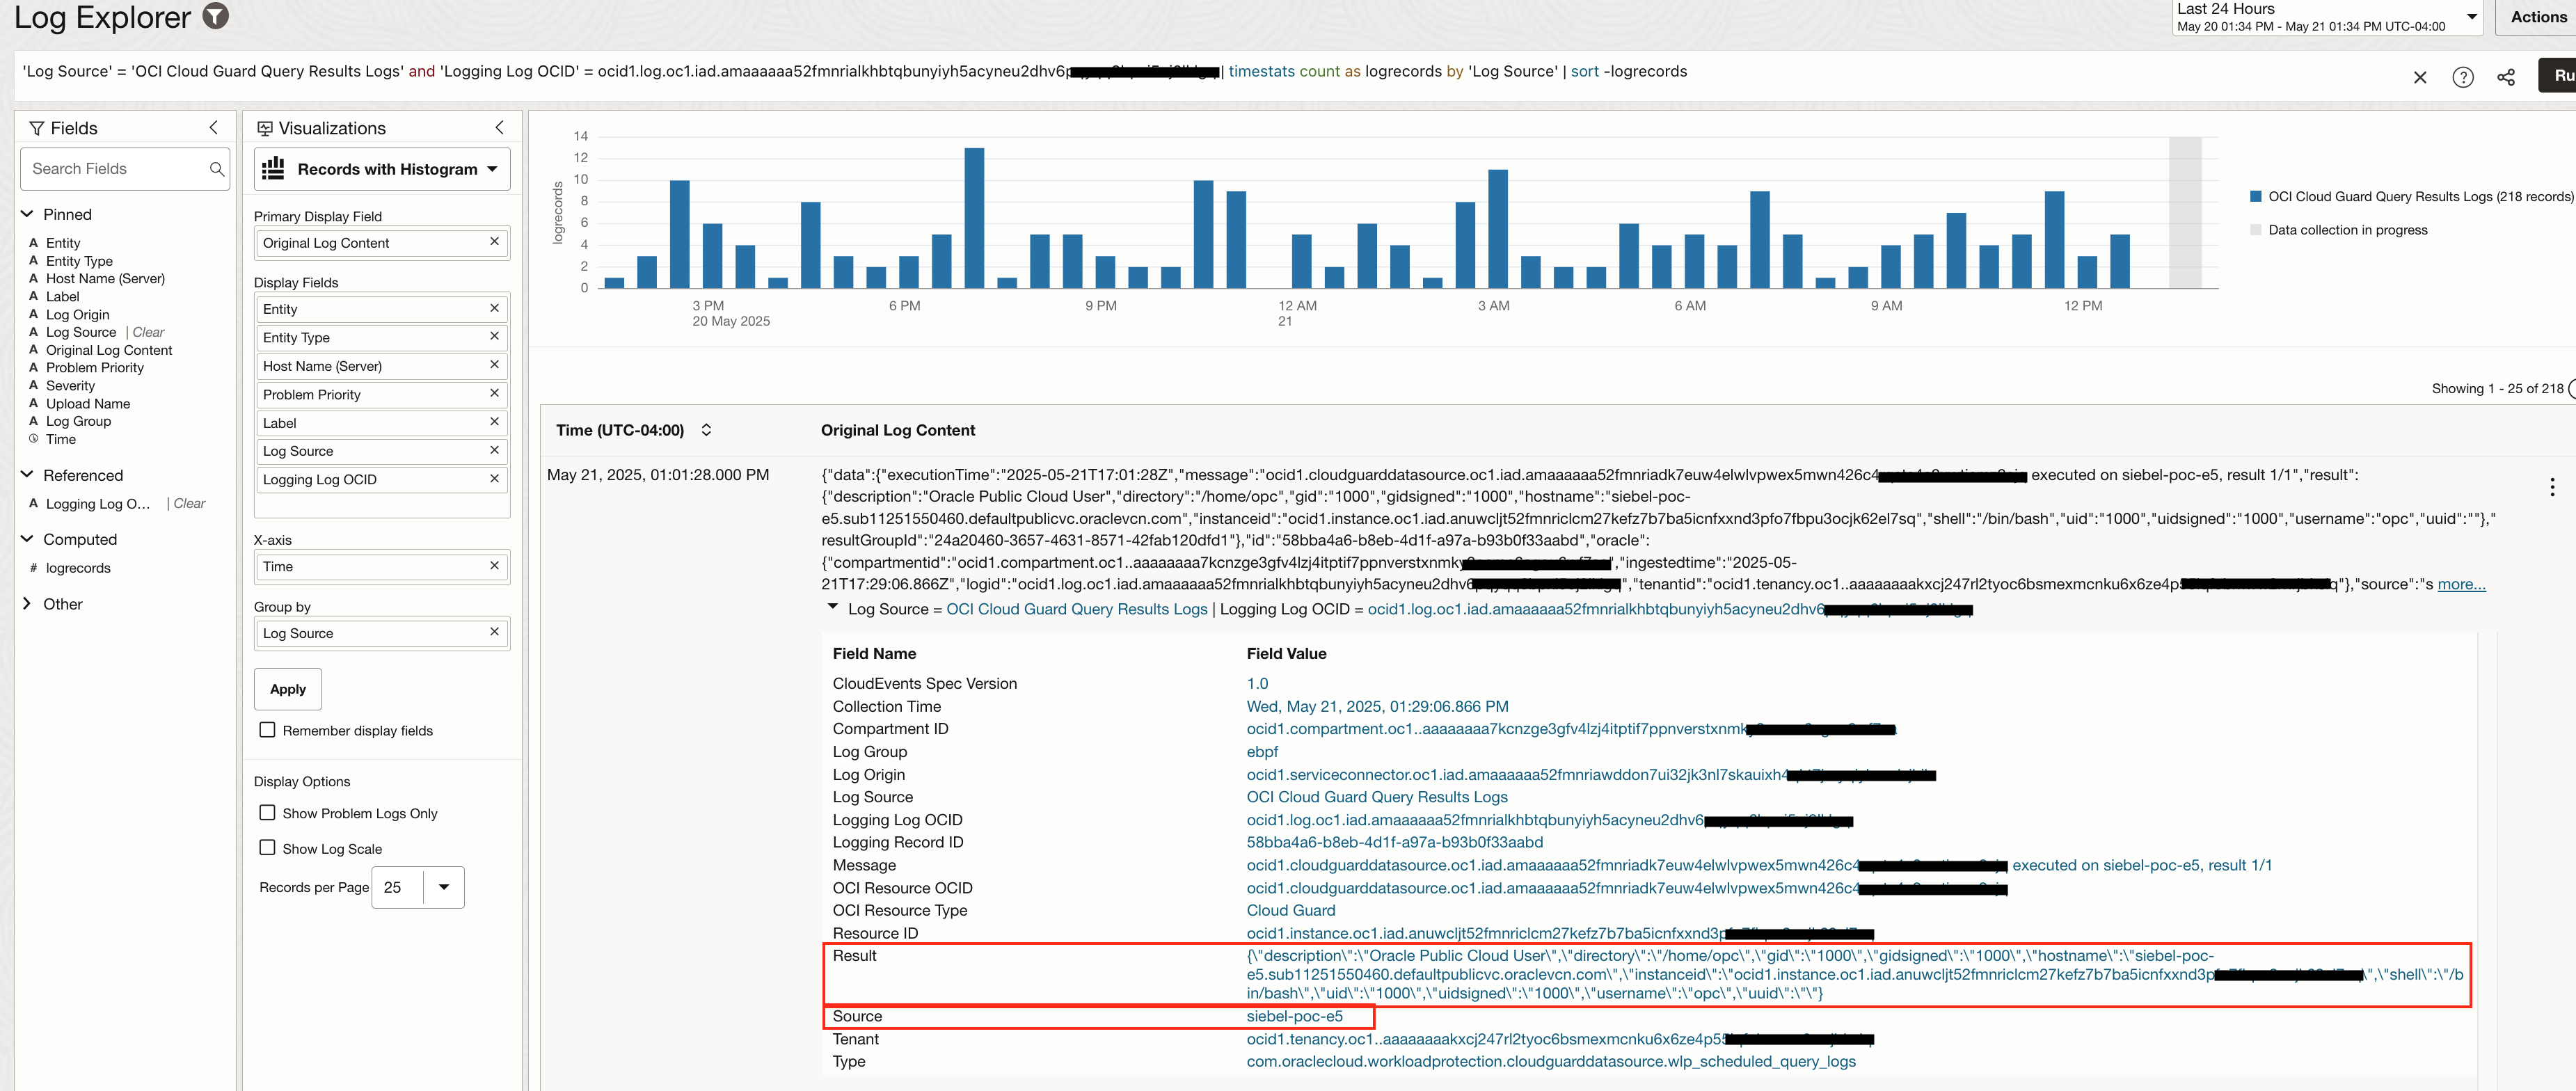
You can deep dive into one particular log set up on an individual query by changing the visualization type and choosing the Logging Log OCID. The image below shows log results for query search done on “Users in an OCI instance”. Corresponding log OCID is selected. Result section in each log event shows information such as instance name, instance id, username and its uid.
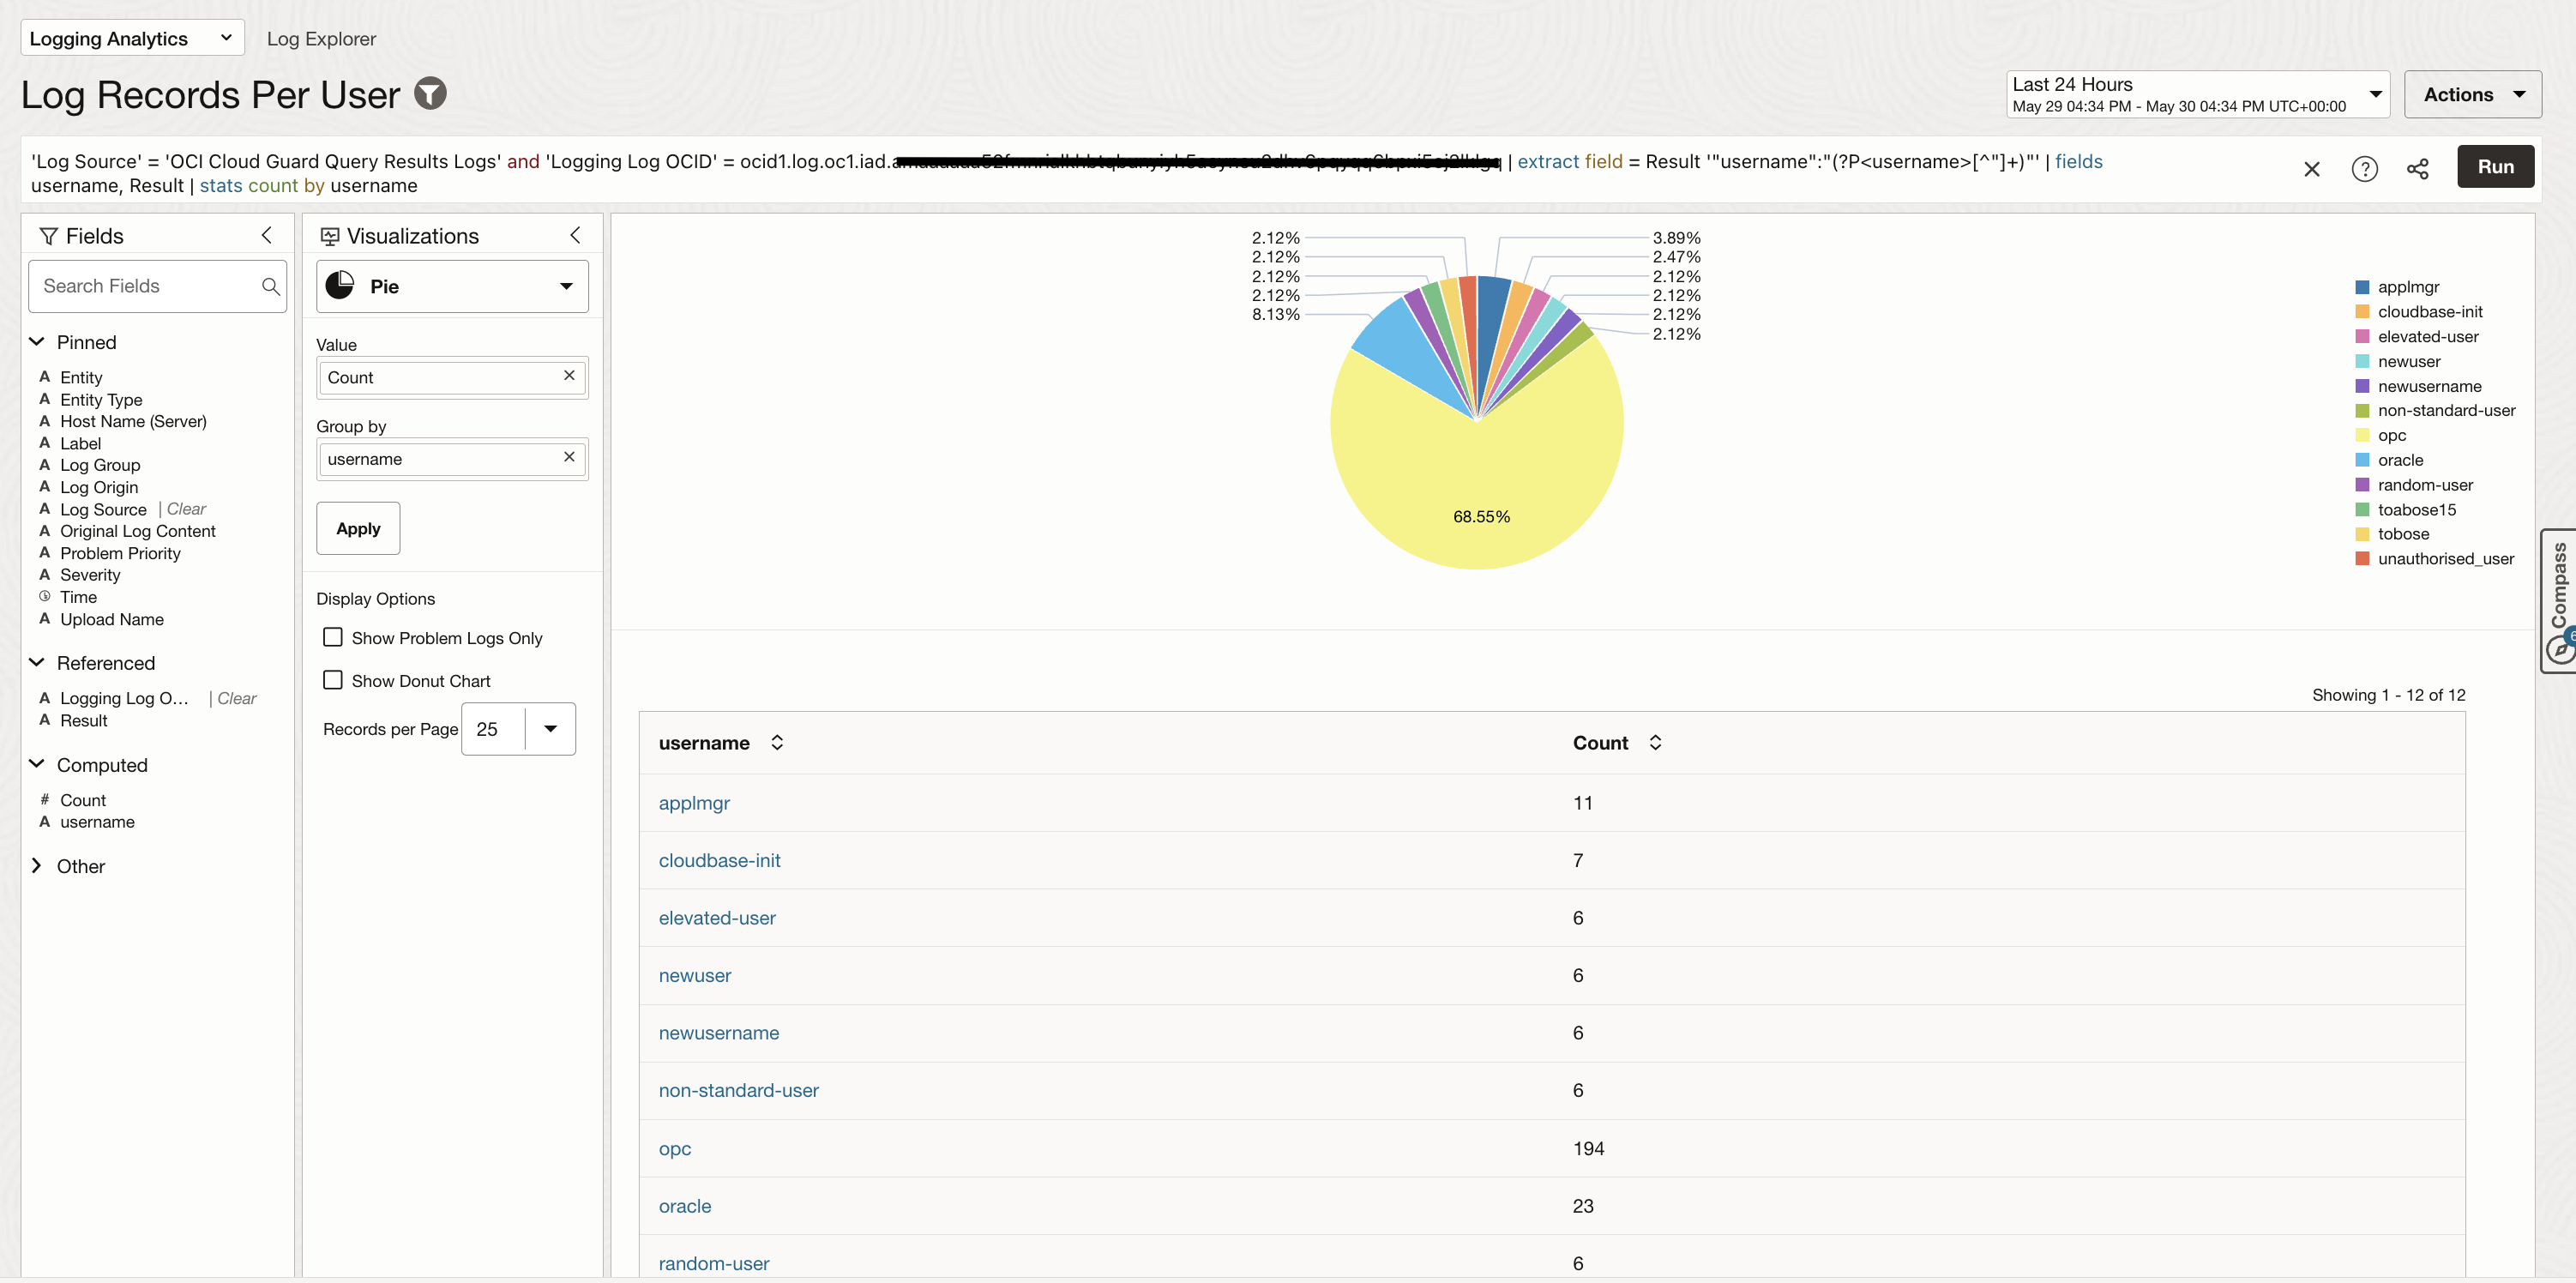
You can step up the logging analytics query by leveraging syntax capability and extract information using regex patterns. The image below shows how can we extract username from results and then use it to show a distribution of log records per user across all instances that were scanned by the cloud guard query.
Sample Query for username extraction: ‘Log Source’ = ‘OCI Cloud Guard Query Results Logs’ and ‘Logging Log OCID’ = ocid1.log.oc1.iad…………… | extract field = Result ‘”username”:”(?P<username>[^”]+)”‘ | fields username, Result | stats count by username
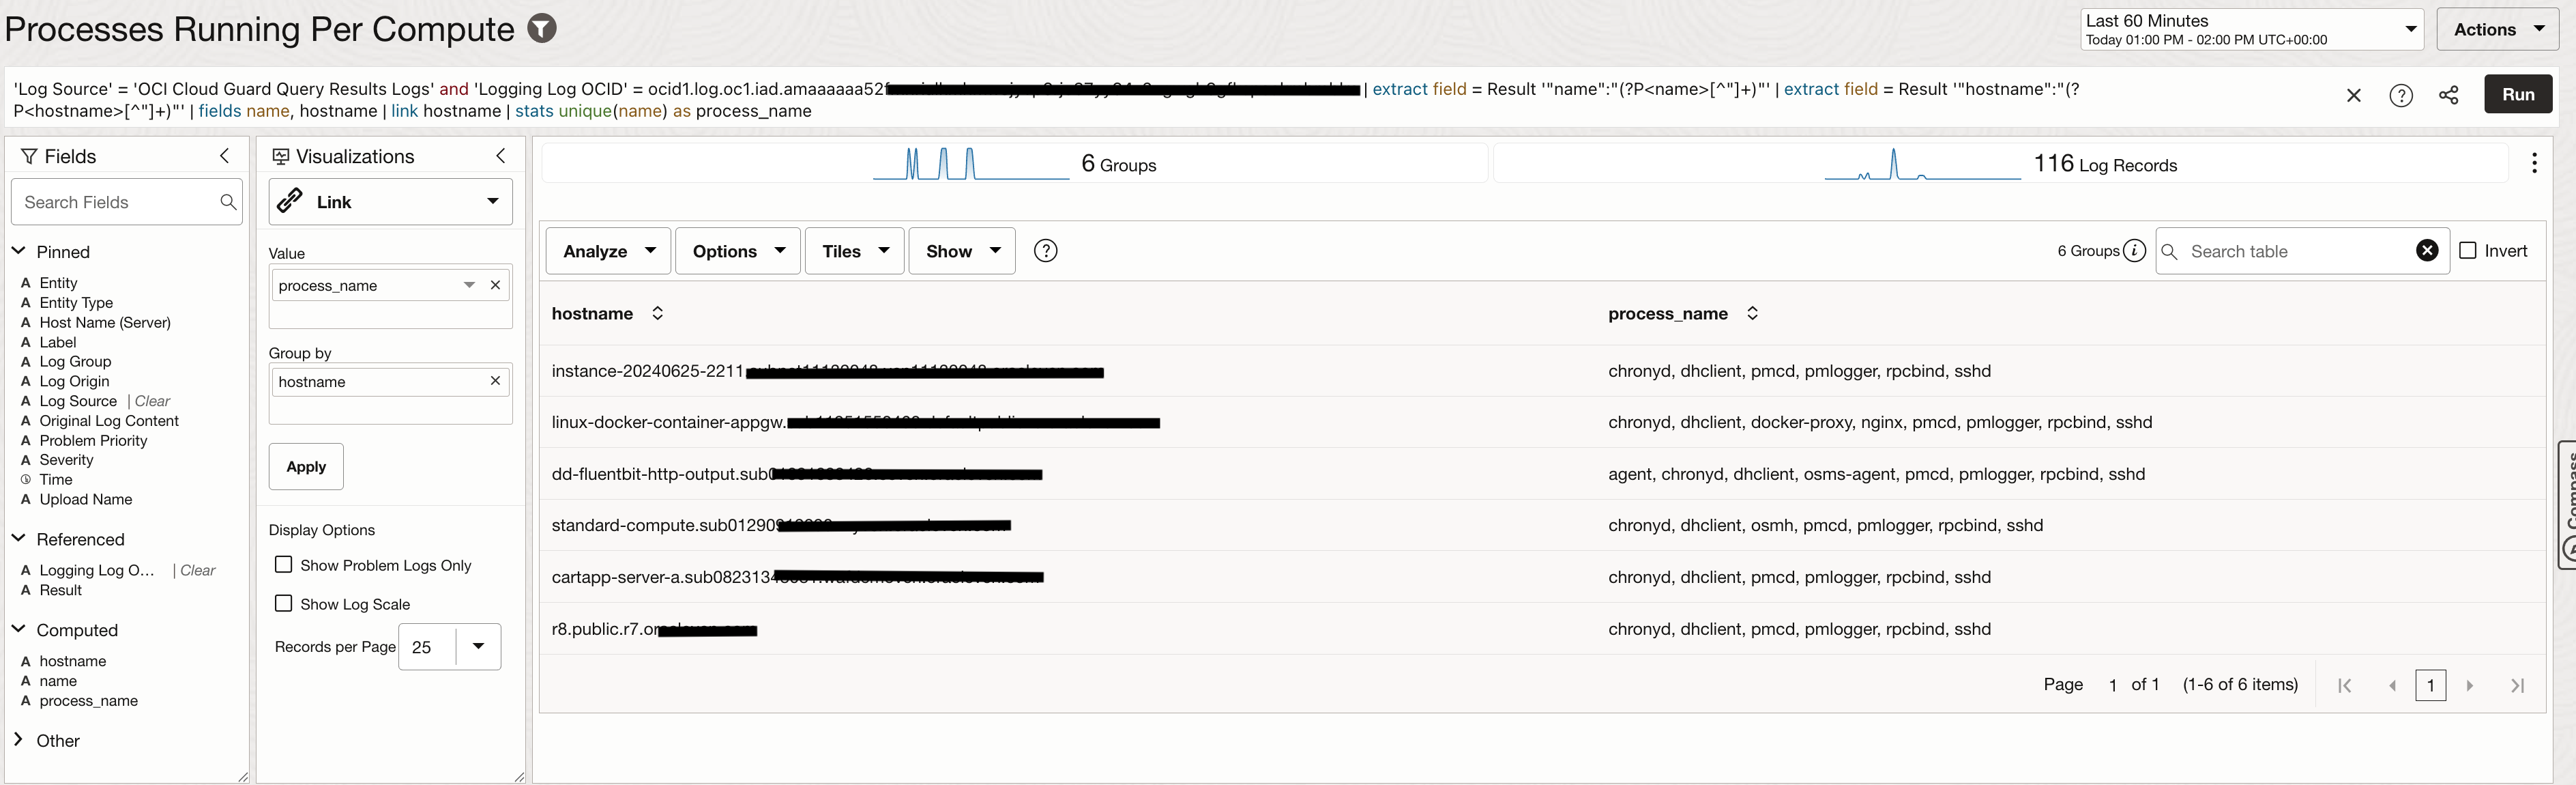
Another example is to search for processes running on every compute and use the logs to build a widget that would highlight process names for every compute.
Sample Query for hostname extraction and filter for processes: ‘Log Source’ = ‘OCI Cloud Guard Query Results Logs’ and ‘Logging Log OCID’ = ocid1.log.oc1.iad…….. | extract field = Result ‘”name”:”(?P<name>[^”]+)”‘ | extract field = Result ‘”hostname”:”(?P<hostname>[^”]+)”‘ | fields name, hostname | link hostname | stats unique(name) as process_name
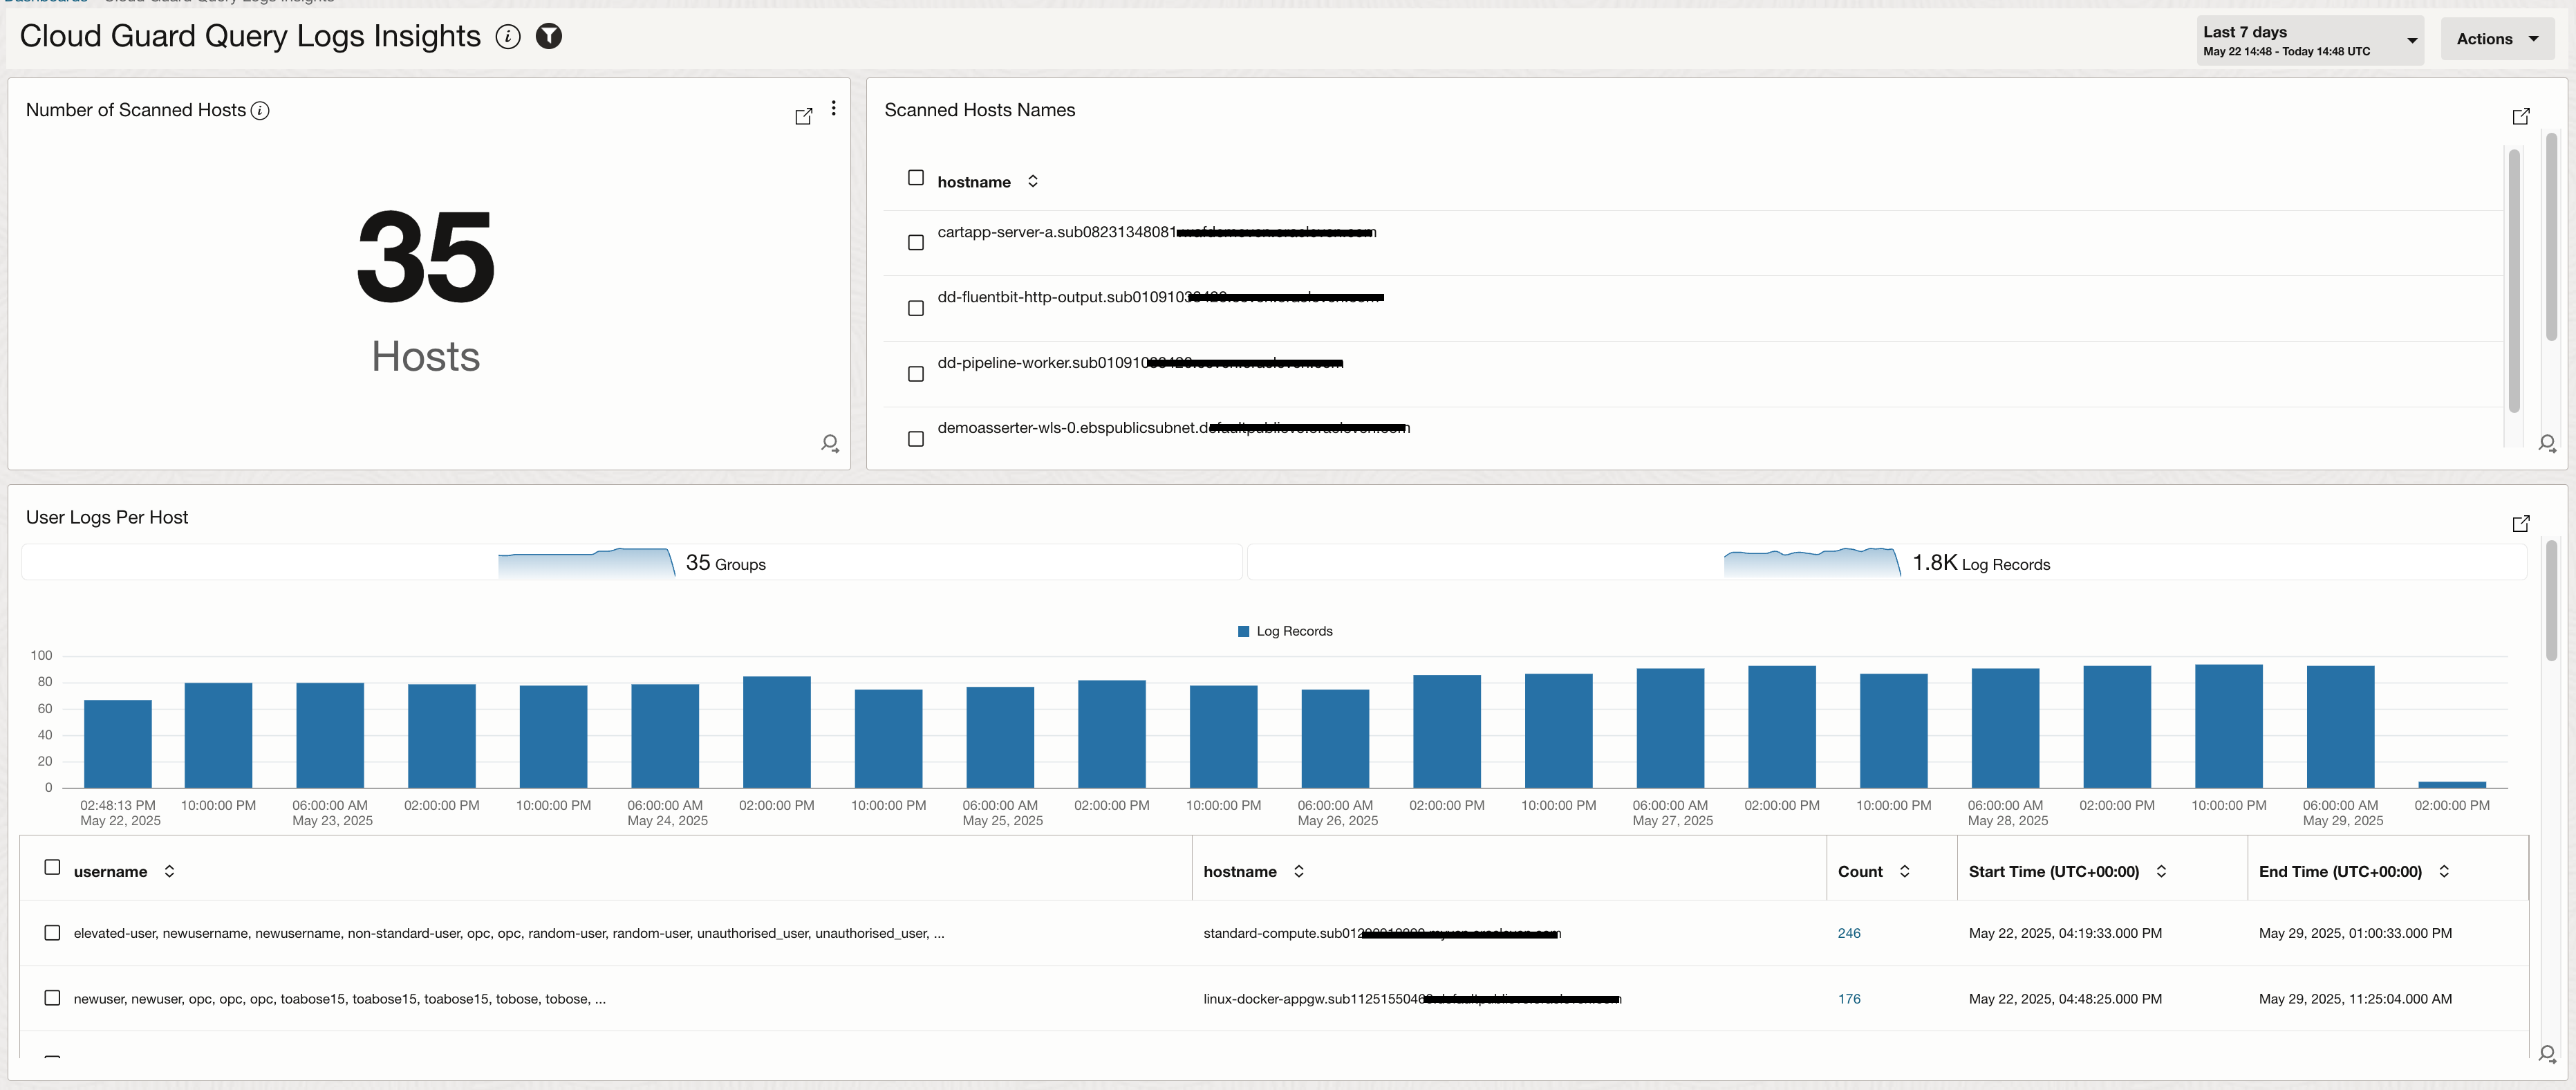
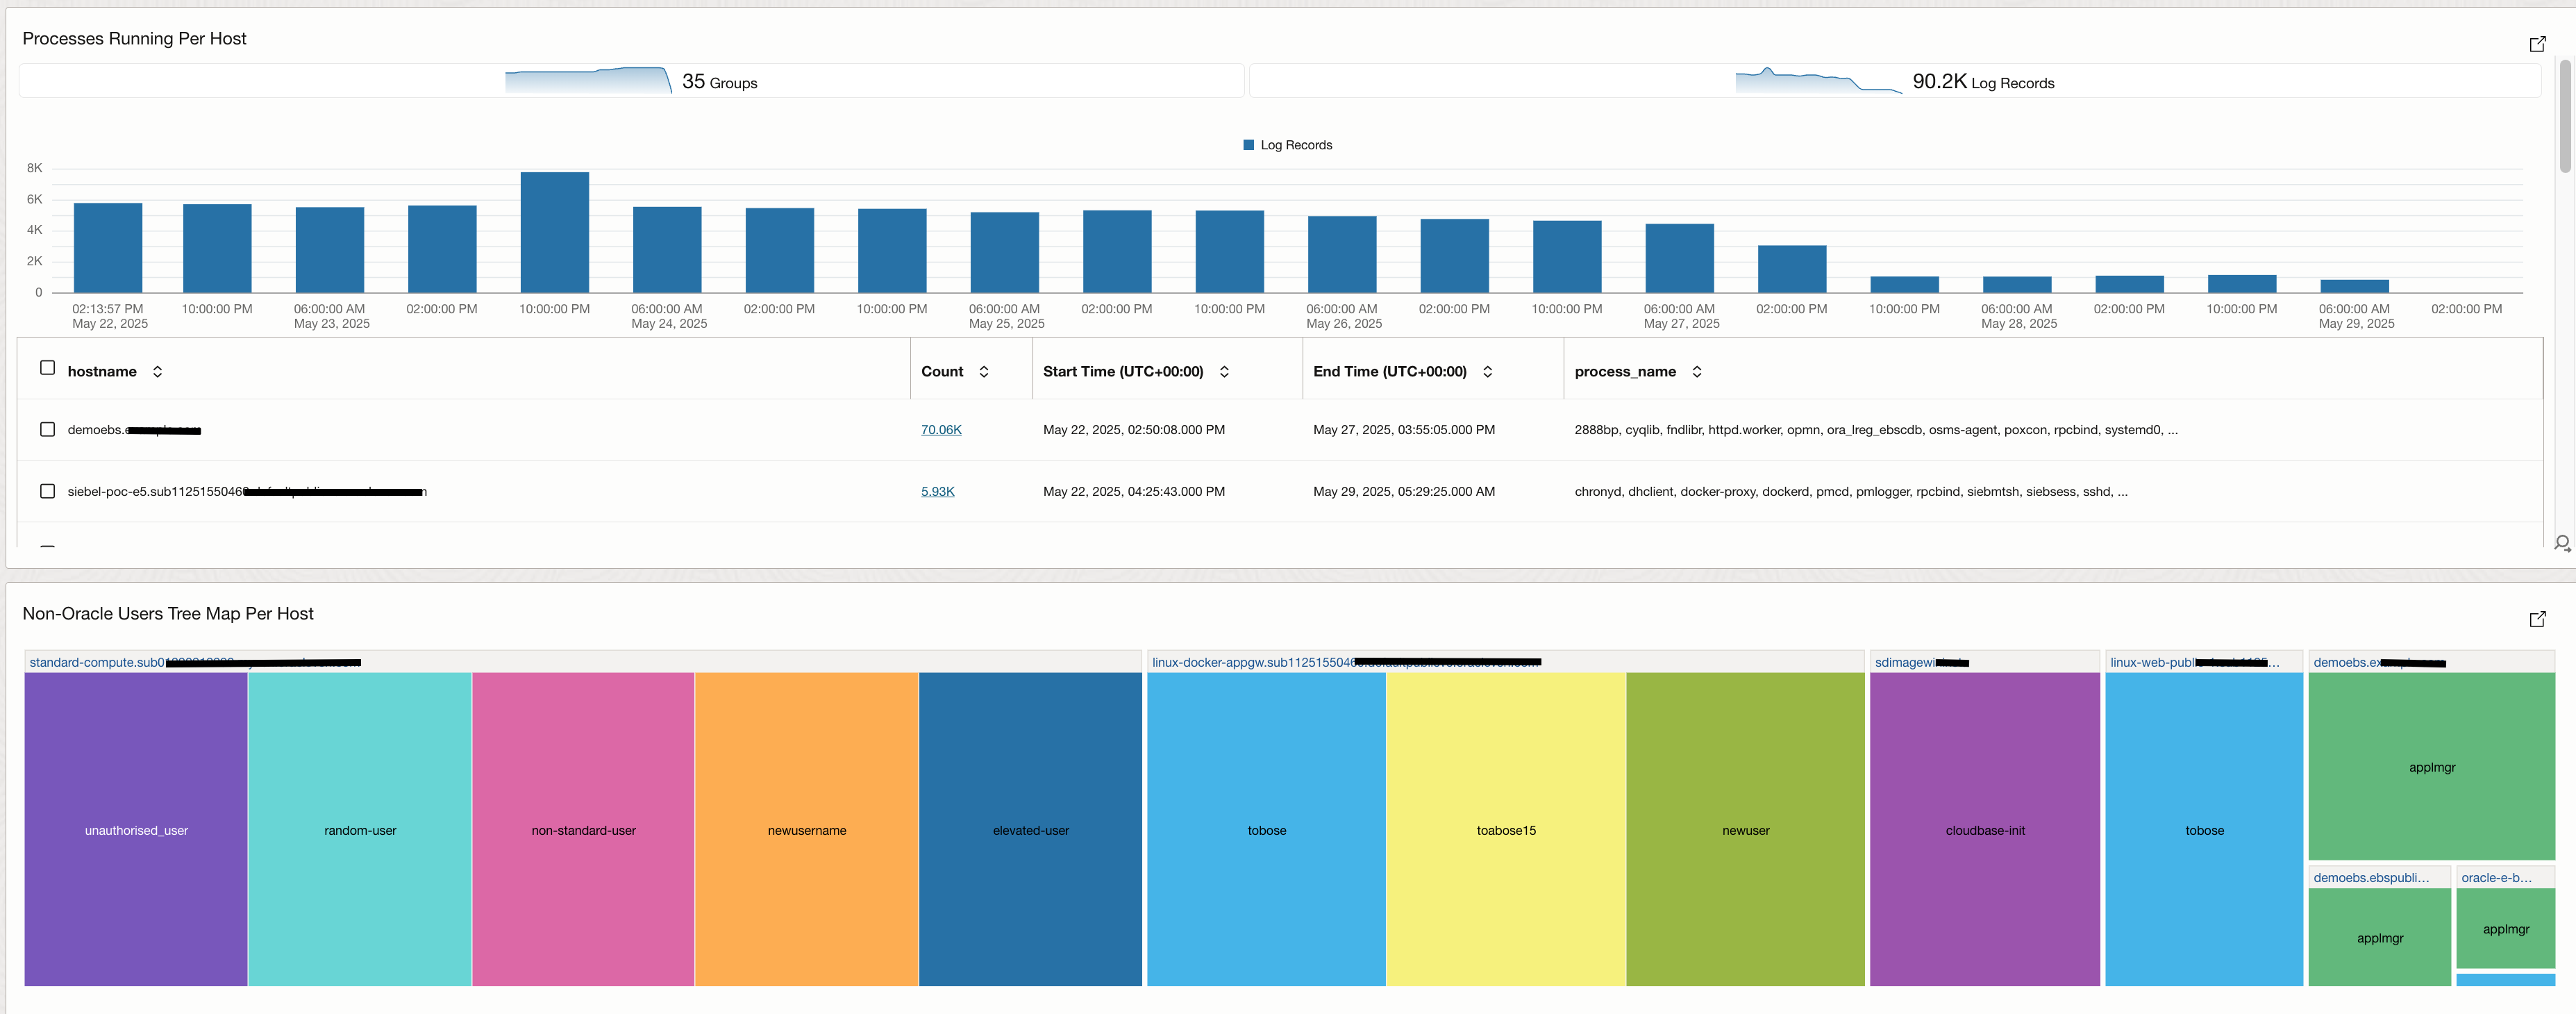
Multiple searches can be created using advanced query language in Logging Analytics and these searches can be saved as widgets and added to a dashboard. The image below shows a sample dashboard created on top of Cloud Guard scheduled queries and these are the widgets added:
- Number of scanned hosts: The scheduled queries runs across a defined target which would include hosts that are provisioned in that target or compartment. We look at how many hosts are being scanned.
- Scanned Hosts Names: We look at the names of the hosts being scanned by the queries.
- User Logs Per Host: We look at how many logs are generated by different users on each hosts in both tabular and bar chart format.
- Processes running Per Host: We focus on a specific query that looks for top processed on each compute and use the logs to highlight different processes running on host by host basis.
- Non-Oracle Users Per Host: Highlighting non-oracle users on every host that’s being scanned by using tree map visualization.
Set Up Alerts on Important Log Events
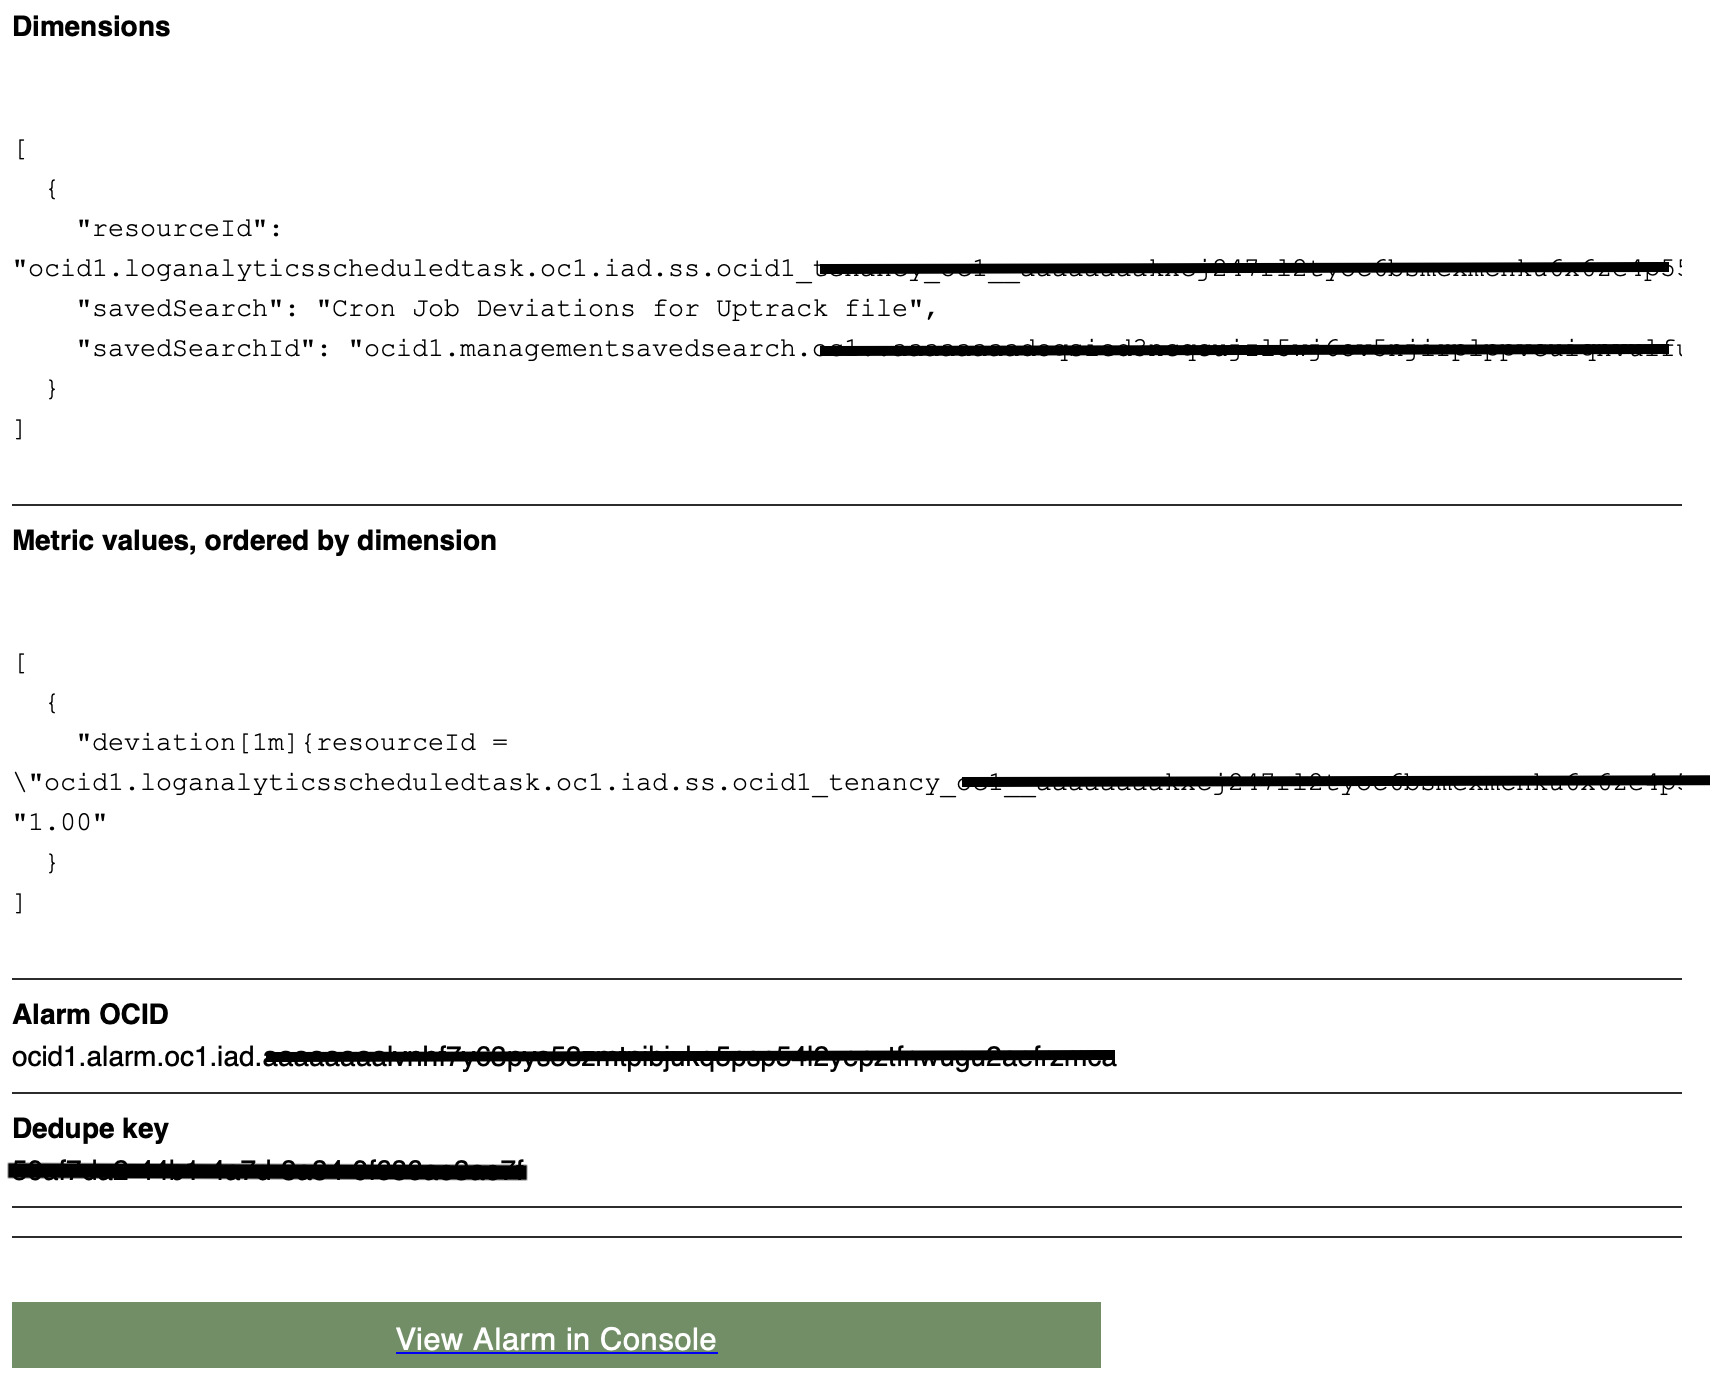
Logging Analytics lets you create Detection Rules to detect events of your interest and post metrics in OCI Monitoring service. The detection can be at ingest time when the log content matches a label and additional settings, or a scheduled search based on a query. We create a detetction rule on top of a sample query which looks for changes to an uptrack file running a cron job.
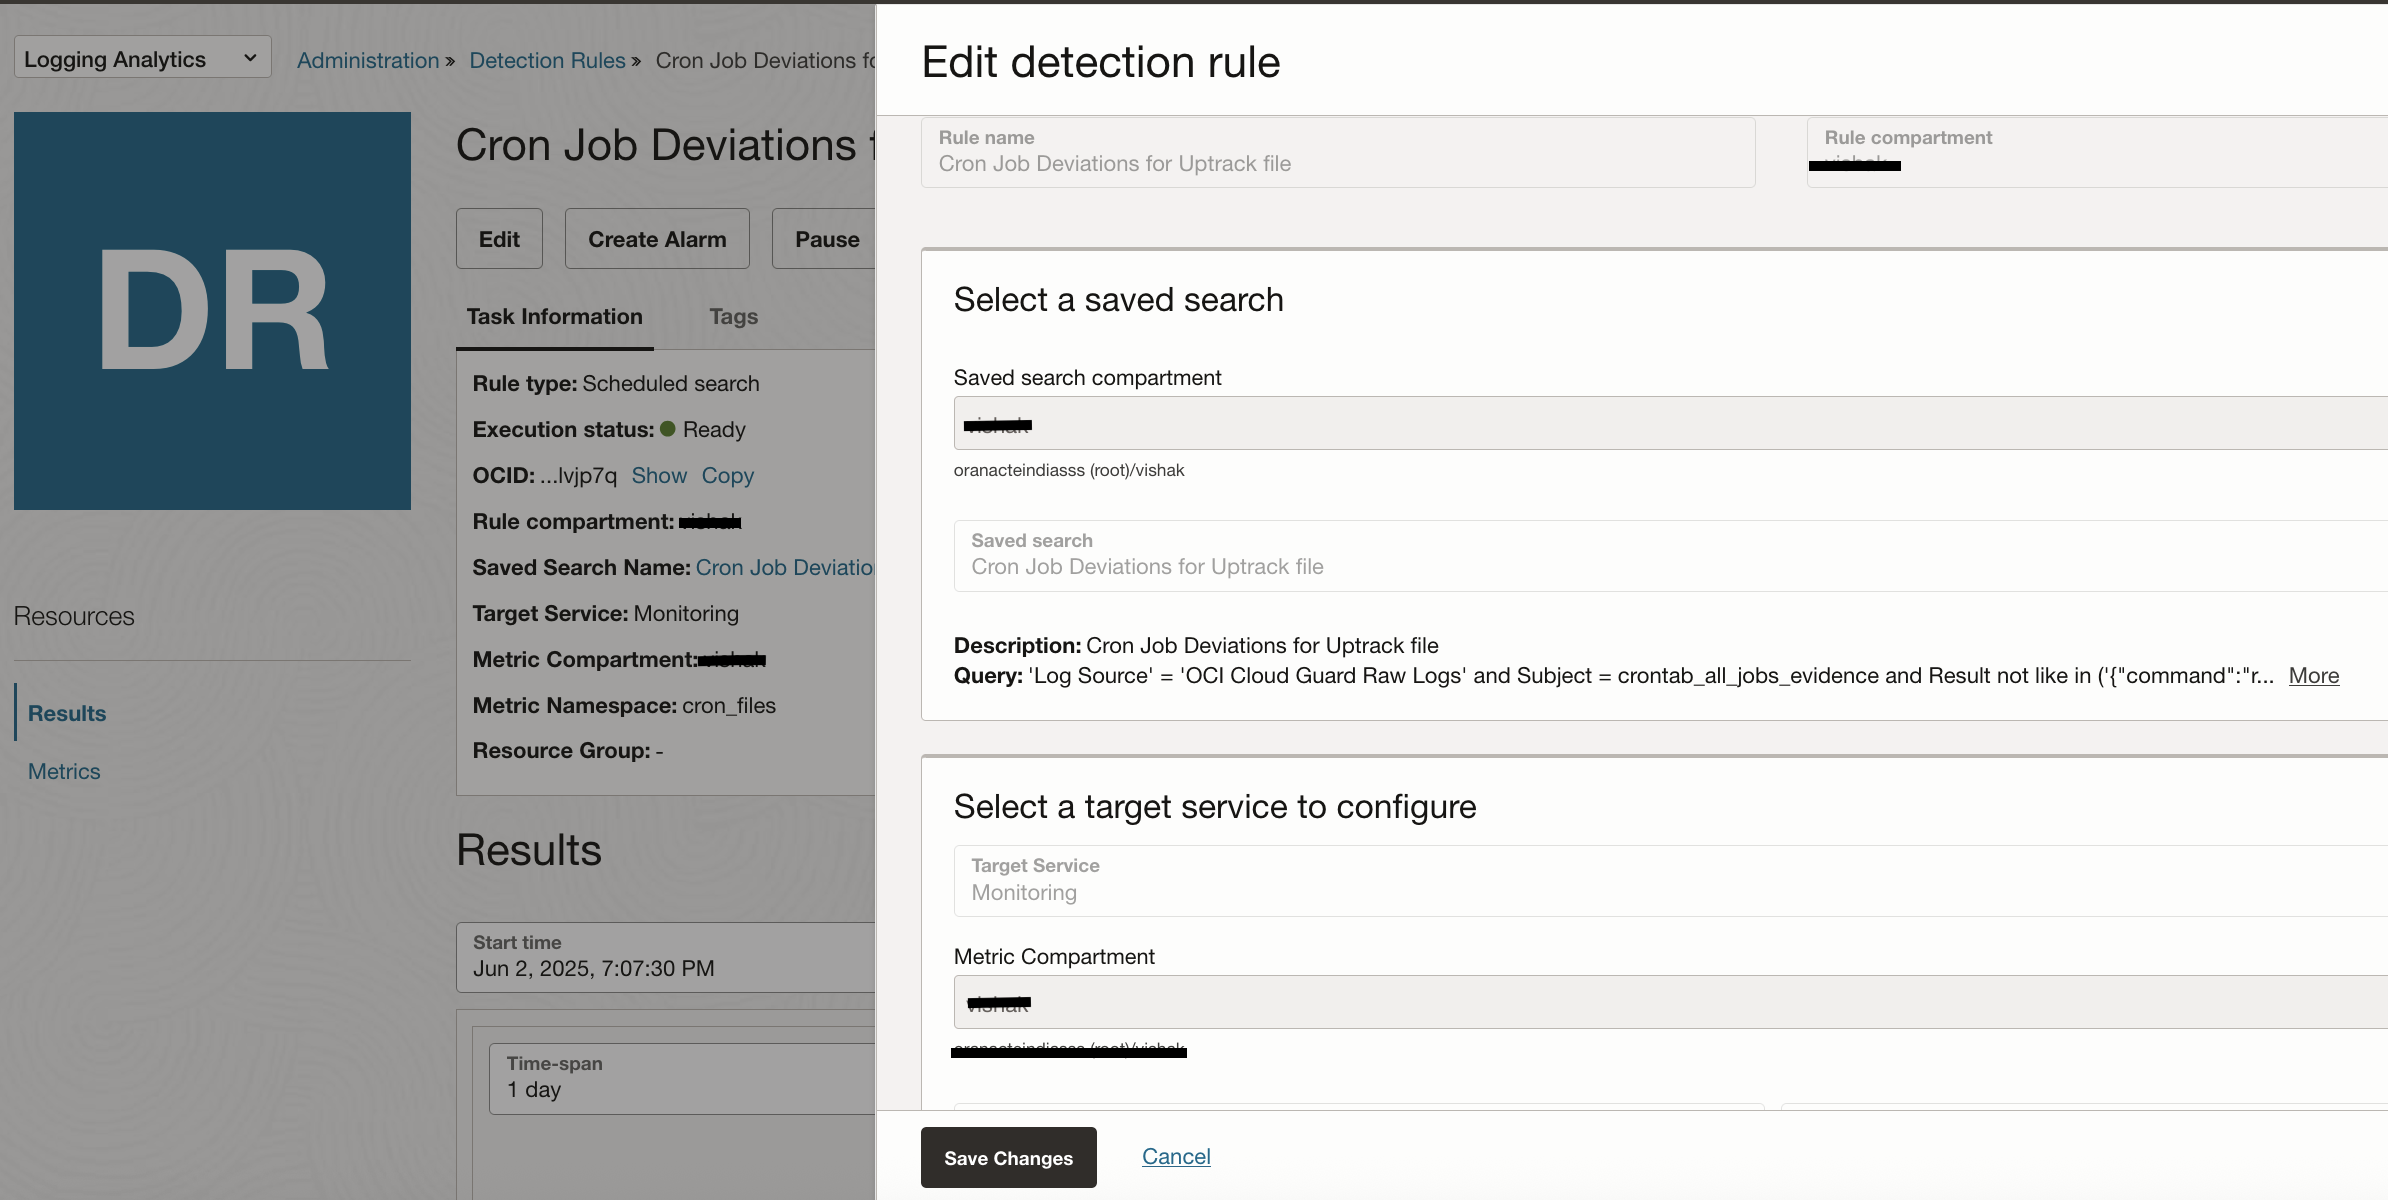
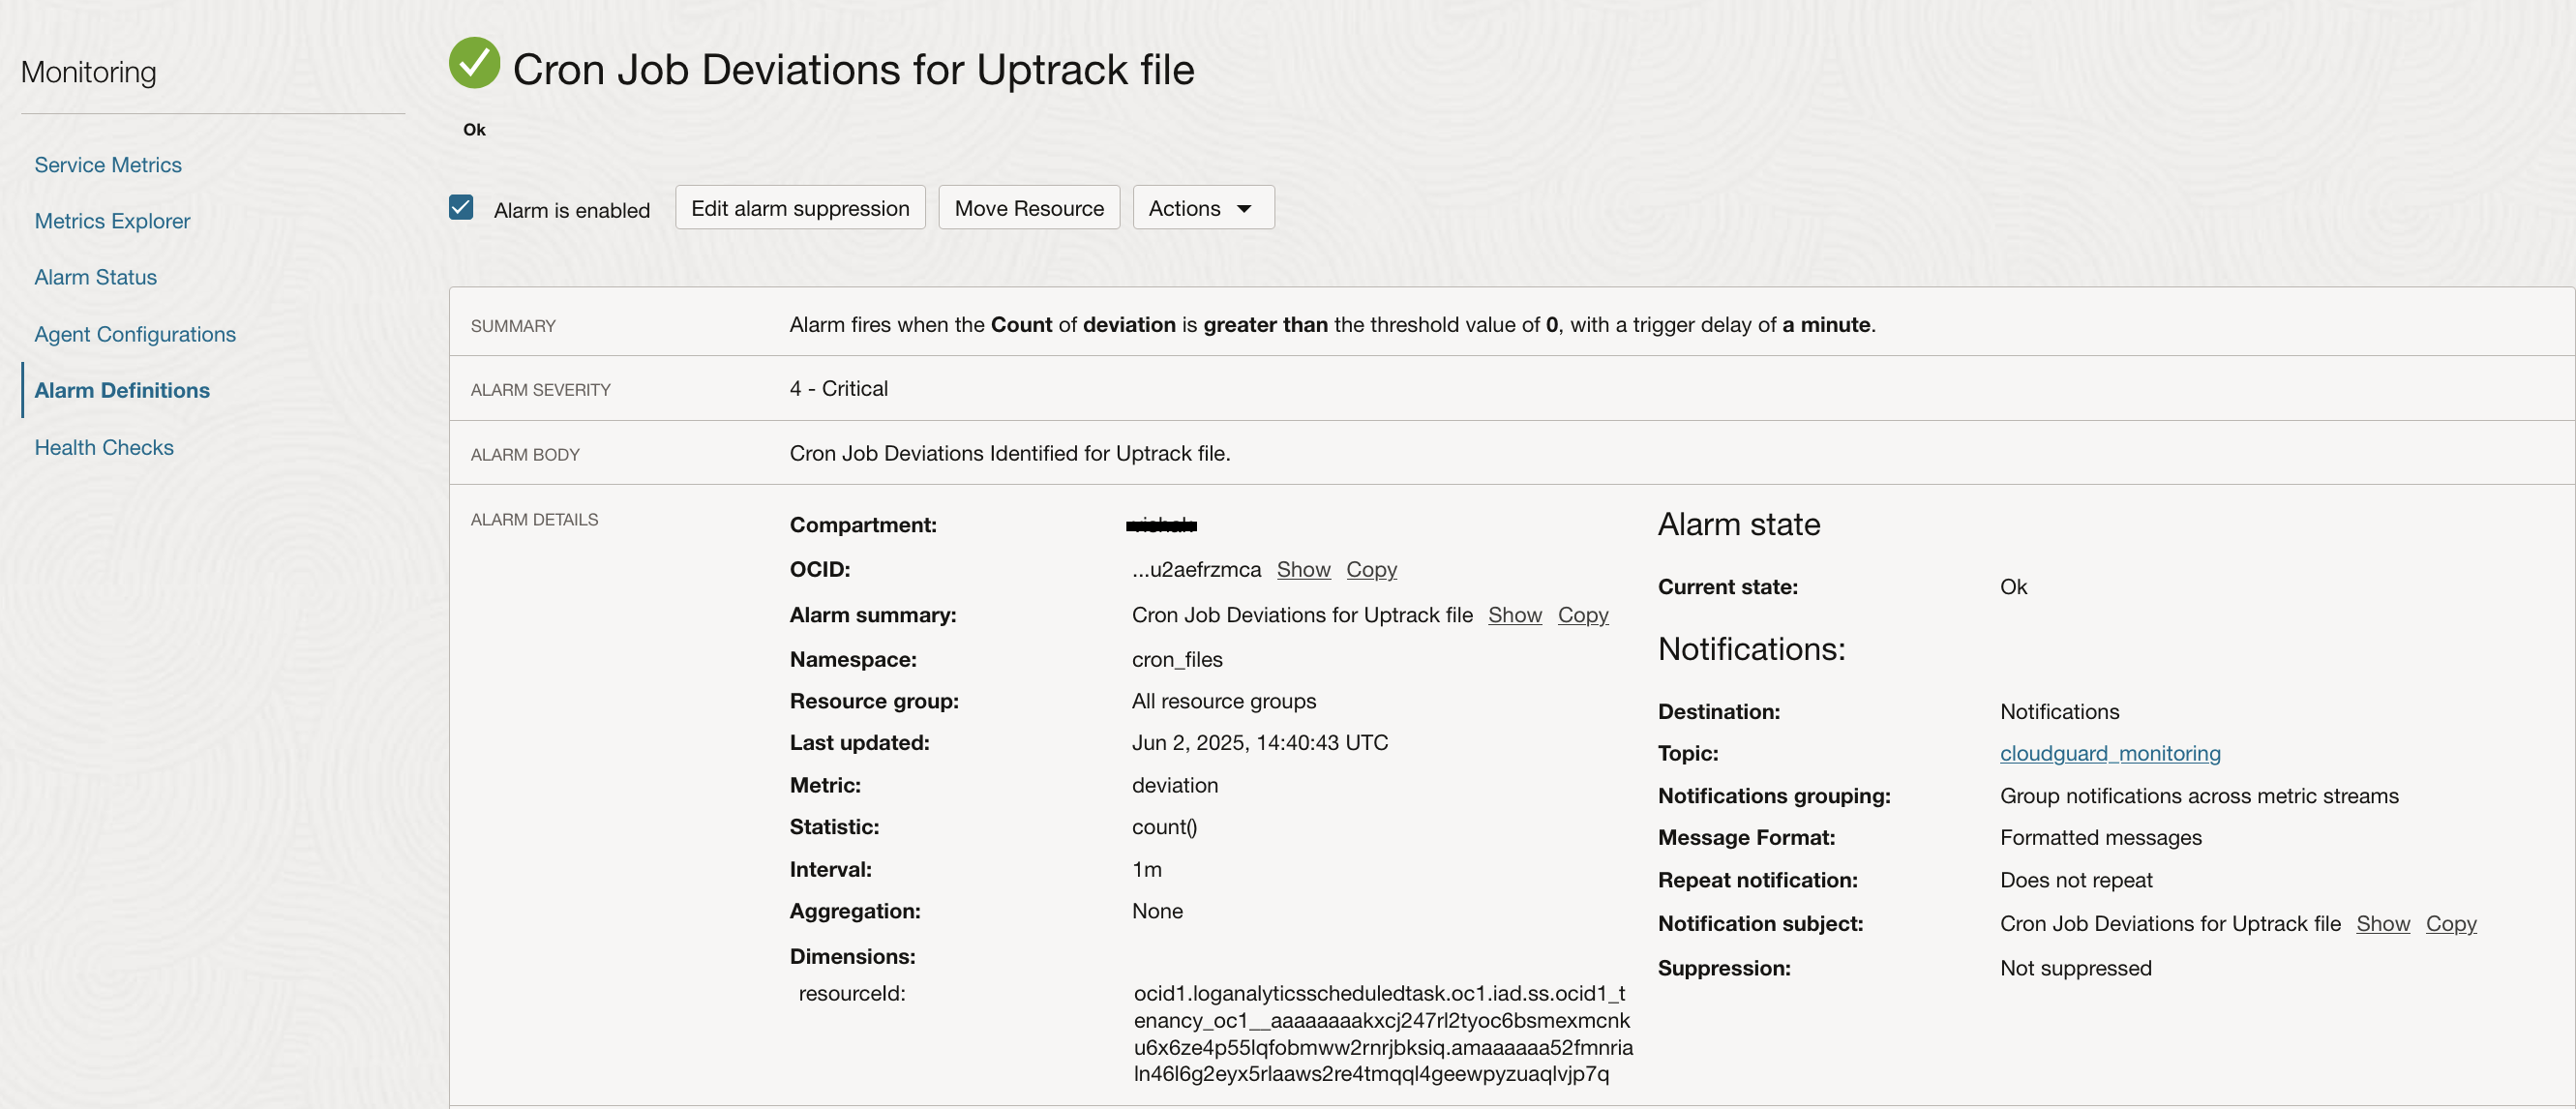
Once these metrics are available in the OCI Monitoring Service, an Alarm can be setup to receive alerts on your choice of subscription. Here is an example Alarm configuration and generated alert email for this scenario.
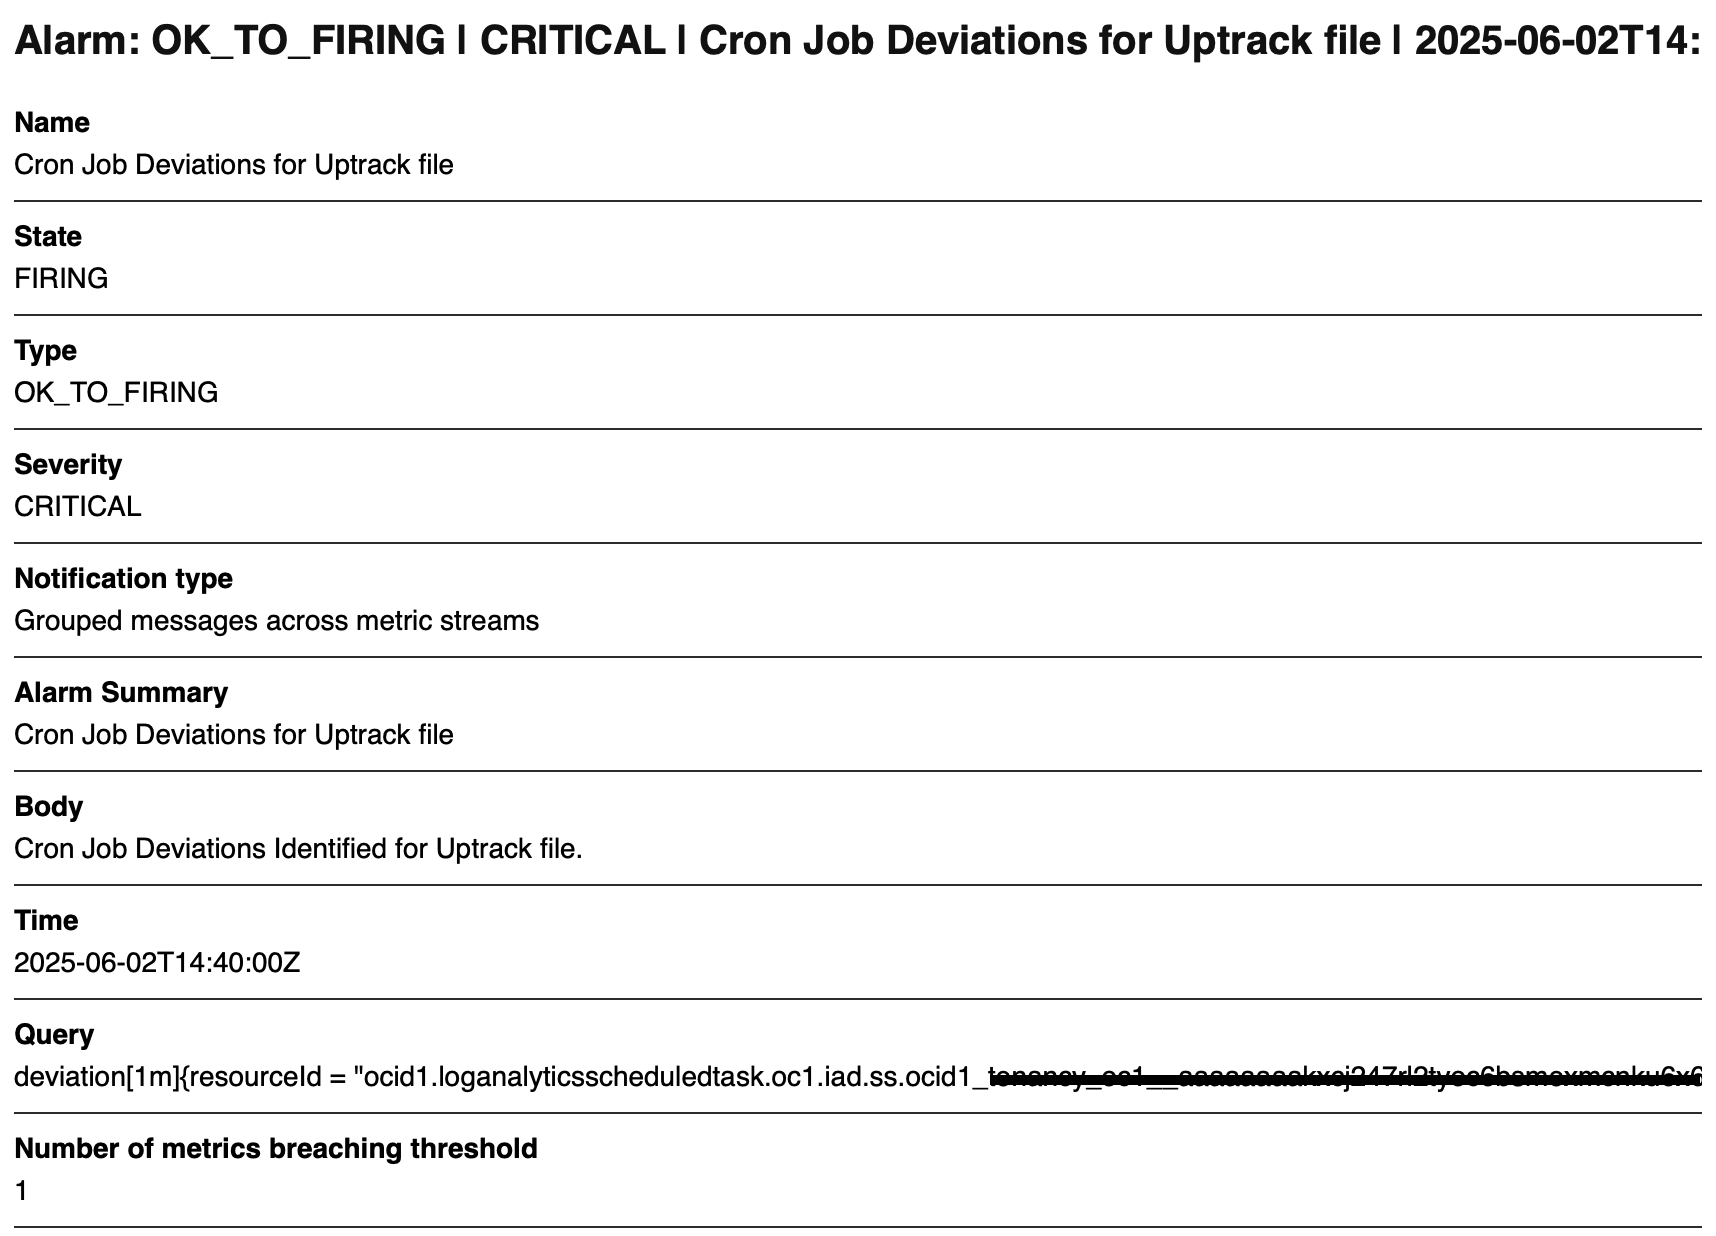
And here is a sample alert email that you would receive.
Conclusion
Cloud Guard Instance Security plays a crucial role in surfacing potential security issues through problem detections and OS query findings. Furthermore, the power of these insights is unlocked when the logs are seamlessly integrated with Logging Analytics. By centralizing and visualizing this data, you not only gain deeper context but also make it easier to monitor and respond to issues in real time.
Creating tailored dashboards allows teams to quickly identify patterns and prioritize actions, while Detection Rules add an extra layer of proactive defense by triggering alerts based on specific conditions. This combined approach enhances visibility, accelerates incident response, and ultimately strengthens your overall cloud security posture.