For a few months now, I have been looking at observability and the tools available to monitor metrics, logs and distributed tracing. One of these tools is Prometheus. In my next article I will recount my journey with Prometheus, but today I would like to take a different direction.
As some of you may not know, the original architects of Prometheus chose deliberately not to build a distributed data storage layer to the time series database. They wanted to keep it simple. It’s important to underscore that this was not a weakness of the design. But rather, it was a conscious decision. They wanted to focus on one thing and do it really well.
The problem…
Now, if we have a large number of environments to monitor with a requirement to keep the time series for a long time, to analyze trends, for example, Prometheus won’t scale.
Since version 2.0 released in 2017, a new “Remote Write” protocol was introduced which enables data in Prometheus to be exported to either a long-term/larger remote storage, solving the storage constraints and scaling difficulties. This blog was written to illustrate how one could configure an adapter to export data from Prometheus.
And the solution…
There are many options to integrate Prometheus with an external system. You can find a full list at https://prometheus.io/docs/instrumenting/exporters/. But I choose to use Kafka because it would allow a decoupled association between any number of clients who need to read or collect metrics data from Prometheus that would have been ingested in a topic in Kafka.
In this article, I list all the steps to:
install Prometheus,
install Kafka,
configure Prometheus to “remote write” to a Kafka topic,
and finally read the topic.
The creation of a consumer to read the time series from Kafka and import to your desired final system is left as a homework assignment.
So let’s get to it…
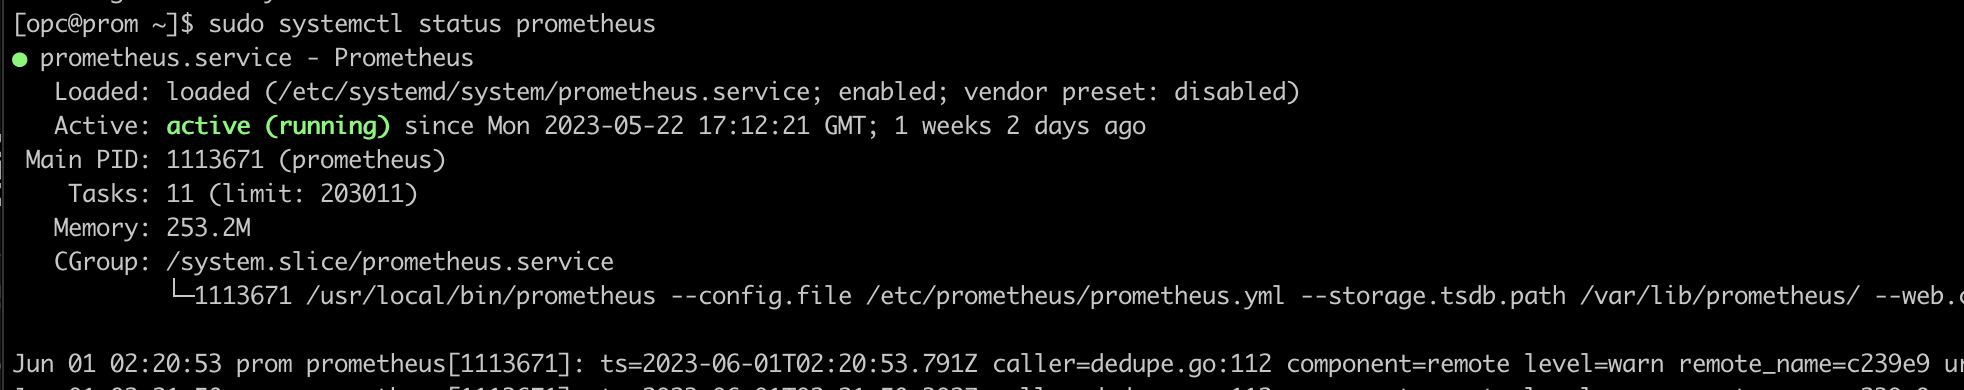
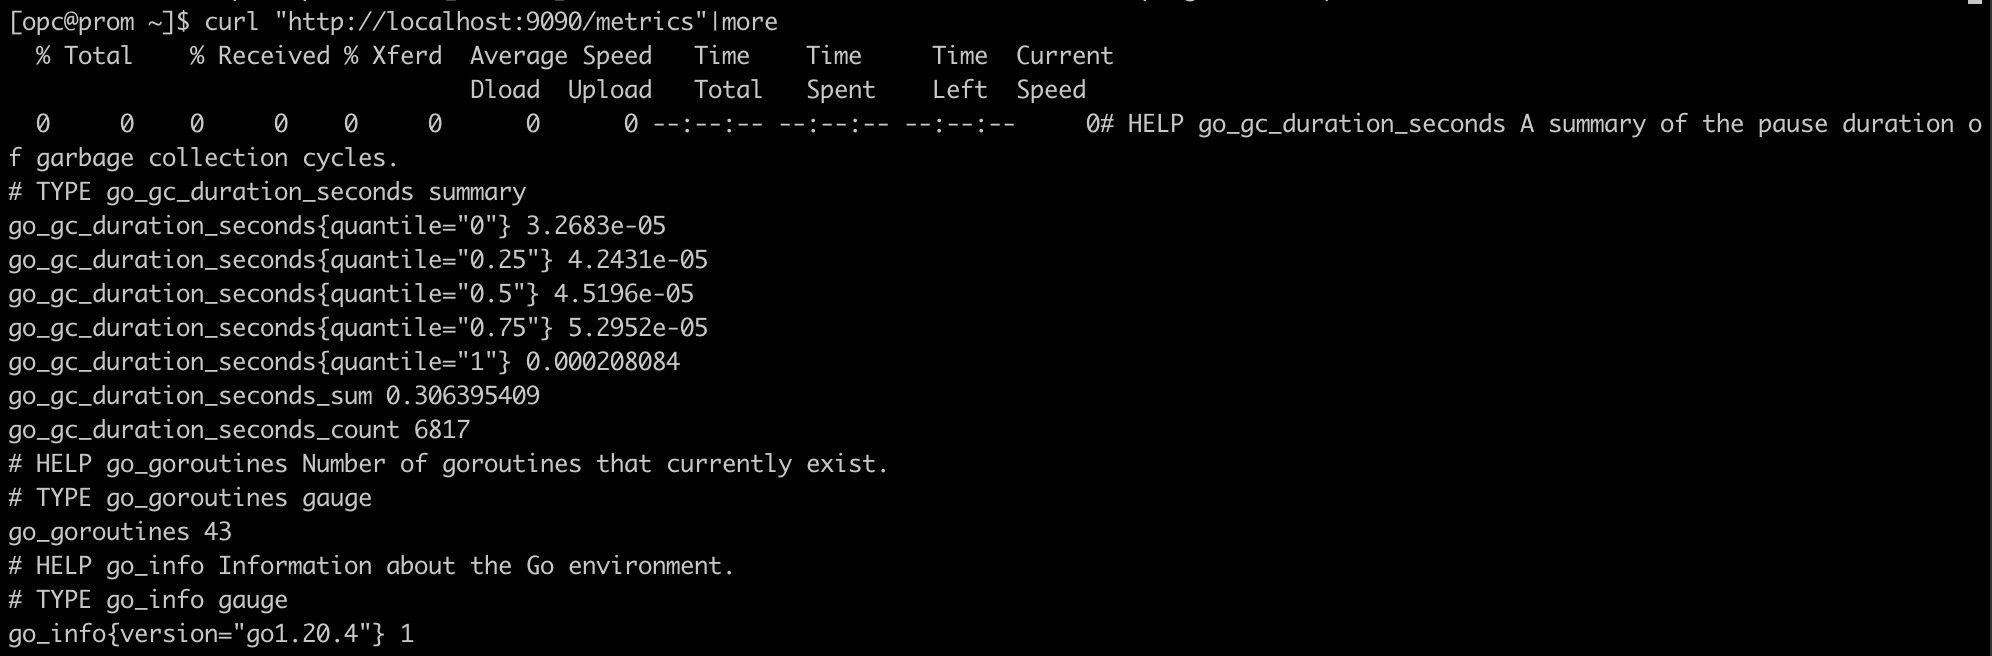
Prometheus Installation
I created an OCI compute instance which I installed Prometheus and Kafka.
There are other options to run Prometheus, for example as a docker container. But in this blog we will install it using curl, then extract the content of the tar file and cd into the extracted directory:
Since Kafka runs on JVMs, you need to install Java. I chose JDK 14.
$ yum list jdk* (to findout which version is available)
$ sudo yum install jdk-14.0.1.x86_64
Step 3: Start the Kafka environment.
The default advertised.listener (localhost) did not work for me. Since I am running on OCI compute instance with 10.20.0.39 internal IP, I used it to configure the listeners.
Edit config/kraft/server.properties, change “localhost” to internal ip “10.20.0.39”
Step 4: Create topic to store events and check it. Note: this is a topic used just for testing the producer and consumer in Kafka. Not the topic that will be used with Prometheus.
Open another terminal window and type the following to create a topic:
If everything is working, you should see on the screen messages from Prometheus, time series entries, that were ingested in the topic and were pulled out by the consumer above.
In summary…
We saw that Prometheus was not built with distributed data storage layer, but with the remote write protocol we can export time series data into a more long-term storage. We went through step by step instructions to install Prometheus, Kafka and configure both to talk to each other. I hope this has been useful.