Overview
The purpose of this document is to help with troubleshooting different network services running on top of OCI. We will start with a short introduction of the OSI Model that will help to understand the network architecture and at what layer an issue might occur. Next, we will cover basic tools that will help with the following:
- Discover host availability
- Discover packet loss
- Discover delay or latency
- Discover MTU size limitations
- Network path discovery
- Path MTU Discovery
- Traffic capture
- Traffic generators
- Data transfer utilities
This document is divided in 2 parts. Part 1 will cover the following:
- Introduction to the OSI model
- Introduction to ICMP
- Tools using ICMP
- Ping
- Traceroute
- PMTUD (Path MTU Discovery)
Part 2 will cover the following:
- Packet analysis
- Tcpdump and Wireshark
- Traffic generator and data transfers
- iPerf
- Rsync and SCP
It is recommended to have basic Networking skills.
Introduction to the OSI model
The Open Systems Interconnection (OSI) model is a conceptual model created by the International Organization for Standardization which enables diverse communication systems to communicate using standard protocols. In other words, the OSI model provides a standard for different computer systems to be able to communicate with each other.
The OSI model consists of 7 layers, each layer handling a specific job and can communicate with the layers above and below.
Also, the TCP/IP model further compresses the OCI model into a 4-layer model having Layer 1 through Layer 2 compressed into the Link layer and Layer 5 through Layer 7 into one Application layer. The OSI Network layer (Layer-3) becomes the Internet layer.
You might also have heard of derivates of the OSI model, like Five-Layer mode which compresses OSI model Layer 5 through Layer 7 into one Application layer resulting in only 5-layers.
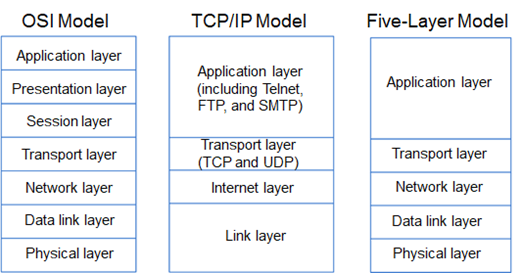
For this document, we will use the standard OSI model.
When troubleshooting networking issues, it is recommended to start with the more basic tools, like ping, traceroute, path MTU discovery, file transfers tests for bandwidth issues and go up to the more complex tools, where you need to do some packet capturing, adjust OS parameters for better performance, etc.. Tipically using basic troubleshooting tools you will be able to resolve most of the networking issues.
Introduction to ICMP
ICMP stands for Internet Control Message Protocol and is used by network devices to diagnose network communication issues. This protocol works at the Layer 3 or Network layer in the OSI model.
ICMP messages are typically used for diagnostic, control purposes or generated in response to errors in IP operations.
Example scenarios where ICMP packets can be used but not limited to:
- Network path discovery
- Discover MTU size limitations
- Path MTU Discovery
- Discover if a specific host is reachable (if Firewall permits)
All ICMP packets have an 8-byte header and a variable-sized data section. The first 4 bytes of the header have a fixed format, while the last 4 bytes depend on the type/code of that ICMP packet.
ICMP uses different types and codes for different purposes, also called Control Messages. For more technical details, follow Wikipedia or other technical websites.
Tools using ICMP
Ping
The most used tool is “ping”. This utility is installed by default on most operating systems, including Windows, Linux, and Unix. Ping uses type 0 (echo reply) and type 8 (echo request) as
control messages.
Ping is used for the following:
- Discover delay or latency with current / min / avg / max values
- Discover host availability, if the Firewall permits ICMP
- Discovers the maximal MTU size using “Don’t fragment” bit set
- Discovers packet loss by using different interval rates for sending ICMP
- Resolve hostnames or FQDNs to IP addresses
Linux / Unix / Windows commands example:
The easiest way to test network connectivity is to do a simple ping. Example:
Default ping with 56 bytes payload (+ 8 bytes ICMP header) and 1-second interval:
ineubaue-mac2:~ ineubaue$ ping cloud.oracle.com
PING e870.dscx.akamaiedge.net (2.20.111.205): 56 data bytes
64 bytes from 2.20.111.205: icmp_seq=0 ttl=60 time=24.499 ms
64 bytes from 2.20.111.205: icmp_seq=1 ttl=60 time=46.228 ms
64 bytes from 2.20.111.205: icmp_seq=2 ttl=60 time=25.491 ms
64 bytes from 2.20.111.205: icmp_seq=3 ttl=60 time=25.954 ms
64 bytes from 2.20.111.205: icmp_seq=4 ttl=60 time=25.215 ms
^C
— e870.dscx.akamaiedge.net ping statistics —
5 packets transmitted, 5 packets received, 0.0% packet loss
round-trip min/avg/max/stddev = 24.499/29.477/46.228/8.389 ms
ineubaue-mac2:~ ineubaue$
If there is a need to test packet loss, you can modify the wait interval. Default is 1 second between sending each packet. Example:
Ping with 56 bytes payload (+ 8 bytes ICMP header) and 100-millisecond interval:
On macOS the interval option is “-i”, on Linux “-i” and Windows doesn’t have this option.
ineubaue-mac2:~ ineubaue$ ping -i 0.1 cloud.oracle.com
PING e870.dscx.akamaiedge.net (2.20.111.205): 56 data bytes
64 bytes from 2.20.111.205: icmp_seq=0 ttl=60 time=24.156 ms
64 bytes from 2.20.111.205: icmp_seq=1 ttl=60 time=24.506 ms
64 bytes from 2.20.111.205: icmp_seq=2 ttl=60 time=24.568 ms
64 bytes from 2.20.111.205: icmp_seq=3 ttl=60 time=24.011 ms
64 bytes from 2.20.111.205: icmp_seq=4 ttl=60 time=26.830 ms
64 bytes from 2.20.111.205: icmp_seq=5 ttl=60 time=24.239 ms
64 bytes from 2.20.111.205: icmp_seq=6 ttl=60 time=24.876 ms
64 bytes from 2.20.111.205: icmp_seq=7 ttl=60 time=24.451 ms
64 bytes from 2.20.111.205: icmp_seq=8 ttl=60 time=25.483 ms
64 bytes from 2.20.111.205: icmp_seq=9 ttl=60 time=25.630 ms
^C
— e870.dscx.akamaiedge.net ping statistics —
10 packets transmitted, 10 packets received, 0.0% packet loss
round-trip min/avg/max/stddev = 24.011/24.875/26.830/0.827 ms
ineubaue-mac2:~ ineubaue$
If there is a need to send bigger packets, the size can be modified. Keep in mind that by default, if the packet is bigger than the MTU, fragmentation occurs. To send packets without fragmentation, check the below example using the “Don’t Fragment” bit. Example:
Ping with 1600 bytes payload (+ 8 bytes ICMP header) and 1 second interval:
On macOS, the size option is “-l”, on Linux “-l” and on Windows “/l”. The ICMP packet is send using 1600 bytes payload and fragmentation occurs (I have a default MTU of 1492). The easiest way to see fragmentation is by doing a packet capture. Packet capture is covered in Part 2 of this document.
ineubaue-mac2:~ ineubaue$ ping -s 1600 cloud.oracle.com
PING e870.dscx.akamaiedge.net (2.20.111.205): 1600 data bytes
1608 bytes from 2.20.111.205: icmp_seq=0 ttl=60 time=26.659 ms
1608 bytes from 2.20.111.205: icmp_seq=1 ttl=60 time=47.081 ms
1608 bytes from 2.20.111.205: icmp_seq=2 ttl=60 time=26.141 ms
1608 bytes from 2.20.111.205: icmp_seq=3 ttl=60 time=26.675 ms
1608 bytes from 2.20.111.205: icmp_seq=4 ttl=60 time=40.685 ms
^C
— e870.dscx.akamaiedge.net ping statistics —
5 packets transmitted, 5 packets received, 0.0% packet loss
round-trip min/avg/max/stddev = 26.141/33.448/47.081/8.759 ms
ineubaue-mac2:~ ineubaue$
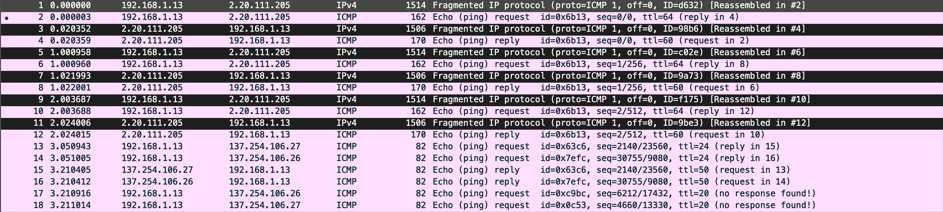
Diagram 1. Packet capture showing packet fragmentation.
Ping with 1600 bytes payload (+ 8 bytes ICMP header), 1-second interval and “Don’t Fragment” bit set:
On macOS the DF bit option is “-D”, on Linux “-M do” and on Windows “/f”.In this example, the packet is too large and an error message is displayed. This means that the packet was not sent and that is being dropped.
ineubaue-mac2:~ ineubaue$ ping -D -s 1600 cloud.oracle.com
PING e870.dscx.akamaiedge.net (2.20.111.205): 1600 data bytes
ping: sendto: Message too long
Request timeout for icmp_seq 0
ping: sendto: Message too long
Request timeout for icmp_seq 1
^C
— e870.dscx.akamaiedge.net ping statistics —
3 packets transmitted, 0 packets received, 100.0% packet loss
ineubaue-mac2:~ ineubaue$
Traceroute
Traceroute (Linux) or tracert (Windows) is a network diagnostic command for displaying the route (path) and measuring transit delays of packets across an Internet Protocol (IP) network.
Traceroute records the RTT (round-trip time) of each next-hop along the path. Ping, on the other hand, only computes the final RTT from the destination point.
On Unix-like operating systems, traceroute sends, by default, UDP packets. The implementations of traceroute shipped with Linux, FreeBSD, NetBSD, OpenBSD, DragonFly BSD, and macOS include an option to use ICMP Echo Request packets (-I), or any arbitrary protocol (-P) such as UDP, TCP using TCP SYN packets, or ICMP. Windows, by default, uses ICMP packets.
For the ICMP protocol option, traceroute uses ICMP type 11 (Time Exceeded). ICMP type 0 (echo response) may come back as the very last packet when the TTL exactly equals the number of hops.
It is also possible to get ICMP type 3 code 4 responses back instead of ICMP type 11 responses if you send a large packet with the “Do not fragment” bit set. More will be discussed in the PMTUD (Path MTU Discovery) section below.
For more details about traceroute check the Wikipedia website or other technical websites.
Linux / Unix / Windows commands example:
To be able to see the entire network path from source to destination, you can use traceroute or tracert. Example:
Default traceroute using UDP on macOS and Linux.
ineubaue-mac2:~ ineubaue$ traceroute 8.8.8.8
traceroute to 8.8.8.8 (8.8.8.8), 64 hops max, 52 byte packets
1 * * *
2 10.0.0.1 (10.0.0.1) 4.234 ms 2.900 ms 1.910 ms
3 10.162.1.49 (10.162.1.49) 2.551 ms 3.124 ms 3.067 ms
4 static-10-220-133-34.rdsnet.ro (10.220.133.34) 9.475 ms 8.967 ms 9.061 ms
5 10.220.153.20 (10.220.153.20) 14.852 ms
10.220.156.5 (10.220.156.5) 17.504 ms
10.220.153.20 (10.220.153.20) 34.817 ms
6 72.14.216.212 (72.14.216.212) 17.164 ms 16.309 ms
213-154-130-234.rdsnet.ro (213.154.130.234) 12.671 ms
7 * 74.125.242.225 (74.125.242.225) 18.064 ms *
8 dns.google (8.8.8.8) 15.017 ms
64.233.175.119 (64.233.175.119) 15.388 ms
dns.google (8.8.8.8) 12.271 ms
ineubaue-mac2:~ ineubaue$
Traceroute using ICMP. Depending on what firewalls (if any) are filtering along the path, it is recommended to try and use UDP, TCP SYN or ICMP.
On macOS and Linux, the default option is to use UDP and can be changed. On Windows, the default option is to use ICMP and cannot be changed.
For ICMP on macOS you can use “-P ICMP or -I” option, on Linux you can use “-I” option.
ineubaue-mac2:~ ineubaue$ traceroute -P ICMP 8.8.8.8
traceroute to 8.8.8.8 (8.8.8.8), 64 hops max, 72 byte packets
1 * * *
2 10.0.0.1 (10.0.0.1) 3.749 ms 2.899 ms 1.924 ms
3 10.162.1.49 (10.162.1.49) 2.919 ms 2.882 ms 2.861 ms
4 static-10-220-133-34.rdsnet.ro (10.220.133.34) 9.507 ms 9.039 ms 9.630 ms
5 10.220.153.18 (10.220.153.18) 14.608 ms 60.942 ms 25.629 ms
6 213-154-130-234.rdsnet.ro (213.154.130.234) 20.508 ms 22.111 ms 13.518 ms
7 74.125.242.241 (74.125.242.241) 12.794 ms 12.132 ms 12.733 ms
8 216.239.35.183 (216.239.35.183) 12.858 ms 13.012 ms 12.990 ms
9 dns.google (8.8.8.8) 12.798 ms 14.232 ms 12.046 ms
ineubaue-mac2:~ ineubaue$
It is worth mentioning that sometimes when you run the same traceroute command multiple times, you will see different paths. This means traffic is load-balanced across multiple links or paths.
Traceroute sends packets to the destination with the field “time to live” (TTL) equal to the number of hops. If a router does not respond within the timeout timer then traceroute prints an asterisk (*). This can have multiple retries.
Sometimes, you want to quickly display the network path by not waiting to resolve hostnames. To do this. Example:
Traceroute using ICMP without resolving hostnames or FQDNs.
For macOS and Linux use the “-n” option. For Windows use the “-d” option.
ineubaue-mac2:~ ineubaue$ traceroute -n -P ICMP 8.8.8.8
traceroute to 8.8.8.8 (8.8.8.8), 64 hops max, 72 byte packets
1 * * *
2 10.0.0.1 3.855 ms 1.735 ms 1.972 ms
3 10.162.1.49 2.453 ms 3.115 ms 3.148 ms
4 10.220.133.34 9.729 ms 12.146 ms 9.391 ms
5 10.220.153.18 12.270 ms 14.445 ms 12.323 ms
6 213.154.130.234 12.081 ms 13.287 ms 12.514 ms
7 74.125.242.241 12.135 ms 12.974 ms 12.922 ms
8 216.239.35.183 14.129 ms 13.589 ms 12.509 ms
9 8.8.8.8 12.651 ms 13.075 ms 12.487 ms
ineubaue-mac2:~ ineubaue$
PMTUD (Path MTU Discovery)
The Maximum Transmission Unit (MTU) is the size of the largest protocol data unit (PDU) that can be communicated in a single network layer transaction. The MTU relates to, but is not identical to the maximum frame size that can be transported on the data link layer, e.g. Ethernet frame.
Larger MTU packets can reduces overhead while smaller MTU packets can reduce network delay. In many cases, MTU is dependent on the underlying network capabilities and must be adjusted manually or automatically to not exceed these capabilities. MTU parameters may appear in association with a communications interface or standard. Some systems may decide MTU size during the connect time.
For more details about MTU check the Wikipedia website or other technical websites.
Path MTU Discovery (PMTUD) is a standardized technique for determining the maximum transmission unit (MTU) size on the network path between two Internet Protocol (IP) hosts, usually intending to avoid IP fragmentation. PMTUD was originally intended for routers in Internet Protocol Version 4 (IPv4). However, all modern operating systems use it on endpoints. In IPv6, this function has been explicitly delegated to the endpoints of a communications session.
PMTUD is standardized for IPv4 in RFC 1191 and for IPv6 in RFC 8201 (which obsoleted RFC 1981, the previous IPv6 PMTUD standard). RFC 4821 describes an extension to the techniques that work without support from the Internet Control Message Protocol.
For IPv4 packets, Path MTU Discovery works by setting the Don’t Fragment (DF) flag bit in the IP headers of outgoing packets. Then, any device along the path whose MTU is smaller than the packet will drop it, and send back an Internet Control Message Protocol (ICMP) Fragmentation Needed (Type 3, Code 4) message containing its MTU, allowing the source host to reduce its Path MTU accordingly. The process is repeated until the MTU is small enough to traverse the entire path without fragmentation.
IPv6 routers do not support fragmentation and consequently don’t support the Don’t Fragment option. For IPv6, Path MTU Discovery works by initially assuming the path MTU is the same as the MTU on the link layer interface where the traffic originates. Then, similar to IPv4, any device along the path whose MTU is smaller than the packet will drop the packet and send back an ICMPv6 Packet Too Big (Type 2) message containing its MTU, allowing the source host to reduce its Path MTU accordingly. The process is repeated until the MTU is small enough to traverse the entire path without fragmentation.
If the Path MTU changes after the connection is established and it is lower than the previously determined Path MTU, the first large packet will cause an ICMP error and the new, lower Path MTU will be found.
For more details about PMTUD check the Wikipedia website or other technical websites.
The best tools for PMTUD are tracepath and traceroute on Linux. macOS doesn’t have native support for PMTUD in traceroute. Tracepath is not available on macOS.
For Windows, you can use “mturoute.exe”. This tool needs to be installed separately.
Linux / Unix / Windows commands example:
Example of how to verify the MTU over the entire network path:
[13:16:42 root@centos7:/home/vagrant] # tracepath -n k.ro
1: 192.168.1.14 0.043ms pmtu 1500
1: no reply
2: 192.168.1.1 4.657ms pmtu 1492
2: 10.0.0.1 3.445ms
3: 10.162.1.49 4.732ms
4: 10.220.133.34 11.009ms
5: 10.220.156.5 17.230ms asymm 6
6: 87.119.98.157 45.447ms asymm 12
7: 89.149.136.117 40.177ms asymm 12
8: 77.67.83.78 41.344ms asymm 12
9: 62.115.118.49 31.544ms asymm 6
10: 84.116.131.54 45.075ms asymm 17
11: 84.116.187.78 55.789ms asymm 16
12: 84.116.224.70 42.557ms asymm 10
13: 84.116.187.74 40.996ms
14: 194.102.255.23 28.367ms reached
Resume: pmtu 1492 hops 14 back 12
[13:16:50 root@centos7:/home/vagrant] #
Here we can see that 192.168.1.14 (my laptop) has an MTU of 1500 and that 192.168.1.1 (Gateway) has an MTU of 1492. The MTU decreased to 1492 because I use a PPPoE connection, and by default it adds an 8-byte PPP overlay.
[13:16:53 root@centos7:/home/vagrant] # traceroute -n -I –mtu k.ro
traceroute to k.ro (194.102.255.23), 30 hops max, 65000 byte packets
1 * F=1500 * *
2 10.0.0.1 3.138 ms F=1492 2.158 ms 2.459 ms
3 10.162.1.49 4.362 ms 3.487 ms 7.972 ms
4 10.220.133.34 8.881 ms 9.489 ms 9.359 ms
5 10.220.156.5 17.261 ms 15.321 ms 15.089 ms
6 62.115.165.186 28.860 ms 27.487 ms 28.031 ms
7 62.115.118.206 29.542 ms 44.839 ms 30.487 ms
8 62.115.136.125 30.421 ms 30.504 ms 30.851 ms
9 62.115.118.49 30.775 ms 29.677 ms 29.936 ms
10 62.115.168.9 33.789 ms 49.693 ms 34.382 ms
11 84.116.186.185 29.228 ms 29.374 ms 29.686 ms
12 84.116.224.78 32.189 ms 30.081 ms 31.765 ms
13 84.116.224.10 31.382 ms 33.757 ms 30.145 ms
14 194.102.255.23 29.114 ms 28.614 ms 28.575 ms
[13:17:12 root@centos7:/home/vagrant] #
Traceroute works in a similar way as tracepath. MTU is shown in “F=”.
In the above example, we saw a decreased in MTU from 1500 to 1492 (PPPoE connection adds an PPP overlay of 8-bytes).
Keep in mind that the Ethernet frame is excluded (MAC 14 bytes + FCS 4 bytes) when discussing about MTU.
Until now, we discussed about packets and the headers overlay. But what about the data in the packet? The data is represented by MSS (Maximum Segment Size). This parameter is an options field of the TCP header that specifies the largest amount of data, specified in bytes, that a computer or communications device can receive in a single TCP segment.
To calculate the MSS, we need to take the MTU and extract all Network Layers (Layer-3 headers).
Example:
1492 MTU – 20 bytes IP header – 8 bytes ICMP header = 1464 bytes MSS.
For more details about MSS check the Wikipedia website or other technical websites.
To test if the above formula is true, we can do a ping with the “Don’t Fragment” bit set.
Example:
[13:50:53 root@centos7:/home/vagrant] # ping -M do -s 1464 k.ro
PING k.ro (194.102.255.23) 1464(1492) bytes of data.
1472 bytes from www.k.ro (194.102.255.23): icmp_seq=1 ttl=53 time=29.9 ms
1472 bytes from www.k.ro (194.102.255.23): icmp_seq=2 ttl=53 time=29.3 ms
^C
— k.ro ping statistics —
2 packets transmitted, 2 received, 0% packet loss, time 1003ms
rtt min/avg/max/mdev = 29.377/29.659/29.941/0.282 ms
[13:50:56 root@centos7:/home/vagrant] #
We can see that we are able to send 1464 bytes of data without fragmentation.
[13:50:58 root@centos7:/home/vagrant] # ping -M do -s 1465 k.ro
PING k.ro (194.102.255.23) 1465(1493) bytes of data.
From centos7 (192.168.1.14) icmp_seq=1 Frag needed and DF set (mtu = 1492)
ping: sendmsg: Message too long
From centos7 (192.168.1.14) icmp_seq=2 Frag needed and DF set (mtu = 1492)
ping: sendmsg: Message too long
^C
— k.ro ping statistics —
2 packets transmitted, 0 received, +2 errors, 100% packet loss, time 1003ms
[13:51:01 root@centos7:/home/vagrant] #
In this example, everything above 1464 will fail with an error message. This means that the packet was not sent and that is being dropped.
PMTUD is important because some applications use the “Don’t Fragment” bit set and there is a chance that the source and destination hosts use different MTU values. Because of this, data transfers can hang without any good reason. To overcome this, ICMP Type 3, Code 4 needs to be permitted on all Firewalls for the hosts to use PMTUD.
It’s also worth mentioning data transfers over IPSec VPN have a smaller MTU because based on the encryption and hashing algorithm + Tunnel or Transport mode used, the MSS can vary. IPSec is a Layer 3 or Network layer protocol and the header size needs to be reduced from the total MTU size to get the MSS.
MTU and MSS are also important when transferring large amounts of data. Fewer fragmentations and Jumbo Frame support will increase performance.
A more detailed explanation regarding PMTUD on OCI can be found on this A-Team Blog.
This is the end of Part 1. We will cover more advanced tools in Part 2.
Part 2 will cover the following:
- Packet analysis
- Tcpdump and Wireshark
- Traffic generator and data transfers
- iPerf
- Rsync and SCP