OCI Load Balancers provides the ability to improve web performance even further with the introduction of Web Application Acceleration. This feature decreases latency between the client and the web server by using two functions on the load balancer, caching and compression.
Caching will store content retrieved from the back web server on the load balancer. Reducing the need for the client to retrieve this data from the backend web server and relieving system load on the server. Compression improves performance even further by reducing the size of web content that is delievered to the client over the network. This compressed content is delivered in gzip format.
Walkthrough
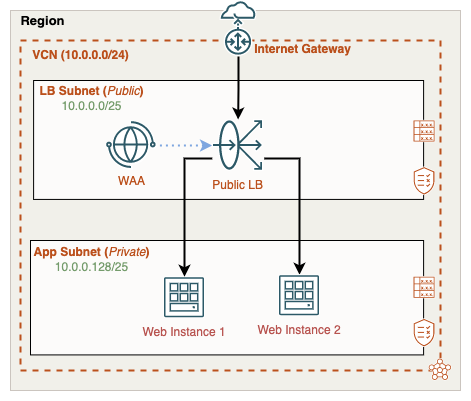
This blog will guide you through the process of enabling Web Application Acceleration, applying it to the load balancer, and verifying that the feature is working. We will use a simple two-tier architecture with a public-facing load balancer and two backend web servers:
Be sure to view the companion video below, here I cover the entire process from start to end:
Before we can take advantage of web acceleration we’ll need two things, a WAA policy and within the policy an acceleration. The acceleration gets attached to the load balancer. A WAA policy can host many accelerations but an acceleration can only be attached to one load balancer instance.
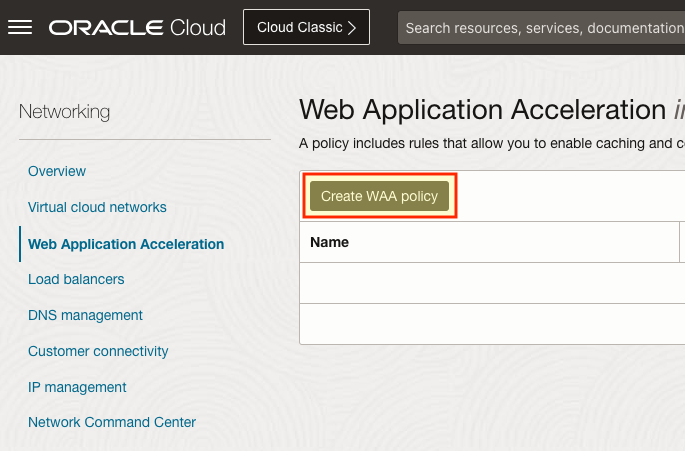
In the OCI Console, we’ll begin in the Networking menu, here you’ll see the Web Application Acceleration menu link on the left. Once selected, click Create WAA policy:
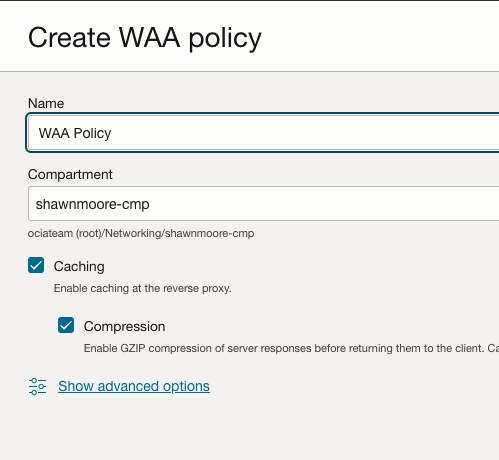
Give the WAA policy a name and select the appropriate compartment for the policy. Note that you can enable or disable the caching or compression capabilities available in the policy.
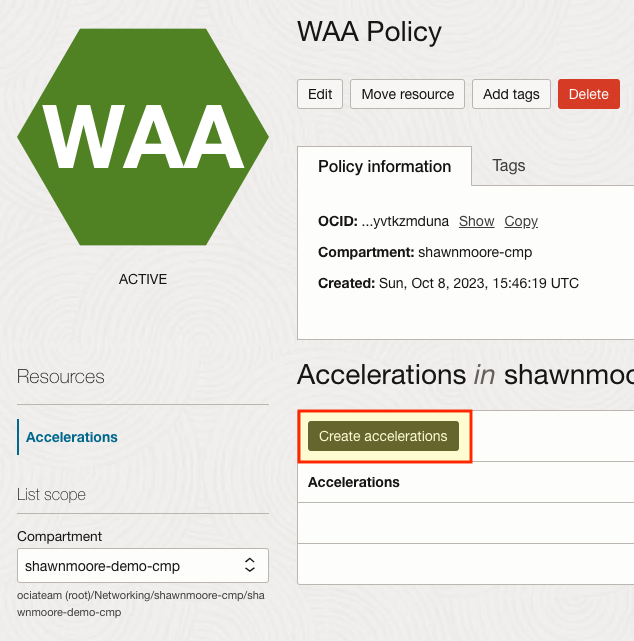
Once the policy is created we can now create the actual acceleration. Select Create accelerations Remember that each acceleration will be assigned to a specific load balancer.
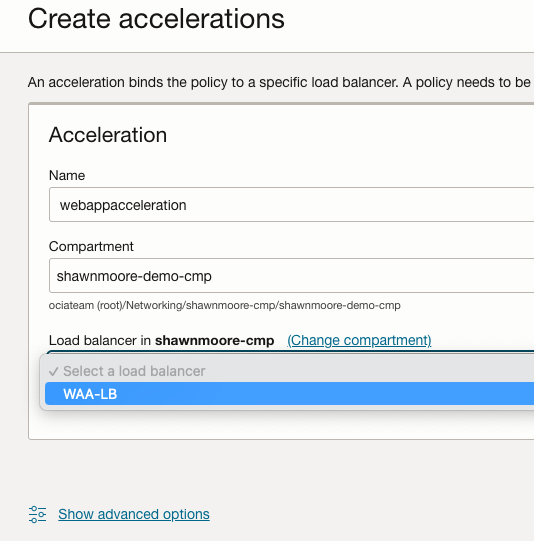
In the accelerations configuration page, provide a name and then select the appropriate load balancer that will use the acceleration. Once the load balancer is selected, click Create acceleration:
After a few moments, the acceleration will begin performing caching or compression operations on the incoming web traffic. We can confirm that this is working by viewing the metrics and logs associated with the acceleration.
Metrics provides many different stats such as the amount of HTTP requests received, Response size in bytes, and compression metrics.

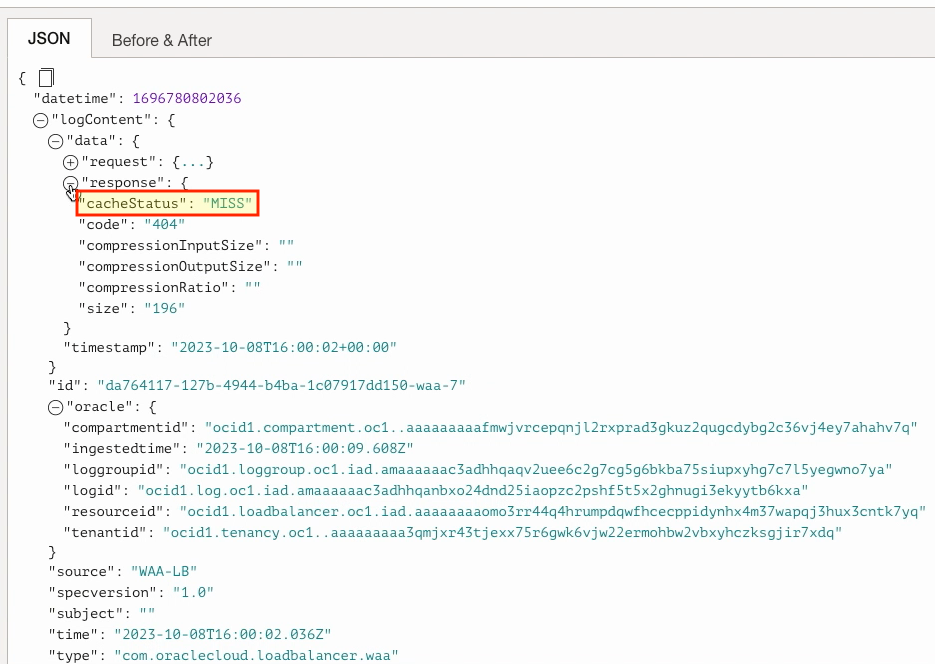
Digging further into the acceleration logs, we can find extra information such as hits or misses from the load balancer cache. Both of these results can be found by expanding the JSON log file and clicking the “response” section of the file. The “cacheStatus” shows if the particular piece of data requested was delivered from the load balancer cache (“HIT“) or the backend server (“MISS“).

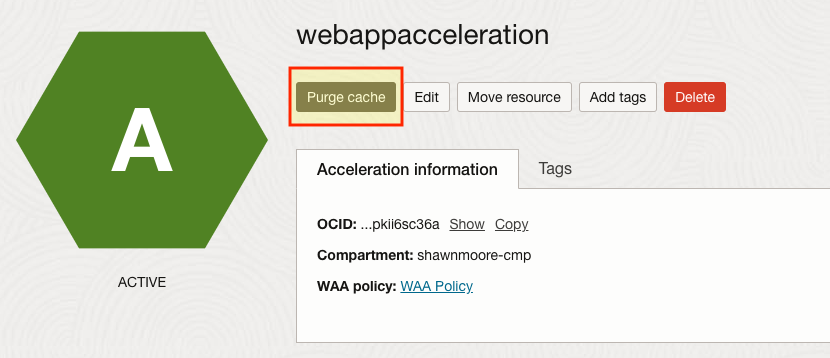
If for whatever reason cached content on the load balancer needs to be removed you can also purge the current cache. This is an irreversible action once performed. Also, note that the load balancer only holds 100MB worth of data before it begins clearing out unused cache files. Where it will remove resources that have been accessed the fewest times.
This concludes the guide on how to enable acceleration on your load balancer. To learn about Web Application Acceleration, be sure to review the reference links below.
References