Exciting news! Building on the momentum and success of our Security Fundamentals Dashboards (SFD), SFD is taking security to the next level. Thanks to the invaluable feedback from our customers, who have experienced the significant impact of SFD in strengthening their cloud environments, we are expanding our efforts to provide even more robust security solutions. Network Security Dashboard is designed to elevate network visibility, providing a comprehensive view of key security components, including Network Firewalls, Web Application Firewalls (WAF), Load Balancers, Virtual Cloud Networks (VCN). By integrating these elements into a single, user-friendly interface, the Network Security Dashboard enables organizations to streamline monitoring, detect vulnerabilities, and reinforce their network defenses from end to end.
This blog delves into how the Network Security Dashboard empowers teams to take a proactive approach to network threat management, fortify network resilience, and drive security excellence across their cloud environment.
New Network Security Dashboard Scopes
The Network Security Dashboard provides targeted visibility across critical areas of network infrastructure, offering a structured approach to monitor, assess, and secure the entire network environment. Network Security Dashboard allows security teams to focus on specific components within the Virtual Cloud Network (VCN), Load Balancers, Web Application Firewalls (WAF), and Network Firewalls, delivering insights tailored to each aspect’s unique security requirements. This structured approach ensures a comprehensive understanding of network security health, fostering an environment of continuous improvement and enhanced resilience.
Defined scopes in the Network Security Dashboard
- VCN Network Flow Logs Analysis
- Load Balancer Monitoring & Analysis
- Web Application Firewall Monitoring
- Network Firewall Monitoring
- VCN Network Changes Monitoring
Log Sources used in Network Security Dashboard
- OCI VCN Flow Unified Schema Logs
- OCI Network Firewall Traffic Logs
- OCI Network Firewall Threat Logs
- OCI Load Balancer Access Logs
- OCI Load Balancer Error Logs
- OCI WAF Logs
- OCI Audit Logs
Dashboards Screenshots
The Network Security Dashboard is split into four sections, each section covering a specific service and only the logs of that service.
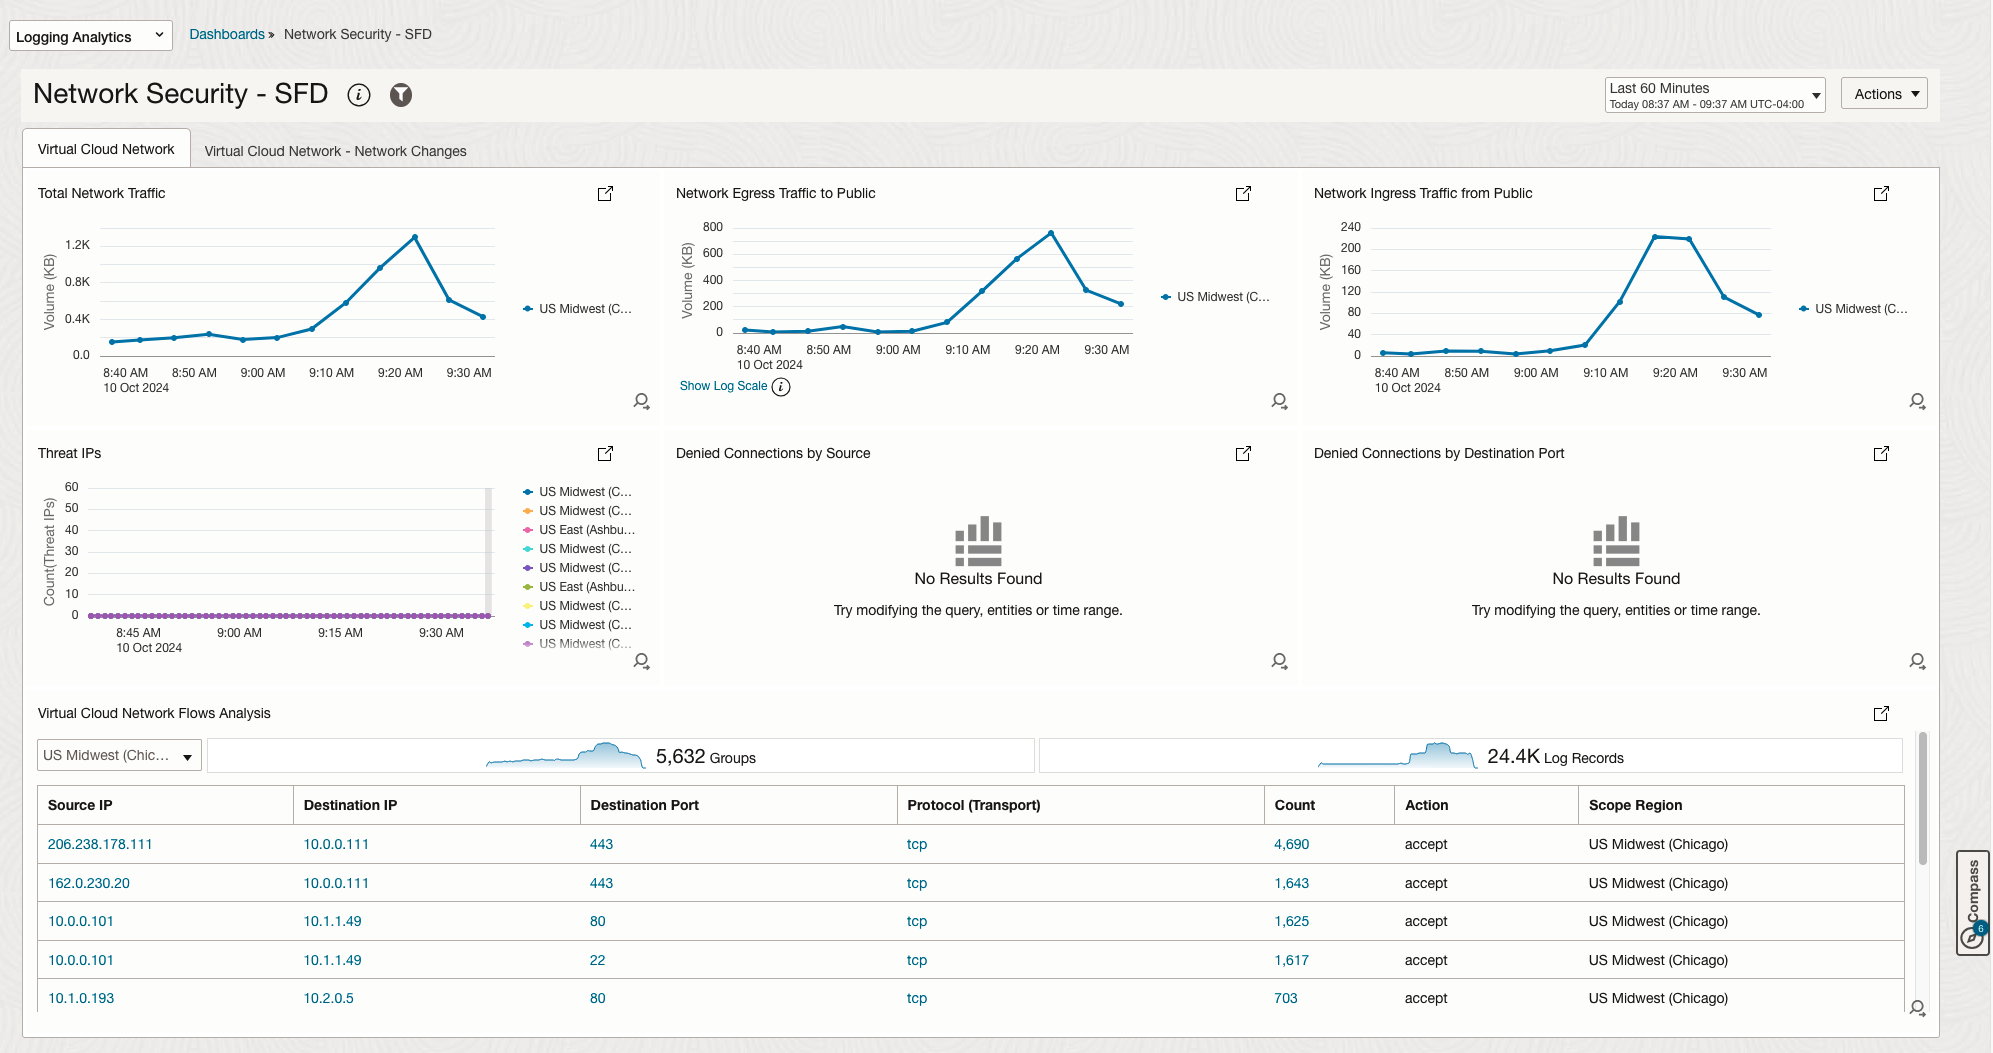
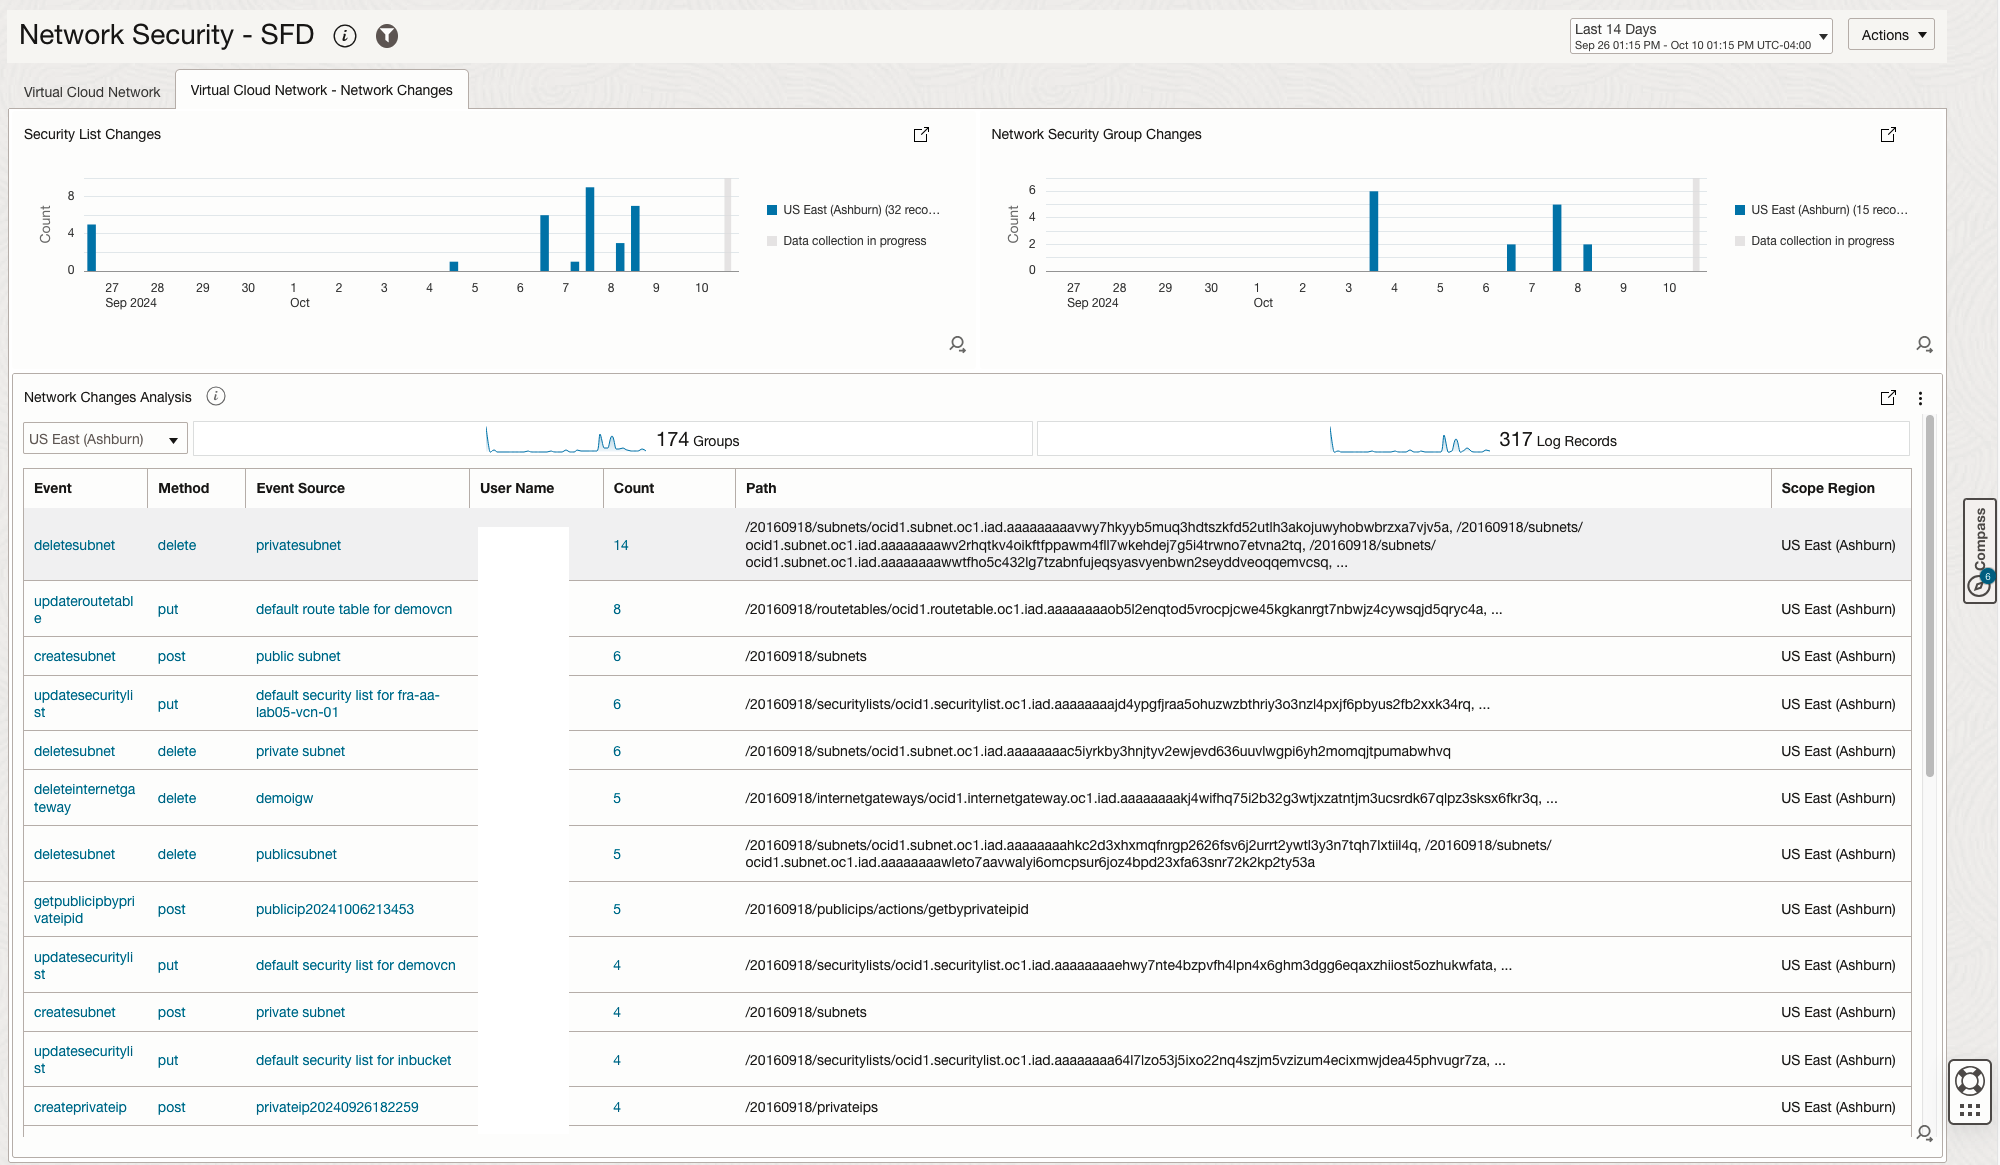
The Virtual Cloud Network section
The Virtual Cloud Network section has two tabs:
- tab 1 is based on the VCN Flow Logs and focuses on statistical data built around network flows.
- tab 2 is based on the Tenancy’s Audit Log and will show network changes made to the environment.
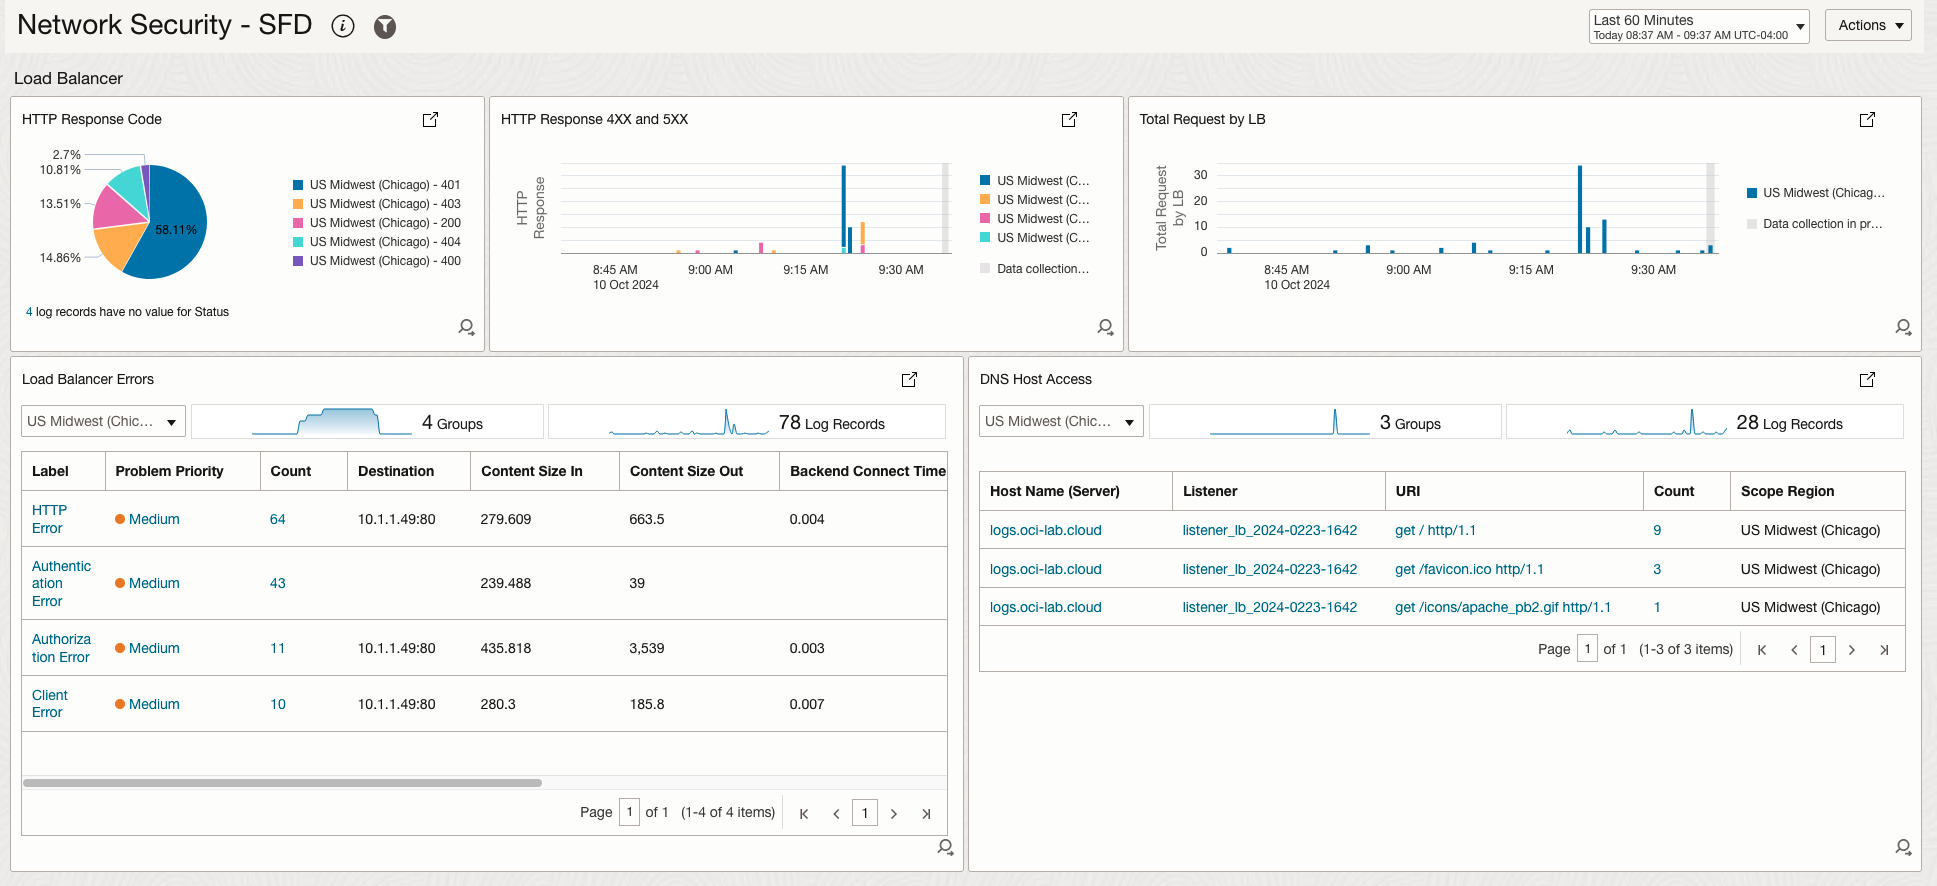
The Load Balancer Section
The second section is built around the Load Balancer logs (access and error). While the section’s focus is around HTTP errors and HTTP error codes, there are two widgets showing interesting statistical data: the number of requests for each Load Balancer and the most requested Hostnames.
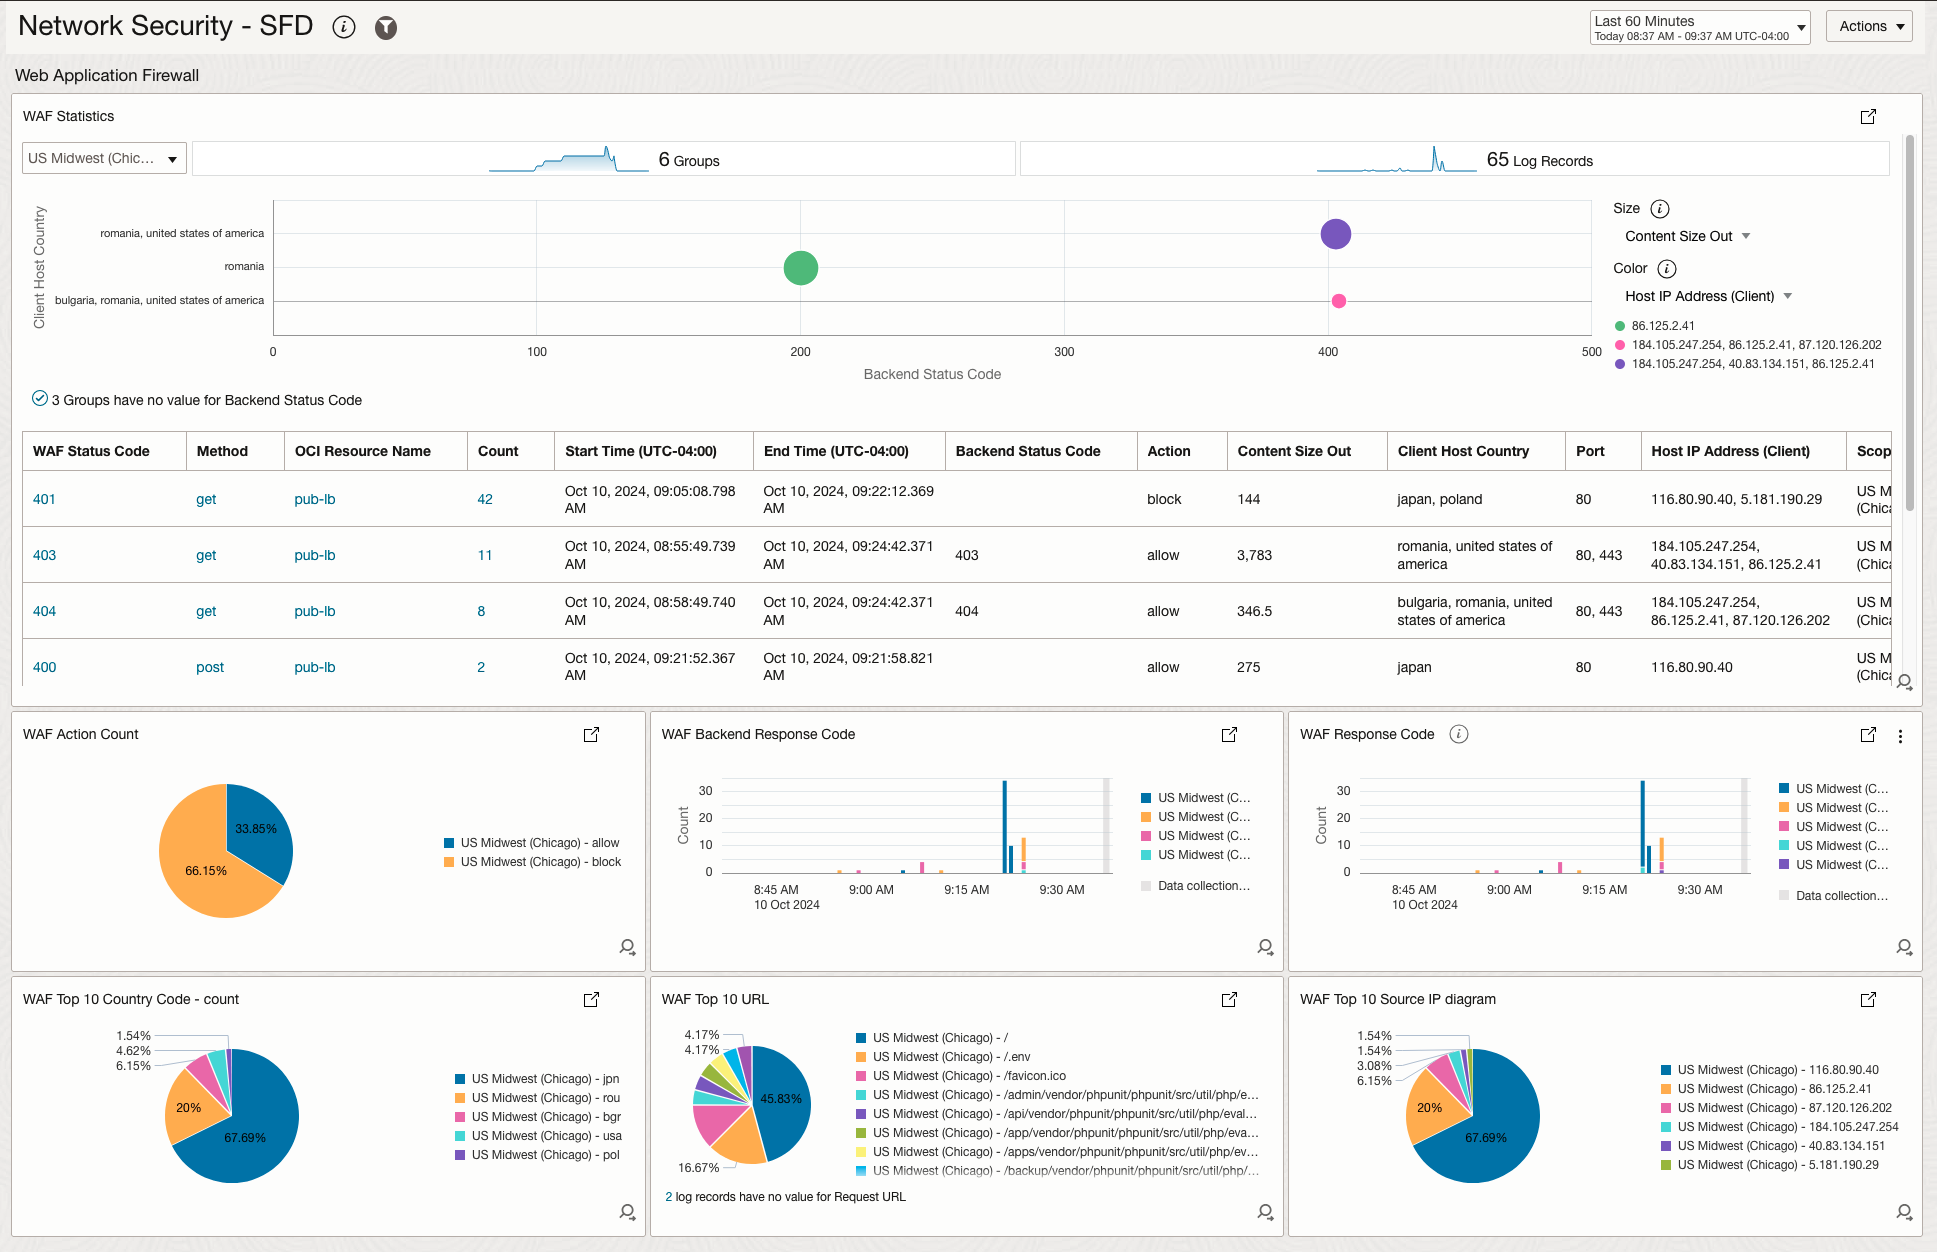
The Web Application Firewall section
The WAF section has a main widget, called WAF Statistics, which gives an overview of all flows passing through the WAF and shows WAF response codes, Public Source IPs, WAF action and many other interesting data. The other widgets show interesting statistical data like the most requested URL, top countries connecting to the WAF, WAF action.
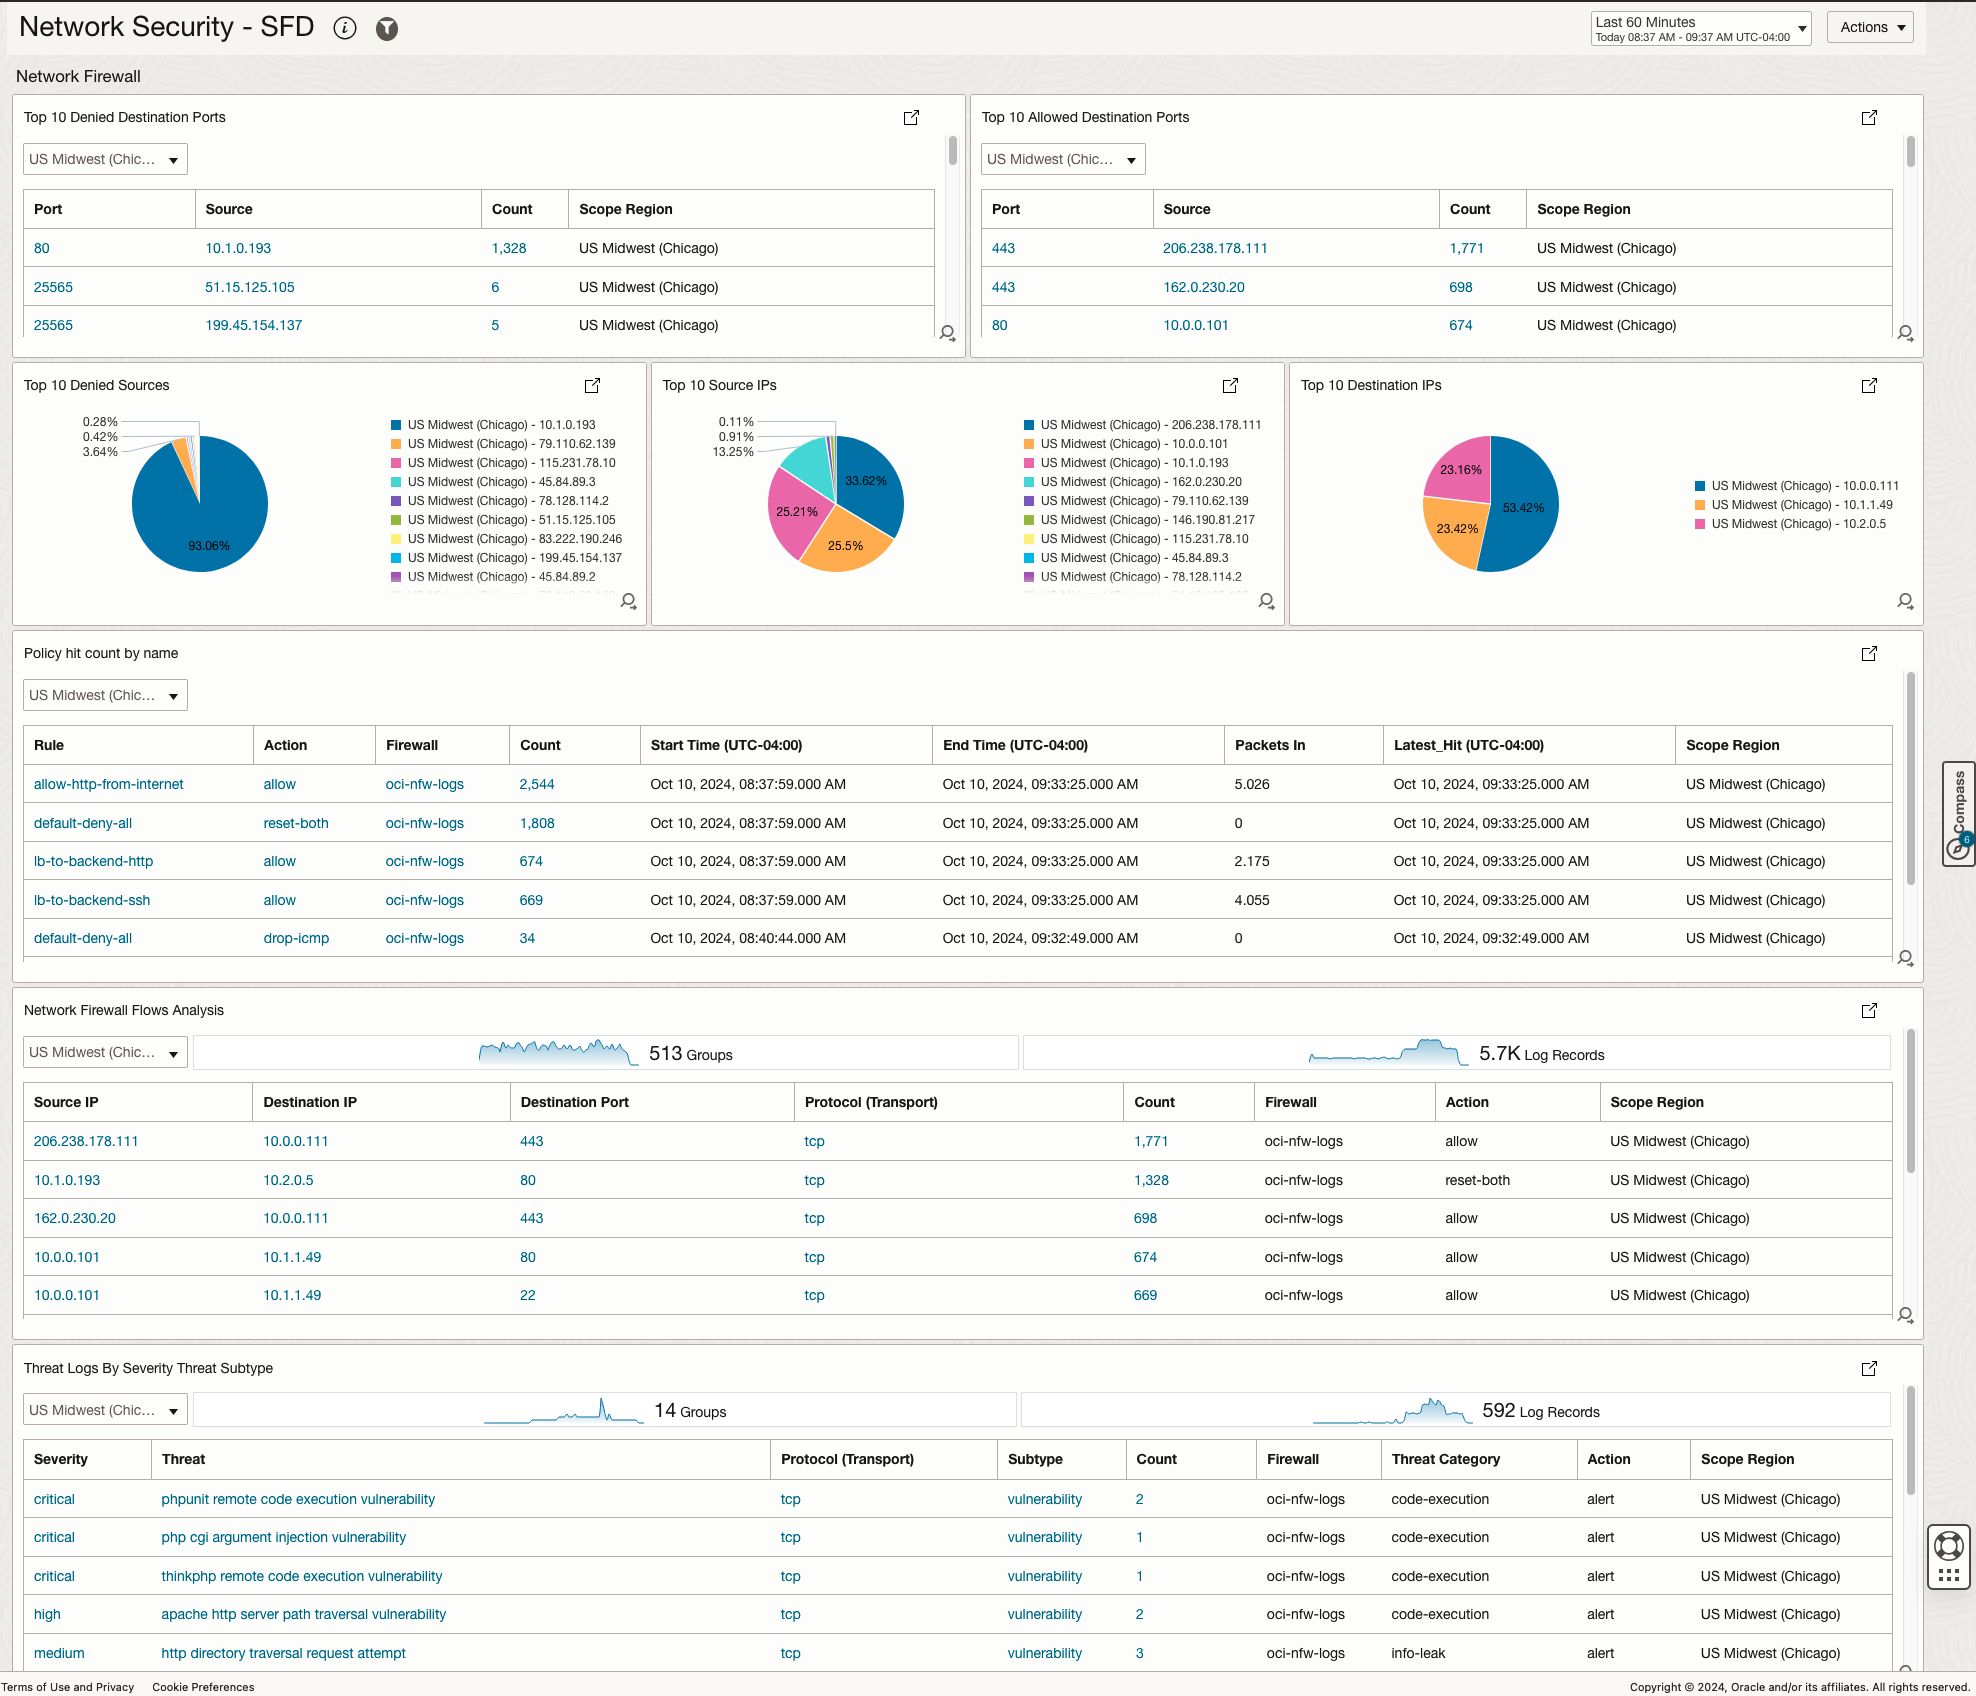
The OCI Network Firewall Section
The Network Firewall section is based on the two firewall logs, traffic and threat. From the traffic log we can observe interesting data related to network flows and firewall policy usage while from the threat log we can observe detected attacks and the action taken by the firewall.
Network Security Dashboards Widgets
| Section | Widget | Description |
|---|---|---|
| VCN | Total Network Traffic | The total network traffic of the environment, as observed by the VCN Flow Logs, in KiloBytes. |
| VCN | Network Egress Traffic to Public | The total volume of traffic egressing from the VCN towards the Internet, counted by observing the Public IPs in the VCN Flow Logs. |
| VCN | Network Egress Traffic from Public | The total volume of traffic ingressing from the Internet towards the VCN, counted by observing the Public IPs in the VCN Flow Logs. |
| VCN | Threat IPs | A count of the number of observed Public Threat IPs that are communicating with the environment. The Threat IPs are described in OCI’s Threat Intelligence service. |
| VCN | Denied Connections by Source | An overview of all Source IPs that are being denied to connect to the environment. |
| VCN | Denied Connections by Destination Port | An overview of the most denied destination ports. |
| VCN | VCN Flows Analysis | A statistical view of all the network flows in the environment, ordered by the number of sessions for each flow. The flow is defined as Source IP, Destination IP, Destination Port and Transport Protocol. |
| VCN | Network Changes | An overview of all user made changes in the environment, focused on the networking constructs – VCN, Subnets, VCN Route Tables, Security Lists, Network Security Groups, Gateways. |
| LB | HTTP Response Code | A statistical view of all HTTP Response codes observed in the environment, across all Load Balancers. |
| LB | HTTP Response 4XX and 5XX | A statistical view of all 4XX and 5XX HTTP Response codes observed in the environment, across all Load Balancers. |
| LB | Total Requests by LB | The number of requests reaching each Load Balancer. |
| LB | Load Balancer Errors | A list of all Load Balancer errors as reported by the Error Log. |
| LB | DNS Host Access | A list of all observed requested Hostnames, as seen in the HTTP Host Header. |
| WAF | WAF Statistics | A complex statistical analysis of the WAF traffic, ordered by the Top Talkers. The widget shows: source IP, requested HTTP Method, WAF Response Code, Backend Response Code, WAF Action. |
| WAF | WAF Action Count | A statistical view of allowed vs denied traffic. |
| WAF | WAF Backend Response Code | All observed WAF backend response codes. |
| WAF | WAF Response Code | All observed WAF response codes. |
| WAF | WAF Top 10 Country Code | Top 10 countries connecting to the WAF. |
| WAF | WAF Top 10 URLs | Top 10 requested URLs. |
| WAF | WAF Top 10 Source IPs | Top 10 source IPs connecting to the WAF. |
| NW FW | Top 10 Denied Destination Ports | A statistical view of the most denied ports, ordered by occurence and Source IP. |
| NW FW | Top 10 Allowed Destination Ports | A statistical view of the most allowed ports, ordered by occurence and Source IP. |
| NW FW | Top 10 Denied Sources | Top 10 Source IPs that were denied, observed across all network flows passing through the firewall. |
| NW FW | Top 10 Source IPs | Top 10 Source IPs observed across all network flows passing through the firewall. |
| NW FW | Top 10 Destination IPs | Top 10 Destination IPs observed across all network flows passing through the firewall, both denied and allowed. |
| NW FW | Policy hit count by name | The number of hits each Firewall Policy has. Policies with 0 hits will not appear. |
| NW FW | Network Firewall Flow Analysis | A statistical view of all the network flows in the environment, ordered by the number of sessions for each flow. The flow is defined as Source IP, Destination IP, Destination Port and Transport Protocol. |
| NW FW | Threat Log by Severity Threat Subtype | All the observed Threats by the firewall, ordered by Severity. The widgets also shows the Action taken by the Network Firewall: allow+alert or reject. |
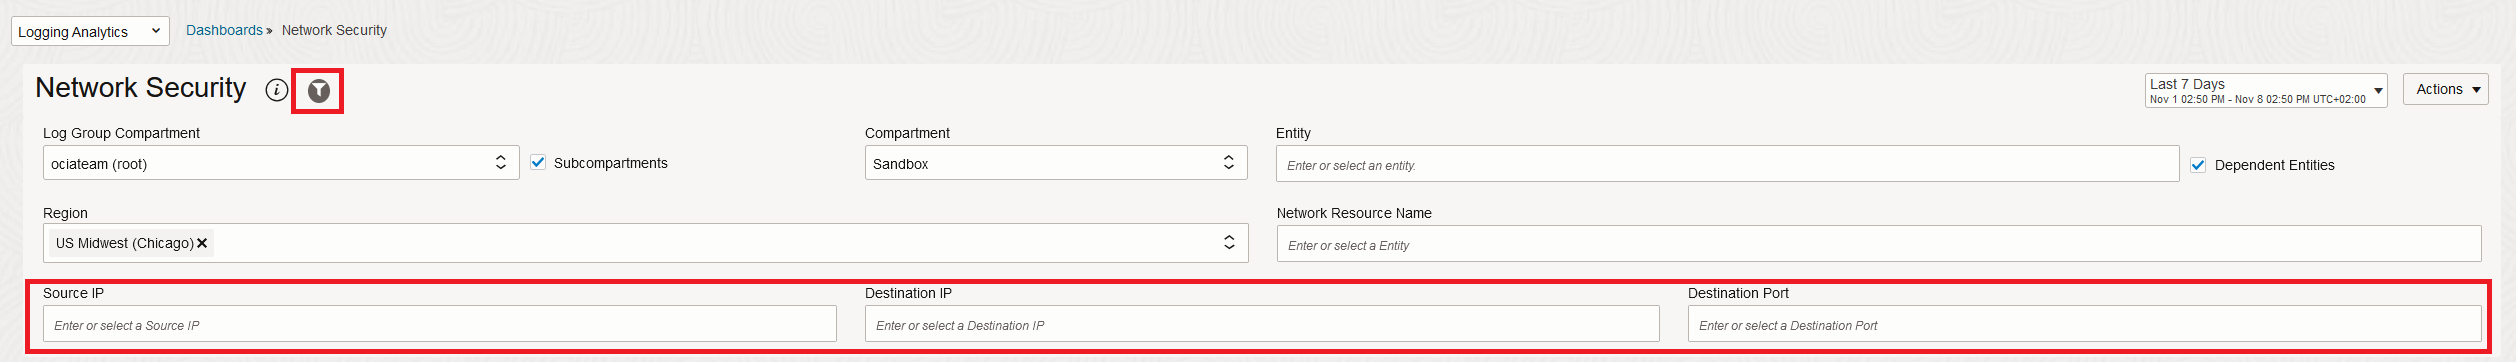
Network Security Dashboard Filters
The Dashboard can also be used as a troubleshooting tool. All the widgets in the Dashboard, across all sections, can be filtered to show data relevant to only a specific Source IP, Destination IP, Destination Port or any combination of the three. This can be achieved by enabling the Dashboard filter.
Network Security Dashboard Onboarding
Enable logs for Network Security
- Enable Logs for VCN Flow Logs
- Enable Logs for OCI Network Firewall Traffic Logs and Threat Logs
- Enable Logs for OCI Load Balancer Access Logs and Error Logs
- Enable Logs for OCI Web Application Firewall
Logging Analytics should be set up in your tenancy
Configure Logging Analytics
- Configure Your Service
- Prerequisite IAM Policies
- Enable Access to Logging Analytics and Its Resources
Enable Threat Intelligence Enrichment for Network Security Dashboard Log Sources
Logging Analytics is integrated with Oracle Threat Intelligence to automatically receive the threat feed as the logs are ingested. The feature is available for all the log sources in the regions where both Logging Analytics and Oracle Threat Intelligence services are enabled. The Threat IPs widget makes use of this feature, which is not enabled by default.
To enable:
- In OCI console, Navigate to Observability and Management -> Logging Analytics -> Administration
- Click on Sources. in search box in the top right, search for “vcn”. You should get 2 sources: OCI VCN Flow Logs and OCI VCN Flow Unified Schema Logs
- Edit each source. On the Edit screen, click the Field Enrichment tab. Ensure the Enabled checkbox is checked for the Geo location function
- Edit the Geo location function by clicking the three dots, and check Threat Intelligence Enrichment checkbox.
- If it is not, check the checkbox and click Save Changes
- Repeat above 5 steps for OCI Network Firewall Traffic Logs, OCI Network Firewall Threat Logs, OCI Load Balancer Access Logs, OCI Load Balancer Error Logs, OCI WAF Logs, OCI Audit Logs Sources.
Network Security Dashboard Deployment using SFD Marketplace App
Security Fundamentals Dashboards (SFD) OCI Marketplace App offers a seamless, one-click solution for customers to effortlessly deploy SFD dashboards and automate the collection of essential security-related logs in Logging Analytics. This streamlined approach simplifies the setup of comprehensive security monitoring across OCI environments, empowering customers to enhance their cloud security posture with minimal effort.
To launch the Marketplace app:
- In OCI console, Navigate to Marketplace -> All Applications
- Search “Security Fundamentals Dashboards”
- Check I have reviewed and accept the Oracle standard Terms and Restrictions.
-
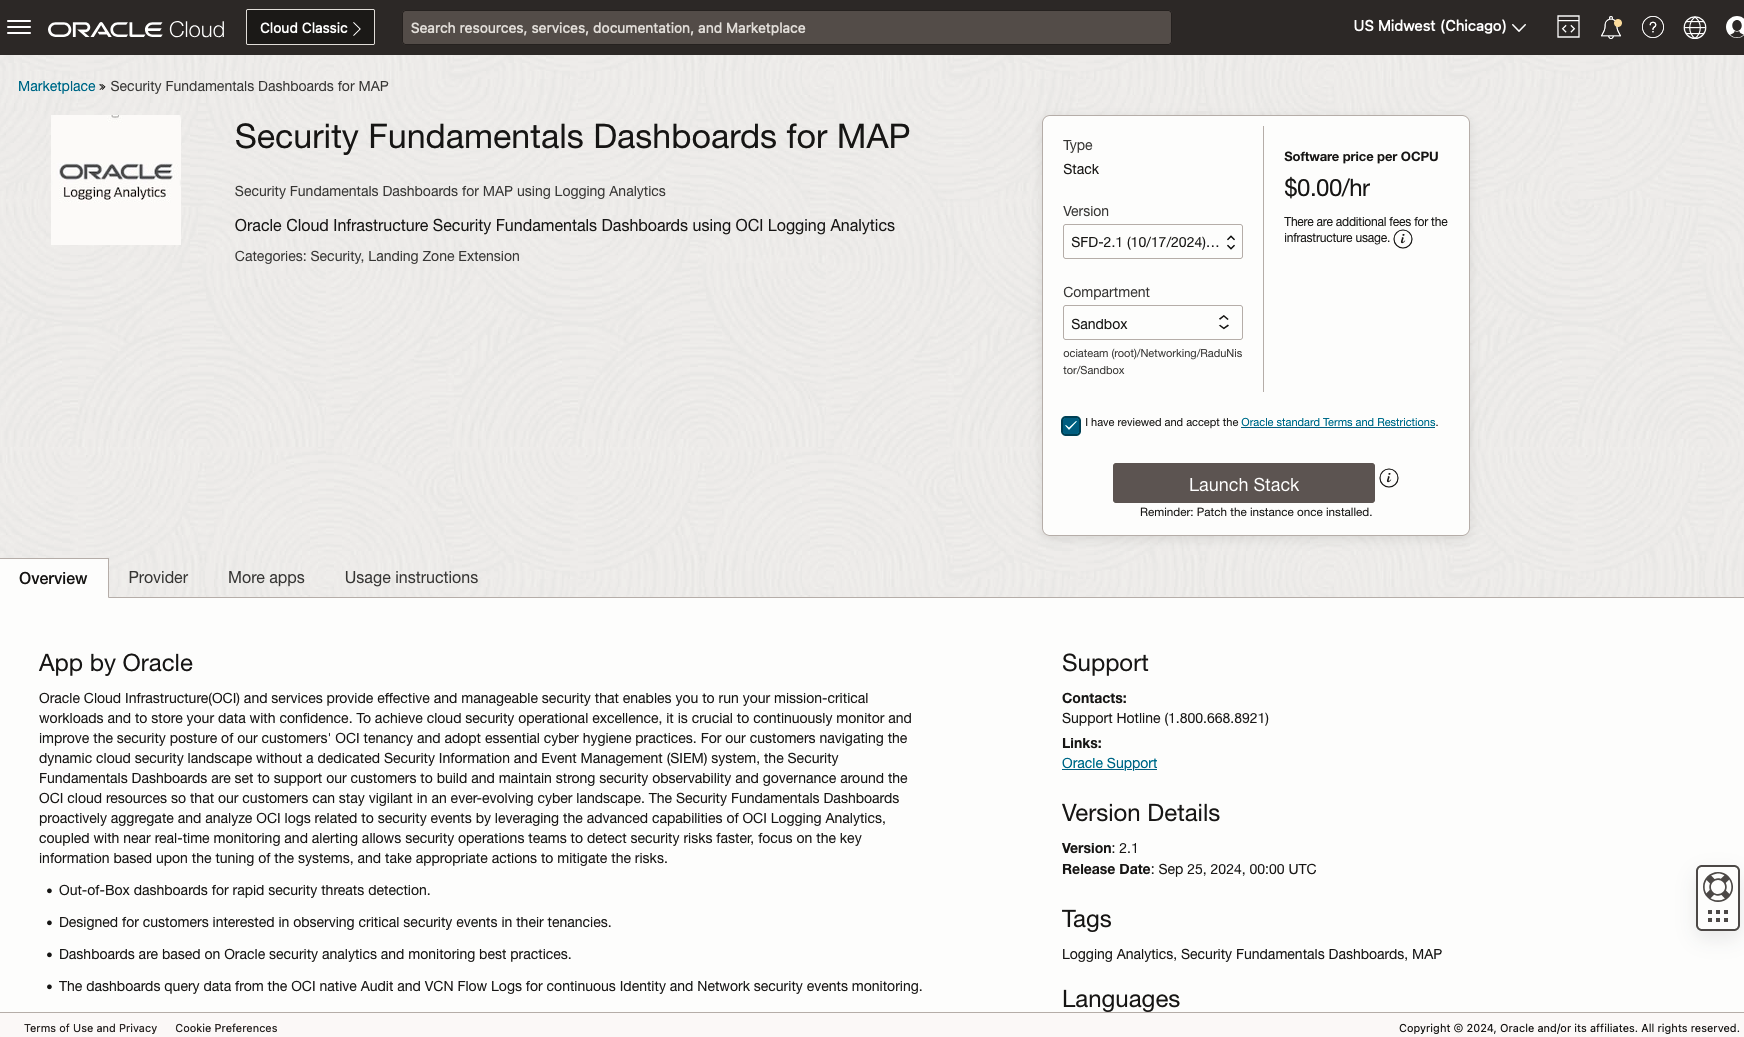
Figure 6. Security Fundamentals Dashboard Marketplace App - Click Launch Stack
- Review the Stack Information and Click Next
- Select the Dashboard Compartment from the dropdown to deploy the dashboards
- Check Create Service Connector for IAM Identity Domain Audit?
- Update the Logging Analytics Log Group Name if needed
- Switch Service Connector Hub State from INACTIVE to ACTIVE
- Check Include Network Related Logs? checkbox
- Add the Logging service Network related logs Log Group OCIDs
- Click Next for the final Review, Click Create to run the stack
-
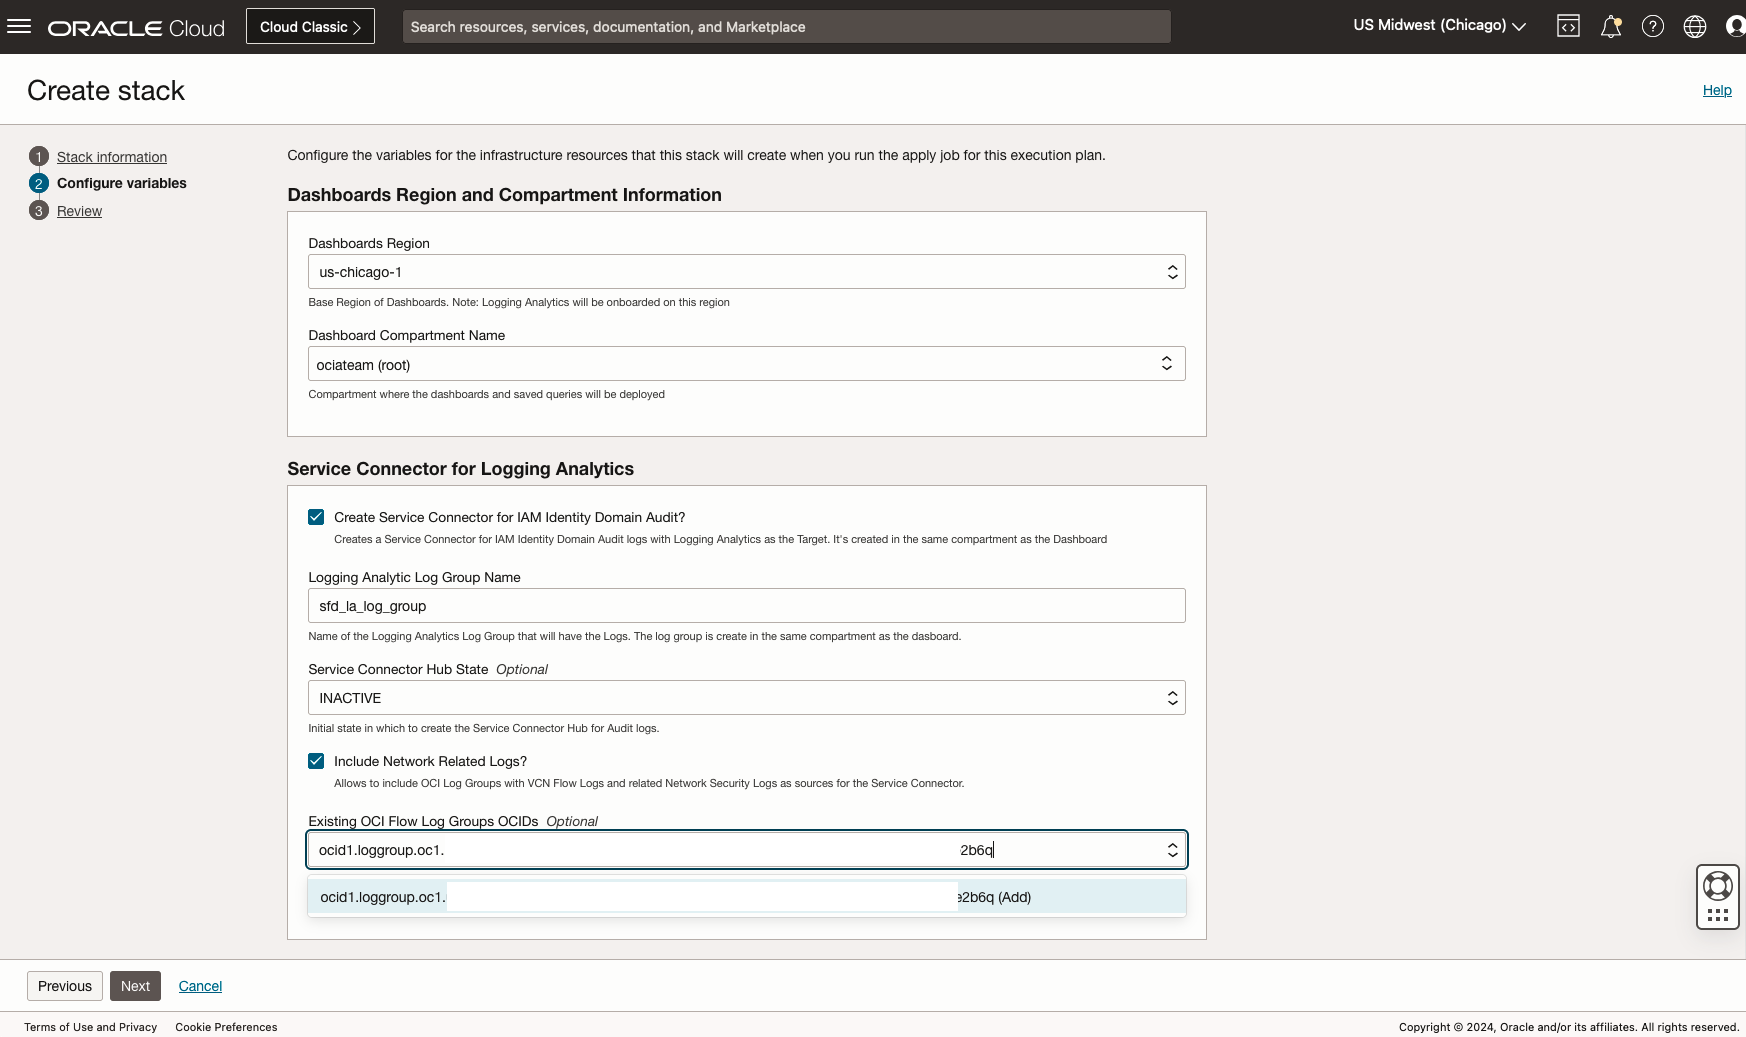
Figure 7. Security Fundamentals Dashboard Stack Launch
Conclusion
Oracle Cloud Infrastructure (OCI) provides a scalable, resilient security framework that empowers businesses to confidently operate mission-critical applications and safeguard their data. Maintaining a robust cloud security posture is essential for operational excellence, requiring continuous monitoring and proactive enhancement. Our Security Fundamentals Dashboards(SFD), already delivering significant value to customers, reflect this commitment to a secure OCI environment. Feel free to try out the dashboards by lauching the Security Fundamentals Dashboards Marketplace app to get the security monitoring enabled for your environment.
Sign up for an Oracle Cloud Infrastructure free trial account today to try out new Oracle Cloud Infrastructure features!
Reference
- Oracle Cloud Infrastructure Security Fundamentals Dashboards using OCI Logging Analytics
- Enable Logs for VCN Flow Logs
- Enable Logs for OCI Network Firewall Traffic Logs and Threat Logs
- Enable Logs for OCI Load Balancer Access Logs and Error Logs
- Enable Logs for OCI Web Application Firewall
- Monitoring OCI Web Application Firewall (WAF) with Logging Analytics
- Logging Analytics – Configure Your Service
- Logging Analytics – Prerequisite IAM Policies
- Logging Analytics – Enable Access to Logging Analytics and Its Resources