Introduction
Oracle Cloud Infrastructure (OCI) provides comprehensive logging capabilities, but integrating these logs with external systems like Elastic requires a robust log shipper. There are many popular open-source data collectors that enables you to unify data collection and consumption. Our team has previously shared articles explaining other log shippers. You may refer to those as well— Ingest Oracle Cloud Infrastructure Logs into Third-Party SIEM Platforms using Log Shippers and Send Oracle Cloud Infrastructure Logs to New Relic using Vector— to determine which solution best fits your use case. In this blog, we will walk through the detailed steps to use Fluentd as a log shipper to ingest OCI logs into Elastic cloud.
Solution
Fluentd is a robust, open-source data collector developed by Treasure Data and now part of the CNCF, designed to streamline log data collection, transformation, and distribution across various systems. It acts as a unified logging layer that gathers logs from diverse sources, processes them using parser and filter plugins, and forwards them to destinations like Elasticsearch, Kafka, or cloud storage. Fluentd can be deployed as a log shipper on a compute instance to capture logs from OCI Logging service and deliver them to Elastic for enhanced monitoring and analysis.
Once Fluentd forwards logs to Elastic, the real power of log data is unlocked. Elastic security indexes and stores the log data in a structured format, enabling powerful search, analysis, and visualization capabilities. By leveraging Elastic’s full-text search engine, users can query and aggregate logs in real-time, uncover patterns, identify anomalies, and generate actionable insights. Additionally, with tools like Kibana, logs can be visualized through interactive dashboards, transforming raw log data into intuitive visual representations that aid in monitoring application performance, detecting security threats, and troubleshooting operational issues effectively.
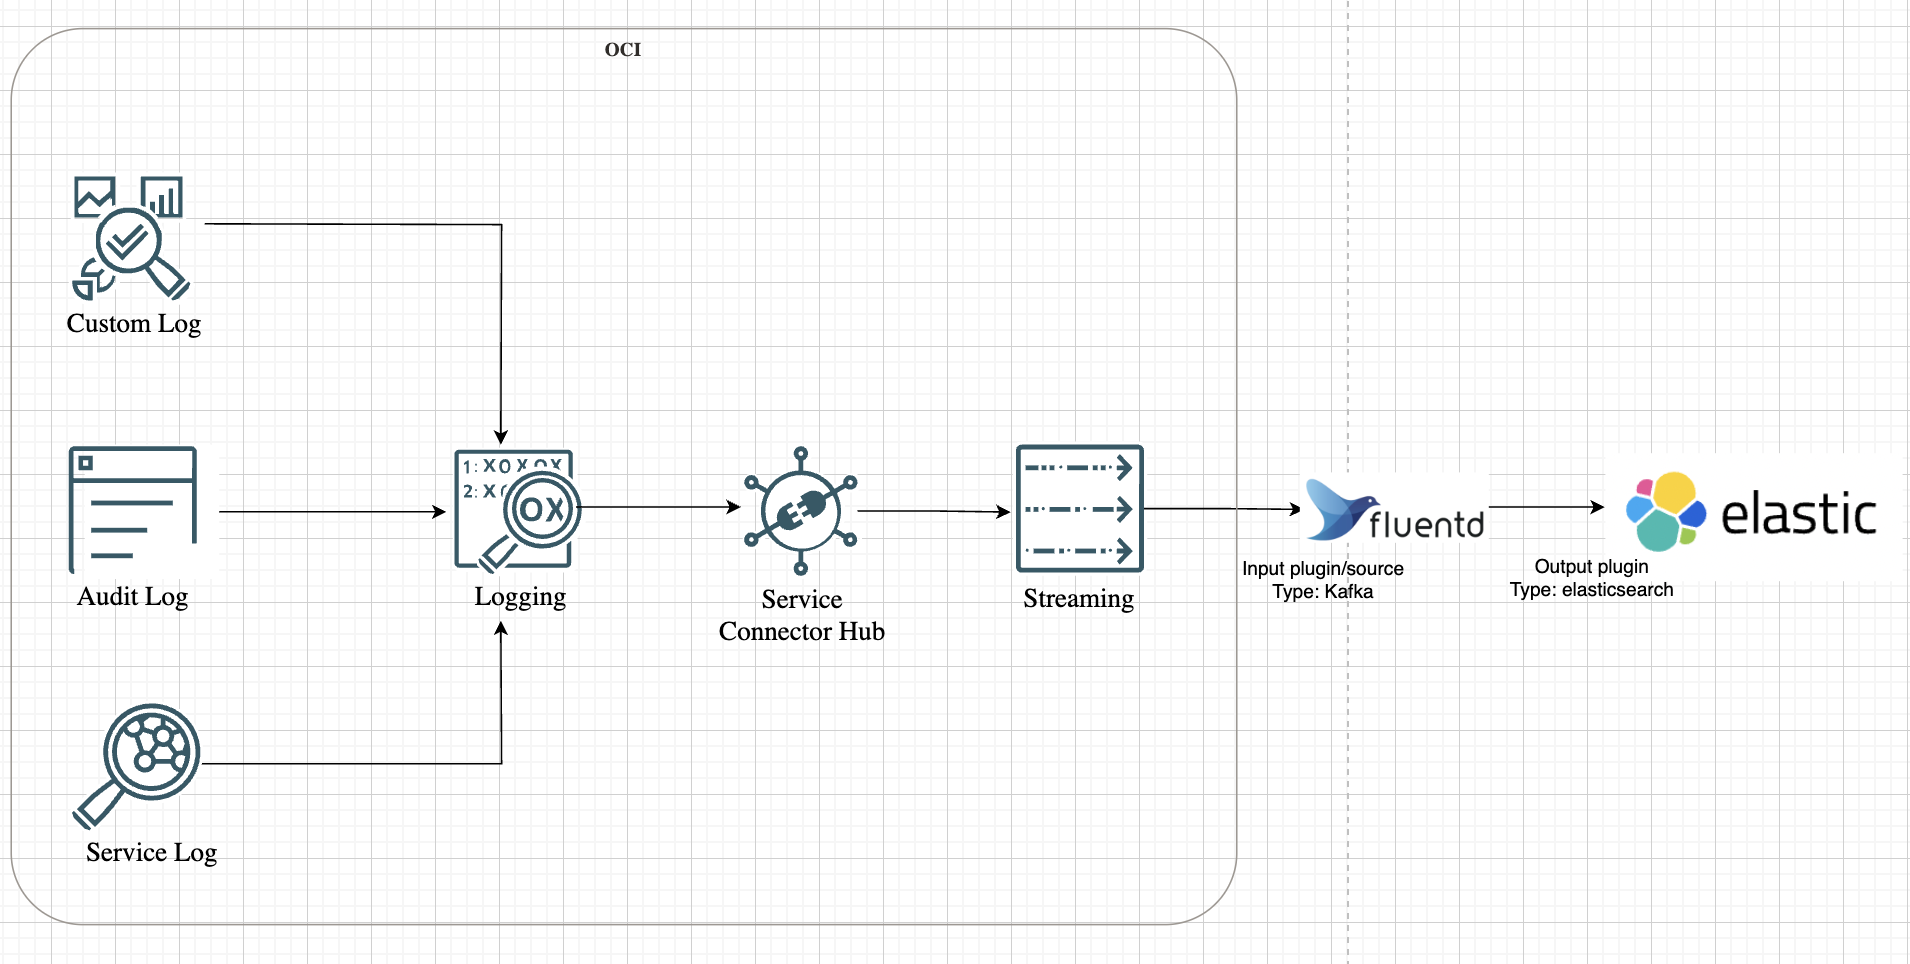
Let us look at the high-level representation of the solution architecture as shown in the following image.
Setting the Stage: Preparing OCI for Log Streaming
Before Fluentd can start shipping logs, the data needs a consistent source. In OCI, that source is a Kafka-compatible stream.
Imagine setting up a stream as a centralized data pipeline for logs. Every log event generated within OCI — from Compute instances to Networking services — can be directed to this stream. This not only consolidates log data but also ensures that Fluentd has a single endpoint to pull data from.
To create a stream in OCI, navigate to the Streaming service and define the stream configuration: partitions, retention periods, and more. Think of it as setting up a conveyor belt where logs are neatly packaged and ready for collection.
But the stream is just one part of the puzzle. OCI’s Service Connector Hub (SCH) acts as the orchestrator, routing logs from various services to the stream. With SCH, you can define connectors that move logs from OCI Logging service— which has Audit logs, Service logs and Custom logs— and direct them to the stream.
Refer to our doc to get into the details on how to capture logs and setting up OCI SCH and Stream.
Deploying Fluentd: The Log Shipper in Action
With the stream up and running, it’s time to set up Fluentd. Here, the objective is to deploy Fluentd on a Compute instance and configure it to consume logs from the stream.
Why a Compute instance? Think of it as the intermediary that bridges the gap between OCI logs and Elastic cloud. It’s where Fluentd will run, ingest data from the stream, and relay it to Elastic.
SSH into the instance and install Fluentd. The installation is straightforward, using the Treasure Data package manager:
curl -fsSL https://toolbelt.treasuredata.com/sh/install-redhat-fluent-package5-lts.sh | sh
A quick version check confirms that Fluentd is installed:
fluentd --version
Note: While spinning up the compute instance in OCI, make sure the add-on for the Custom log is disabled.
Bringing Plugins into the Mix: Kafka and Elasticsearch
Now that Fluentd is ready, it needs to be equipped with plugins. In this architecture, Fluentd acts as both a consumer of stream data and a forwarder to Elasticsearch. This requires the installation of two key plugins:
-
Kafka Plugin: Allows Fluentd to consume data from the OCI stream.
-
Elasticsearch Plugin: Forwards log data to Elasticsearch.
Install both plugins in one go:
fluent-gem install fluent-plugin-kafka fluent-plugin-elasticsearch
First Things First: Outputting Logs to stdout
Before forwarding logs to Elasticsearch, it’s a good practice to verify that the log ingestion flow is working. This is where stdout comes in.
Imagine Fluentd as a chef in a kitchen. Before serving the final dish, the chef tastes it first. stdout is that tasting phase — it ensures that the data is flowing correctly from the stream before sending it to Elasticsearch.
To implement this, update the Fluentd configuration:
$ sudo vi /etc/fluent/fluentd.conf

<source>
  @type kafka_group
  brokers <stream_endpoint>:9092
  topics <stream_topic>
  format json
  username <tenancy_name>/<domain_name>/<username>/ocid1.streampool.oc1.iad.##########
  password <password>
  ssl_ca_cert /etc/fluent/kafka_chain.pem
  sasl_over_ssl true
  consumer_group fluentd-group
  <parse>
    @type json
  </parse>
</source>

<match **>
  @type stdout
</match>
Replace <stream_endpoint> and <stream_topic> with the actual stream details and replace the username and password with the Kafka Connection Settings details collected from Stream Pool details in OCI.
Note: The ssl_ca_cert should be a full certificate chain that should include Server cert (OCI Streaming certs), intermediate and root certificates.
Now, start Fluentd and monitor the output:
$ sudo systemctl restart fluentd.service
$ sudo systemctl status fluentd.service
$ sudo cat /var/log/fluent/fluentd.log
If everything is working, logs from the stream will start appearing in the console. This is the verification phase — ensuring that the data pipeline is functioning as expected before moving forward.
Shipping Logs to Elasticsearch: The Final Step
With the pipeline verified, it’s time to reconfigure Fluentd to forward logs to Elasticsearch. This step transforms Fluentd from a simple log consumer to a full-fledged log shipper.
Update the configuration to include the Elasticsearch output plugin:
$ sudo vi /etc/fluent/fluentd.conf

<source>
  @type kafka_group
  brokers <stream_endpoint>:9092
  topics <stream_topic>
  format json
  username <tenancy_name>/<domain_name>/<username>/ocid1.streampool.oc1.iad.##########
  password <password>
  ssl_ca_cert /etc/fluent/kafka_chain.pem
  sasl_over_ssl true
  consumer_group fluentd-group
</source>

<match **>
  @type elasticsearch
  cloud_id ###########
  cloud_auth 'elastic:##########'
  logstash_prefix fluentd
  logstash_format true
  index_name fluentd
</match>
Here, Fluentd is not just ingesting logs from the stream — it’s refining them into a structured JSON format, enriched with precise timestamps and comprehensive log records.
Note: The Cloud ID is a unique ID which gets assigned to your hosted Elasticsearch cluster on Elastic Cloud. All deployments automatically get a Cloud ID. Refer to the doc to find your Cloud ID and password for the elastic user.
Restart Fluentd to apply the changes:
sudo systemctl restart fluentd.service
Unlocking Insights in Elasticsearch
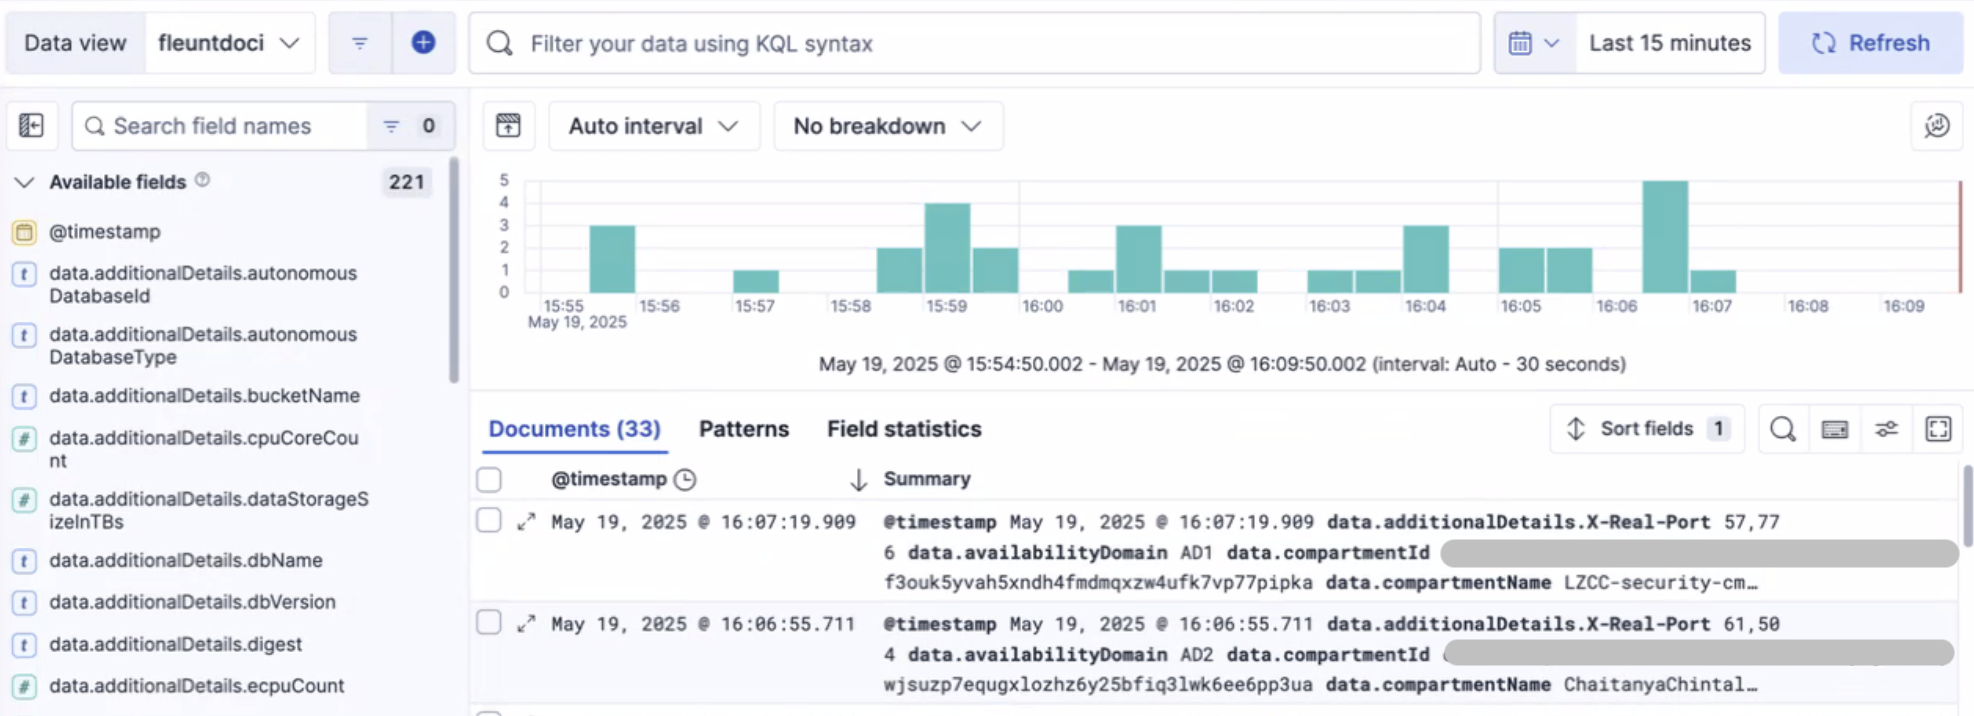
Now that logs are streaming into Elasticsearch, the data is indexed and structured for efficient querying. Elasticsearch’s full-text search engine brings logs to life, enabling you to search, aggregate, and visualize data in real time.
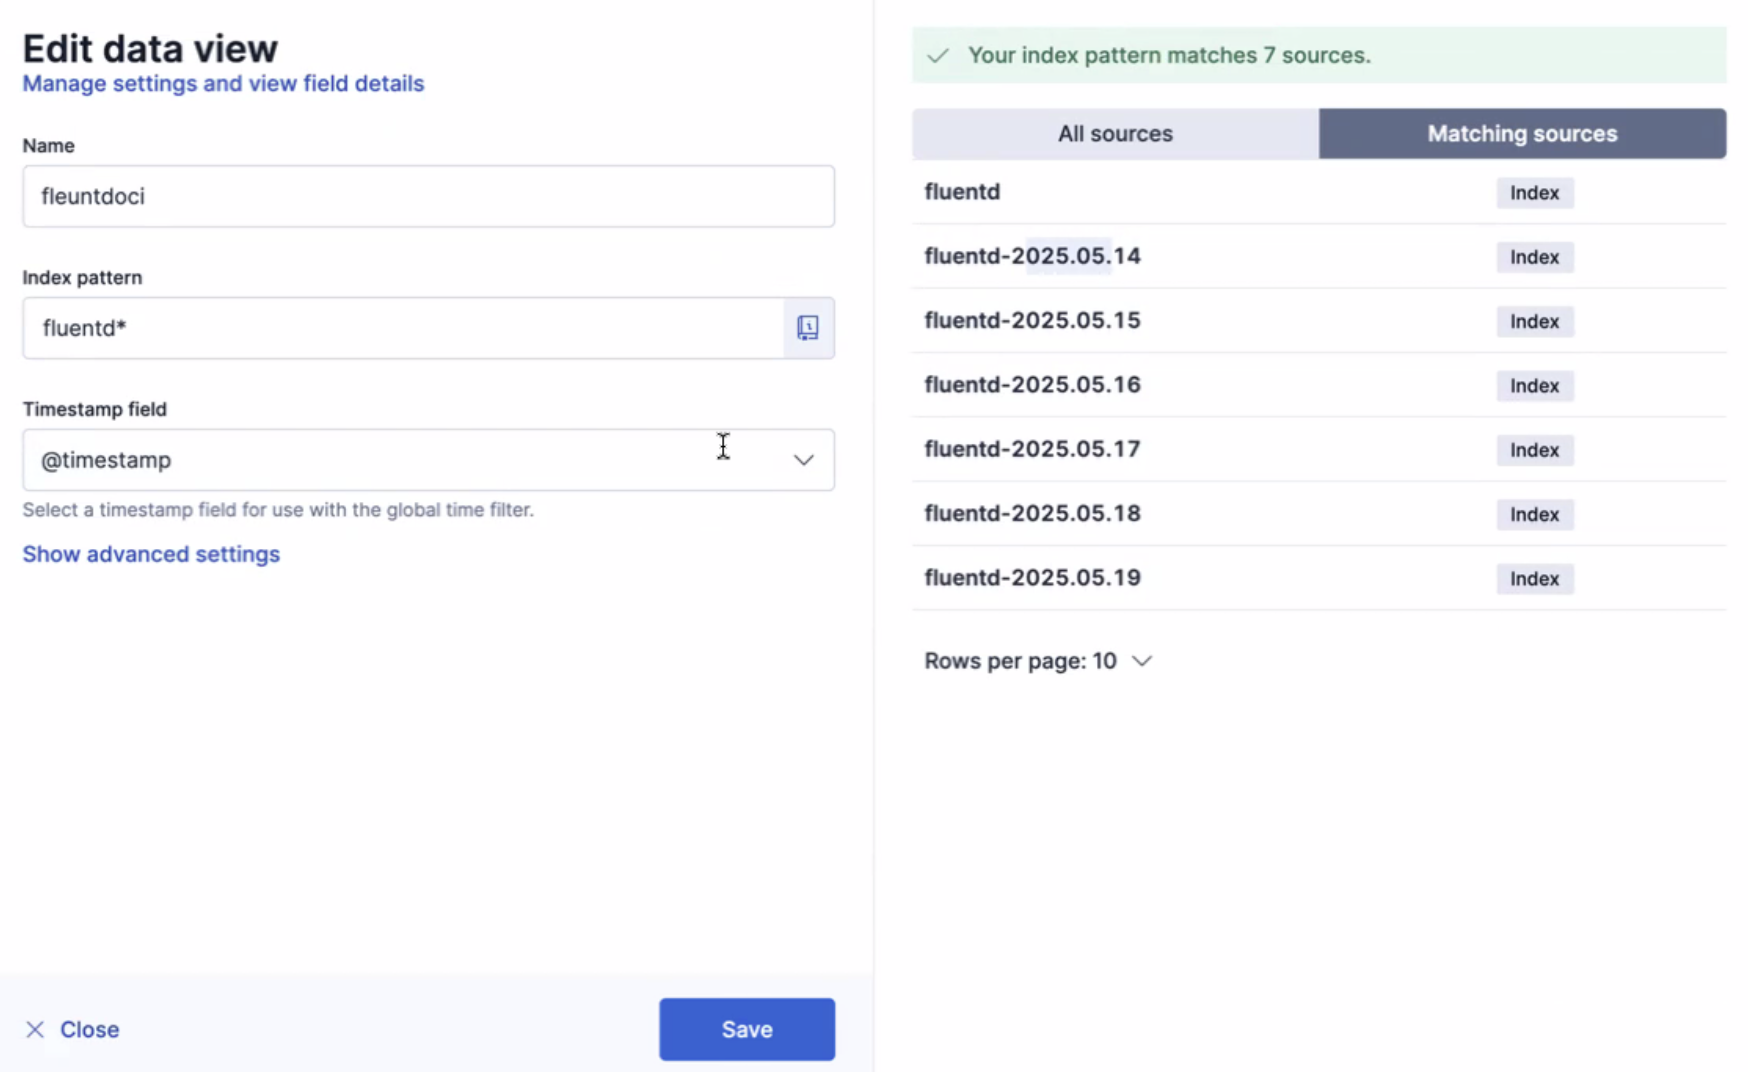
It is essential to create a data view. This data view serves as a structured layer that organizes log data, enabling you to seamlessly explore and extract valuable insights.
Conclusion: Unifying Logs Across OCI and Beyond
Centralizing log data from OCI into Elasticsearch not only enhances monitoring but also provides a unified view across multiple services. Fluentd acts as the glue that binds disparate log sources, ensuring data consistency and accessibility in hybrid environments.
From tracking application performance to identifying security anomalies, the combination of Fluentd and Elasticsearch forms a powerful observability stack for any cloud-native or multicloud architecture.