Consulting Solutions Architect, Business Intelligence
Background
This blog assumes some basic knowledge of Oracle Analytics Cloud (OAC) – BI Publisher (BIP), Oracle Analytics Publisher (BIP) Desktop, and RTF Templates.
BIP Desktop can be downloaded from here. The BIP Desktop bit version must match the MS Office bit version (which is not necessarily the same as the Operating System bit).
This blog was tested on:
* Microsoft Office Standard 2016 – Microsoft Word 2016 (16.0.5044.1000) MSO (16.0.5032.1000) 32-bit
* Oracle Analytics Cloud (OAC) Version 5.5.0
* Oracle Analytics Publisher (BIP) 12.2.5.5.0
* Oracle BI Publisher Desktop 12.2.1.4.0 for 32 bit Office on Windows – Build 12.214.00.000
* Windows 10 Pro – 64-bit Operating System
The blog is divided into five sections:
1) Table Alternate Row Shading
2) Replacing Nulls With Dashes
3) Using Bullets
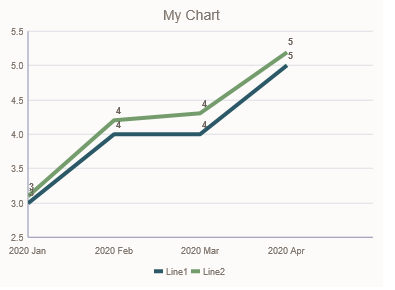
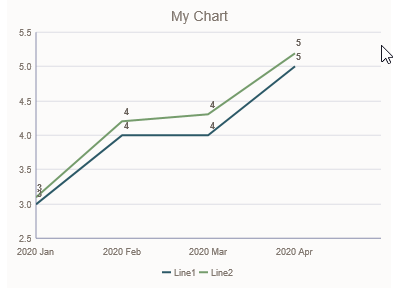
4) Chart Tips & Tricks:
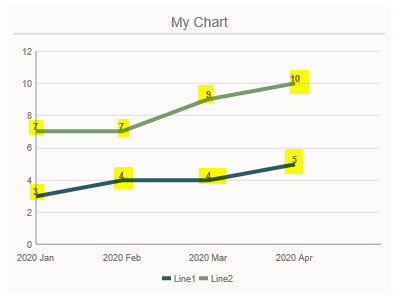
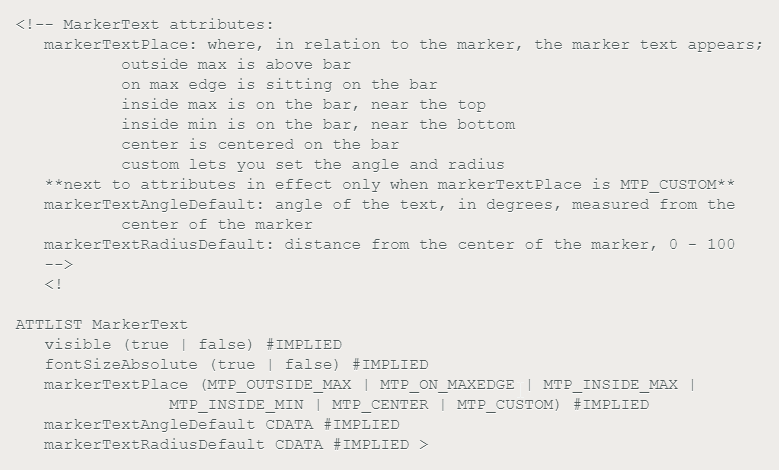
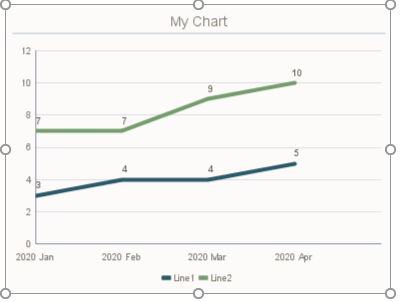
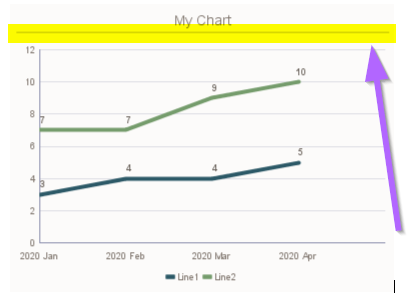
i) Shift Label From Line
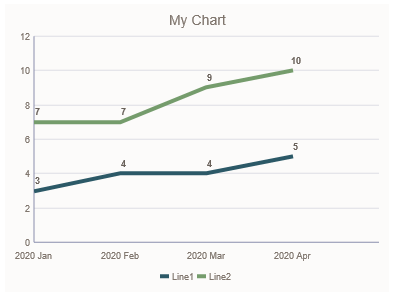
ii) Remove Line Beneath Heading
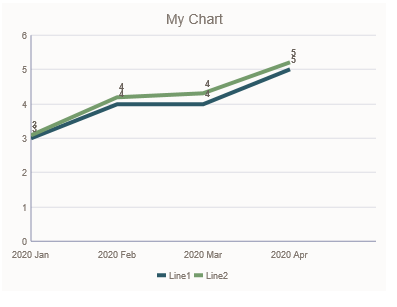
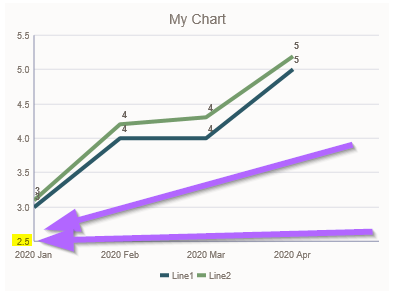
iii) Auto Scale Axis
iv) Thin Chart Lines
5) Conditional Formatting – Numeric vs. Alphanumeric
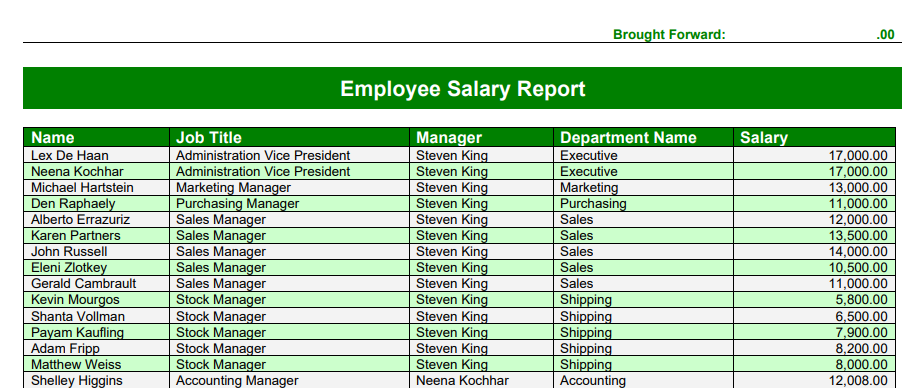
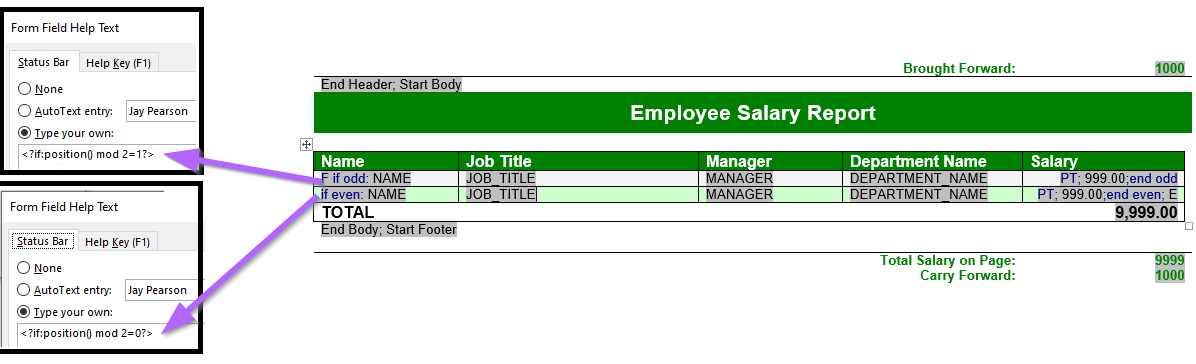
Table Alternate Row Shading
To achieve alternate row shading as shown in the above report, create two lines in the MS Word table one for each format.
Then use <?if:position() mod 2=1?> and <?if:position() mod 2=0?> to specify odd and even formatting.
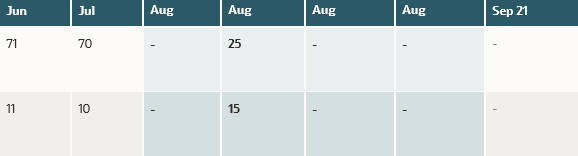
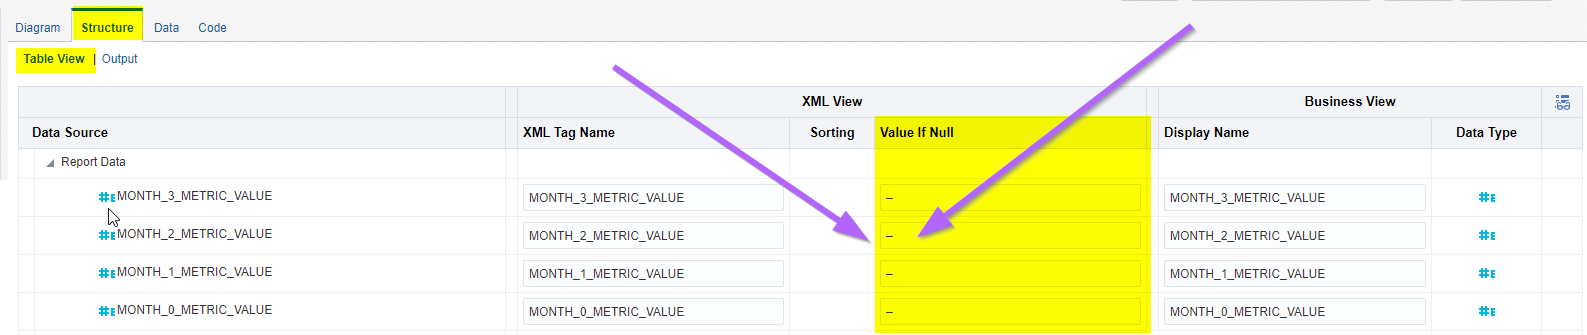
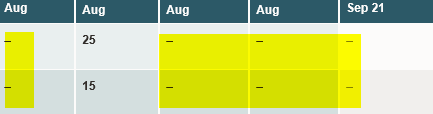
Replacing Nulls With Dashes
To replace nulls with dashes as shown in the above report, edit the data model, go to the structure tab, enter a dash in “Value If Null”.
Using Bullets
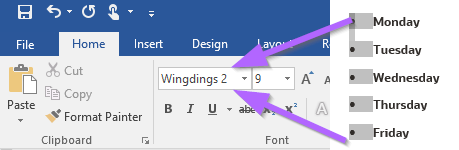
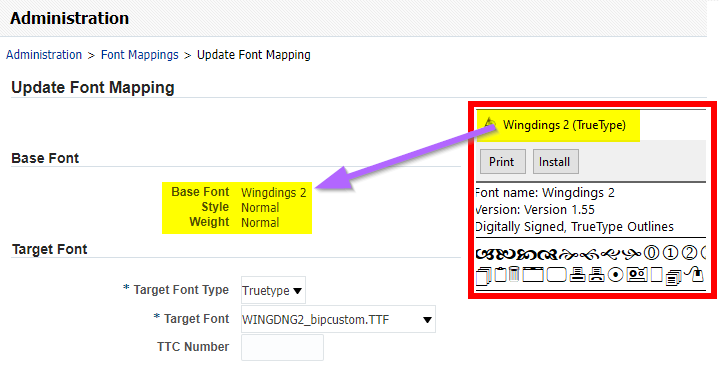
To use bullets in BIP, add the bullets to the RTF, select the bullet in MS Word to confirm what font it is using.
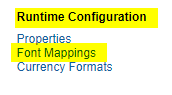
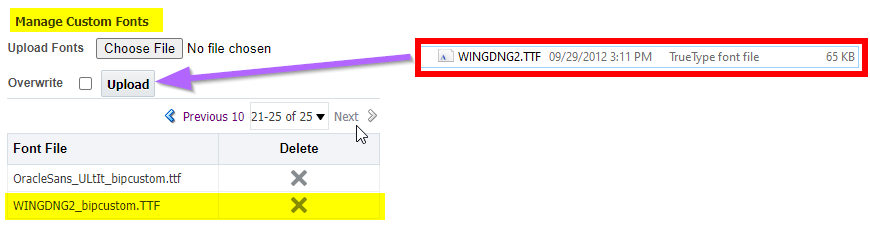
Add the font in BIP Administration -> Runtime Configuration -> Font Mappings -> Manage Custom Fonts -> Upload the font (i.e. WINGDNG2.TTF).
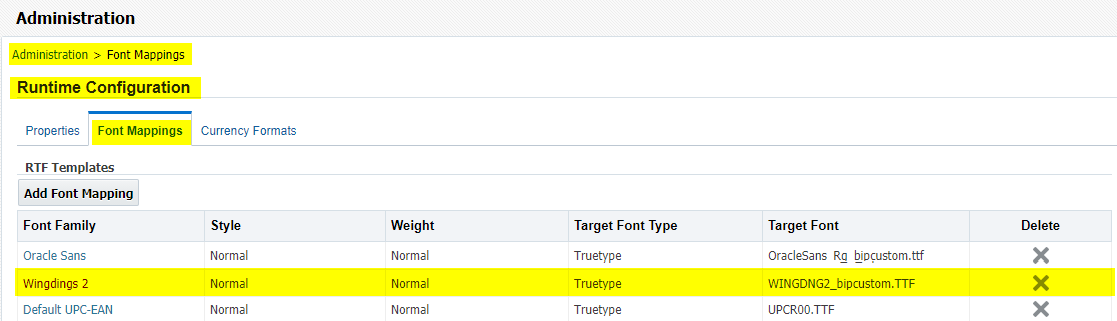
Add the font to Font mappings -> RTF Templates. The Base Font name should match the name seen when opening the TTF font file (i.e. Wingdings 2).
In this particular example nulls were converted to “em dashes” in the data model. The desire was to format nulls/dashes as valid values. However, the RTF was unable to interpret the “em dash” as a string. As a workaround “Not a Number [NaN]” was used to evaluate if a dash/null was present in the field. The field is converted to a number then a string. After which it is possible to evaluate if it is a number or not. NaN may come in handy for other use evaluate/decode/if-else/case statement type scenarios.
i.e.
Not a Number: <?if:string(number(FieldName))!=’NaN’?>
Is a Number: <?if:string(number(FieldName))=’NaN’?>
Want to Learn More?
Click here for more A-Team Oracle Analytics (OAC) Blogs.
Click here for doc on Oracle BI Publisher Best Practices for SaaS Environments.
Click here for multiple archived BIP blogs written by Tim Dexter.
Summary
This article walked through some helpful advanced tips and tricks using Oracle Analytics Cloud (OAC) – BI Publisher (BIP) – RTF Templates. It covered a number of formatting topics that may be of interest to RTF developers.
Subjects covered included: “Alternate Row Shading”, “Replacing Nulls With Dashes”, “Using Bullets”, “Chart Tips & Tricks”, and “Conditional Formatting”.
The blog assumed some basic knowledge of Oracle Analytics Cloud (OAC) – BI Publisher (BIP), Oracle Analytics Publisher (BIP) Desktop, and RTF Templates.
Authors
Jay Pearson
Consulting Solutions Architect, Business Intelligence