Are you an IT professional looking to optimize your infrastructure using OCI’s dashboarding features? In this blog, we will explore dashboard options available in OCI and provide you with a comprehensive guide to choosing the right one for your needs.From Management Dashboards offering a detailed overview of your entire infrastructure to Console Dashboards providing targeted insights, OCI has a variety of options to suit your requirements.
We will dive into each category and discuss the features, comparisons, and use cases of Management and Console dashboards. By the end of this blog, you will have a solid understanding of the features and differences between Management and Console dashboards. This knowledge will allow you to select the dashboard configuration that aligns with your vision and helps you effectively monitor and manage your OCI resources.
Management Dashboards
The Management Dashboard visualization framework provides a quick overview of the health and performance of resources such as databases, hosts, WebLogic server domains to name a few. Through the use of visually represented information, the dashboard makes it easier to interpret data and identify issues such as outliers so that corrective action can be taken. You can customize your dashboards to display only the information that is important to you, and you can share them with team members or stakeholders to keep them informed and make informed decisions.
Management dashboards are also scalable, allowing you to easily add or remove resources and metrics as your infrastructure grows. This makes it a useful tool for organizations that are looking to improve their resource management and monitoring processes.
Management Dashboard is available as part of Oracle Cloud Infrastructure Observability & Management and can be used for the following services:
- Application Performance Monitoring
- Database Management
- Logging Analytics
- Management Agent
- Ops Insights
- Stack Monitoring
Management Dashboard provides Oracle-defined dashboards, widgets, and filters for common resource-monitoring scenarios for each observability and management service it supports. It also enables users to create custom dashboards and widgets to meet their own specific requirements. Some common terms related to Dashboards are:
- Widgets: Widgets are single data visualizations for one type of resource. They display data in various presentation styles and are primarily used to display monitoring data in a useful manner.
- Filters: Filters are data perspectives that can narrow down the results displayed in a single widget or multiple widgets. This allows users to tailor their data displays to their needs.
Access Management Dashboards in OCI Console
Management Dashboards can be found under Observability & Management.

While on the Management Dashboard page, you will be able to see all the dashboards related to different Observability & Management services. Make sure you choose the correct compartment to see available dashboards. Also, there are filters including service name, created by and updated by to easily look at selected dashboards in the specified compartment. Regardless of which compartment you choose, you wil be able to see Oracle-defined Dashboards for all O&M services. Here is an example of dashboards available from different O&M services.
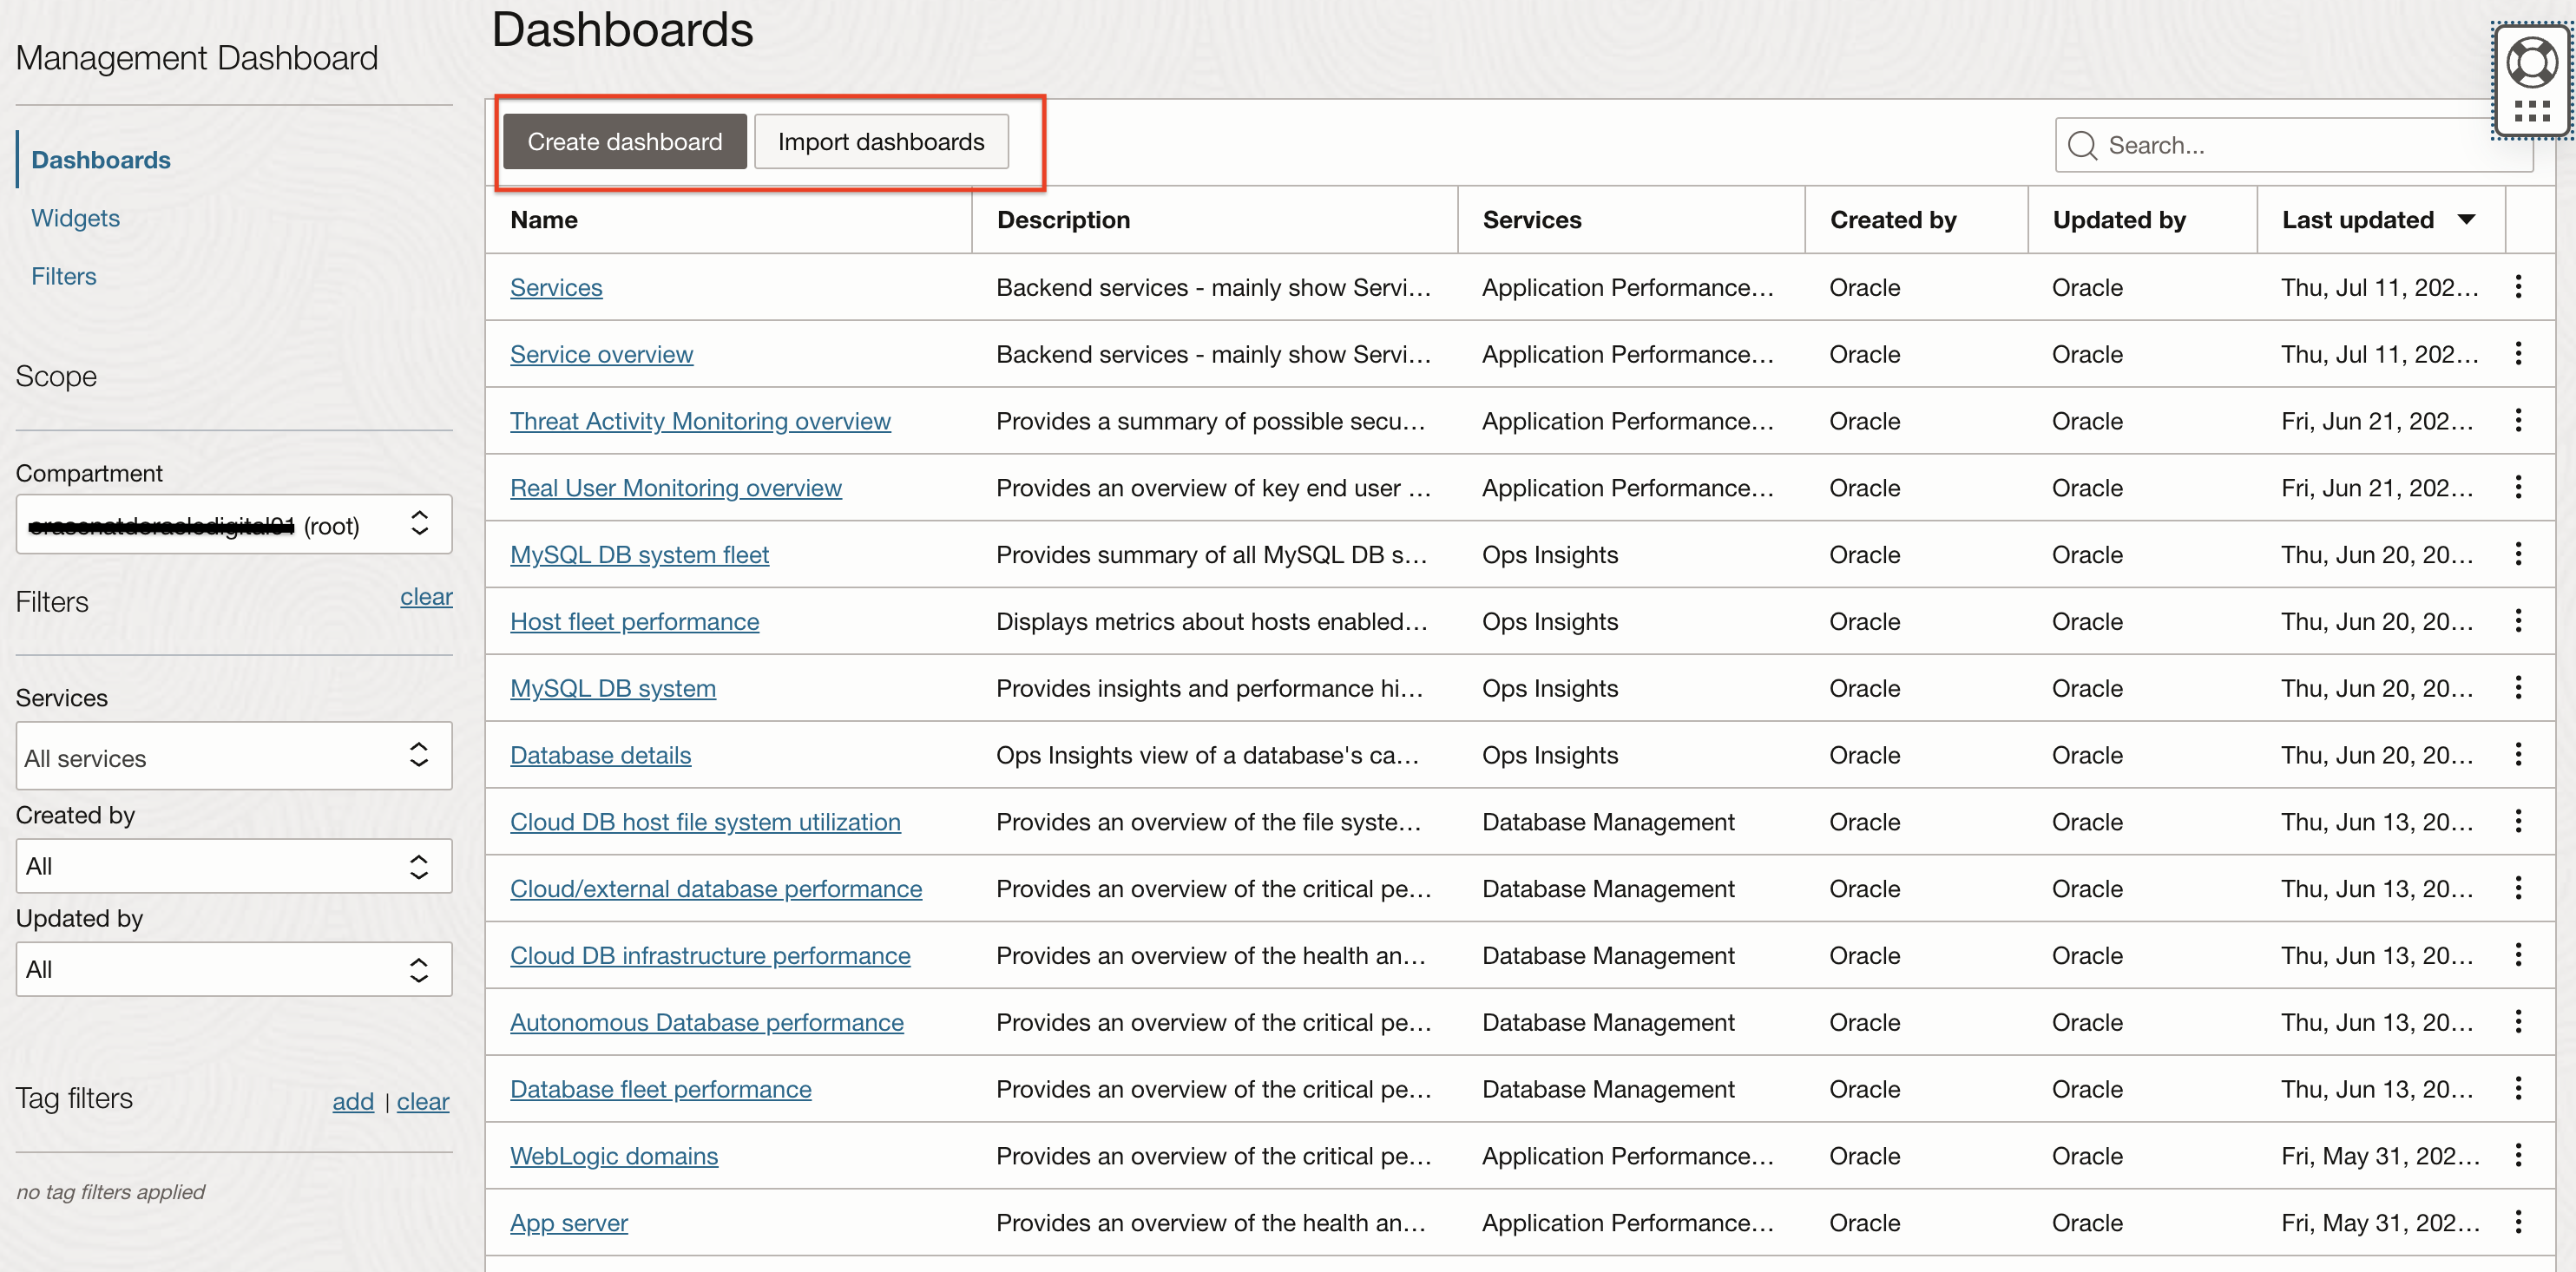
As you can see, all of these dashboards are created by Oracle therefore they are Oracle-defined dashboards. On the same page, you also see the option to “Create dashboards” which means a custom dashboard better suited for your needs. If you have a dashboard already created in JSON configuration then you can use “Import dashboard” option to bring it to OCI. An existing dashboard can also be exported in a JSON format.
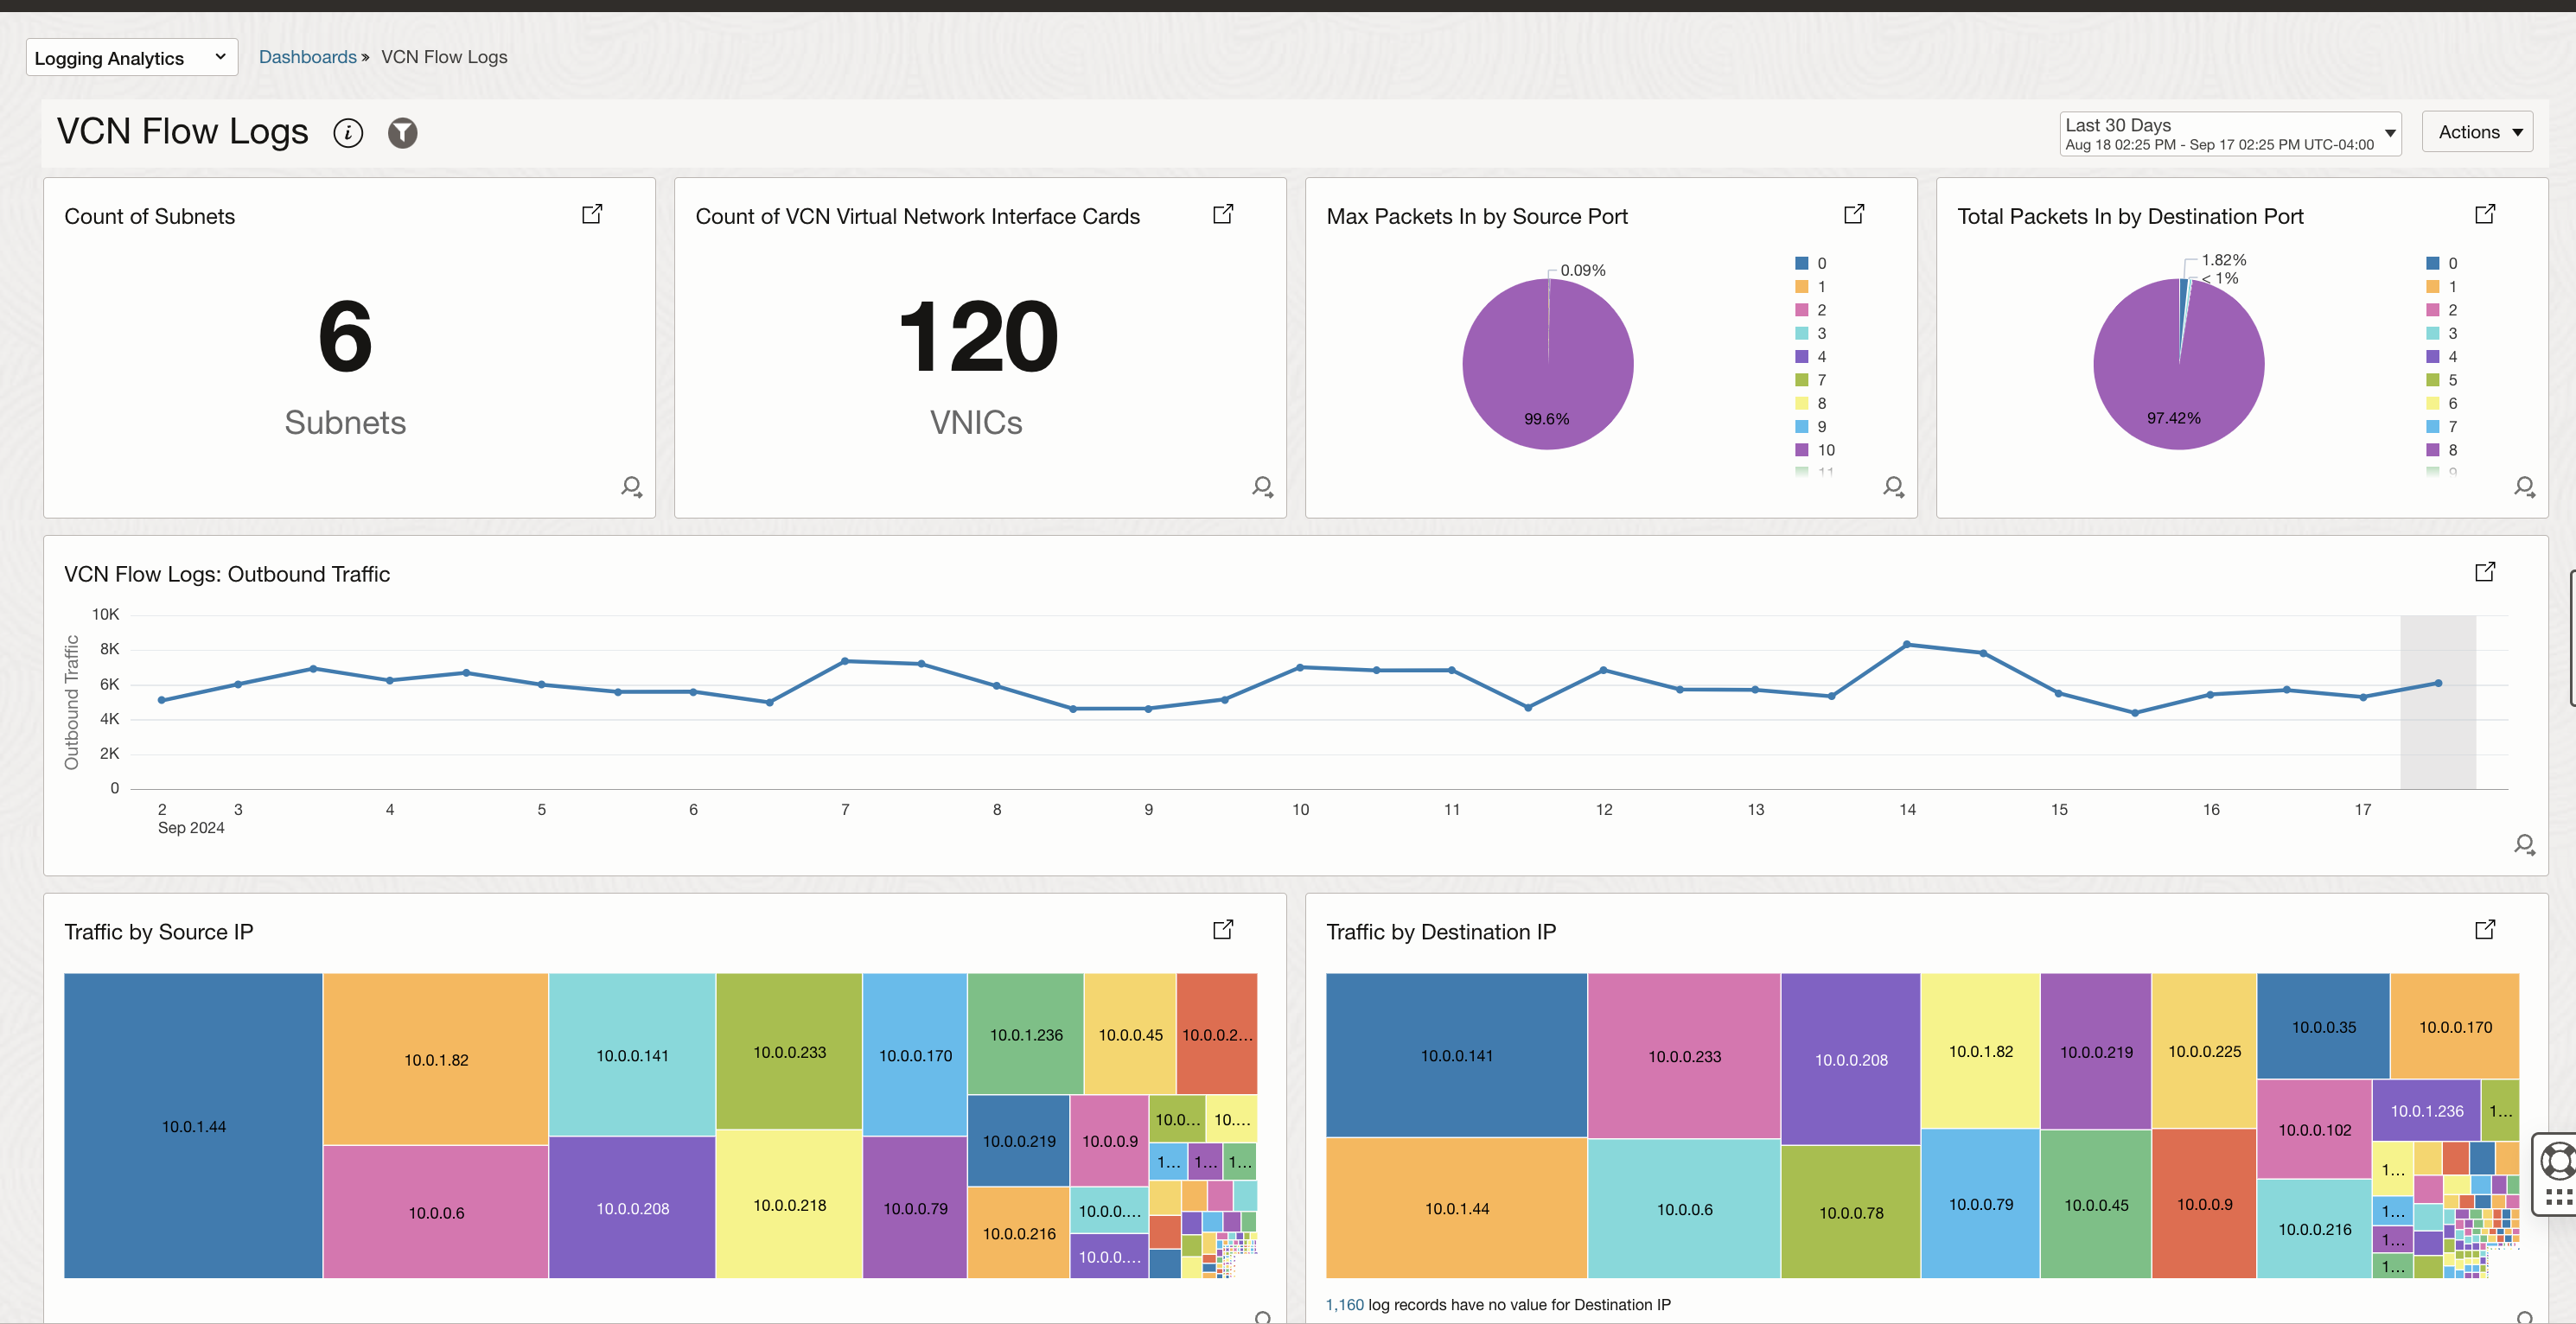
Following image shows an Oracle-defined dashboard created for VCN Flow Logs using Logging Aanlytics. All the widgets in this dashboard are created using Logging Aanlytics search and visulation capabilities including Machine Learning based visualizations such as Cluster, Link.

Widgets
Widgets and Filters are the building blocks of a Dashboard. There are multiple Oracle-defined widgets that are available to be added to the dashboard but you can always create your own widgets. Widgets and Filters can also be duplicated and customized.
The image below shows some examples of widgets that are created by Oracle for O&M services. You can choose to start working with these pre-defined widgets by adding them to a new or existing dashboard. Please note that in order to customize any Oracle-defined dashboard, you need to first duplicate it.
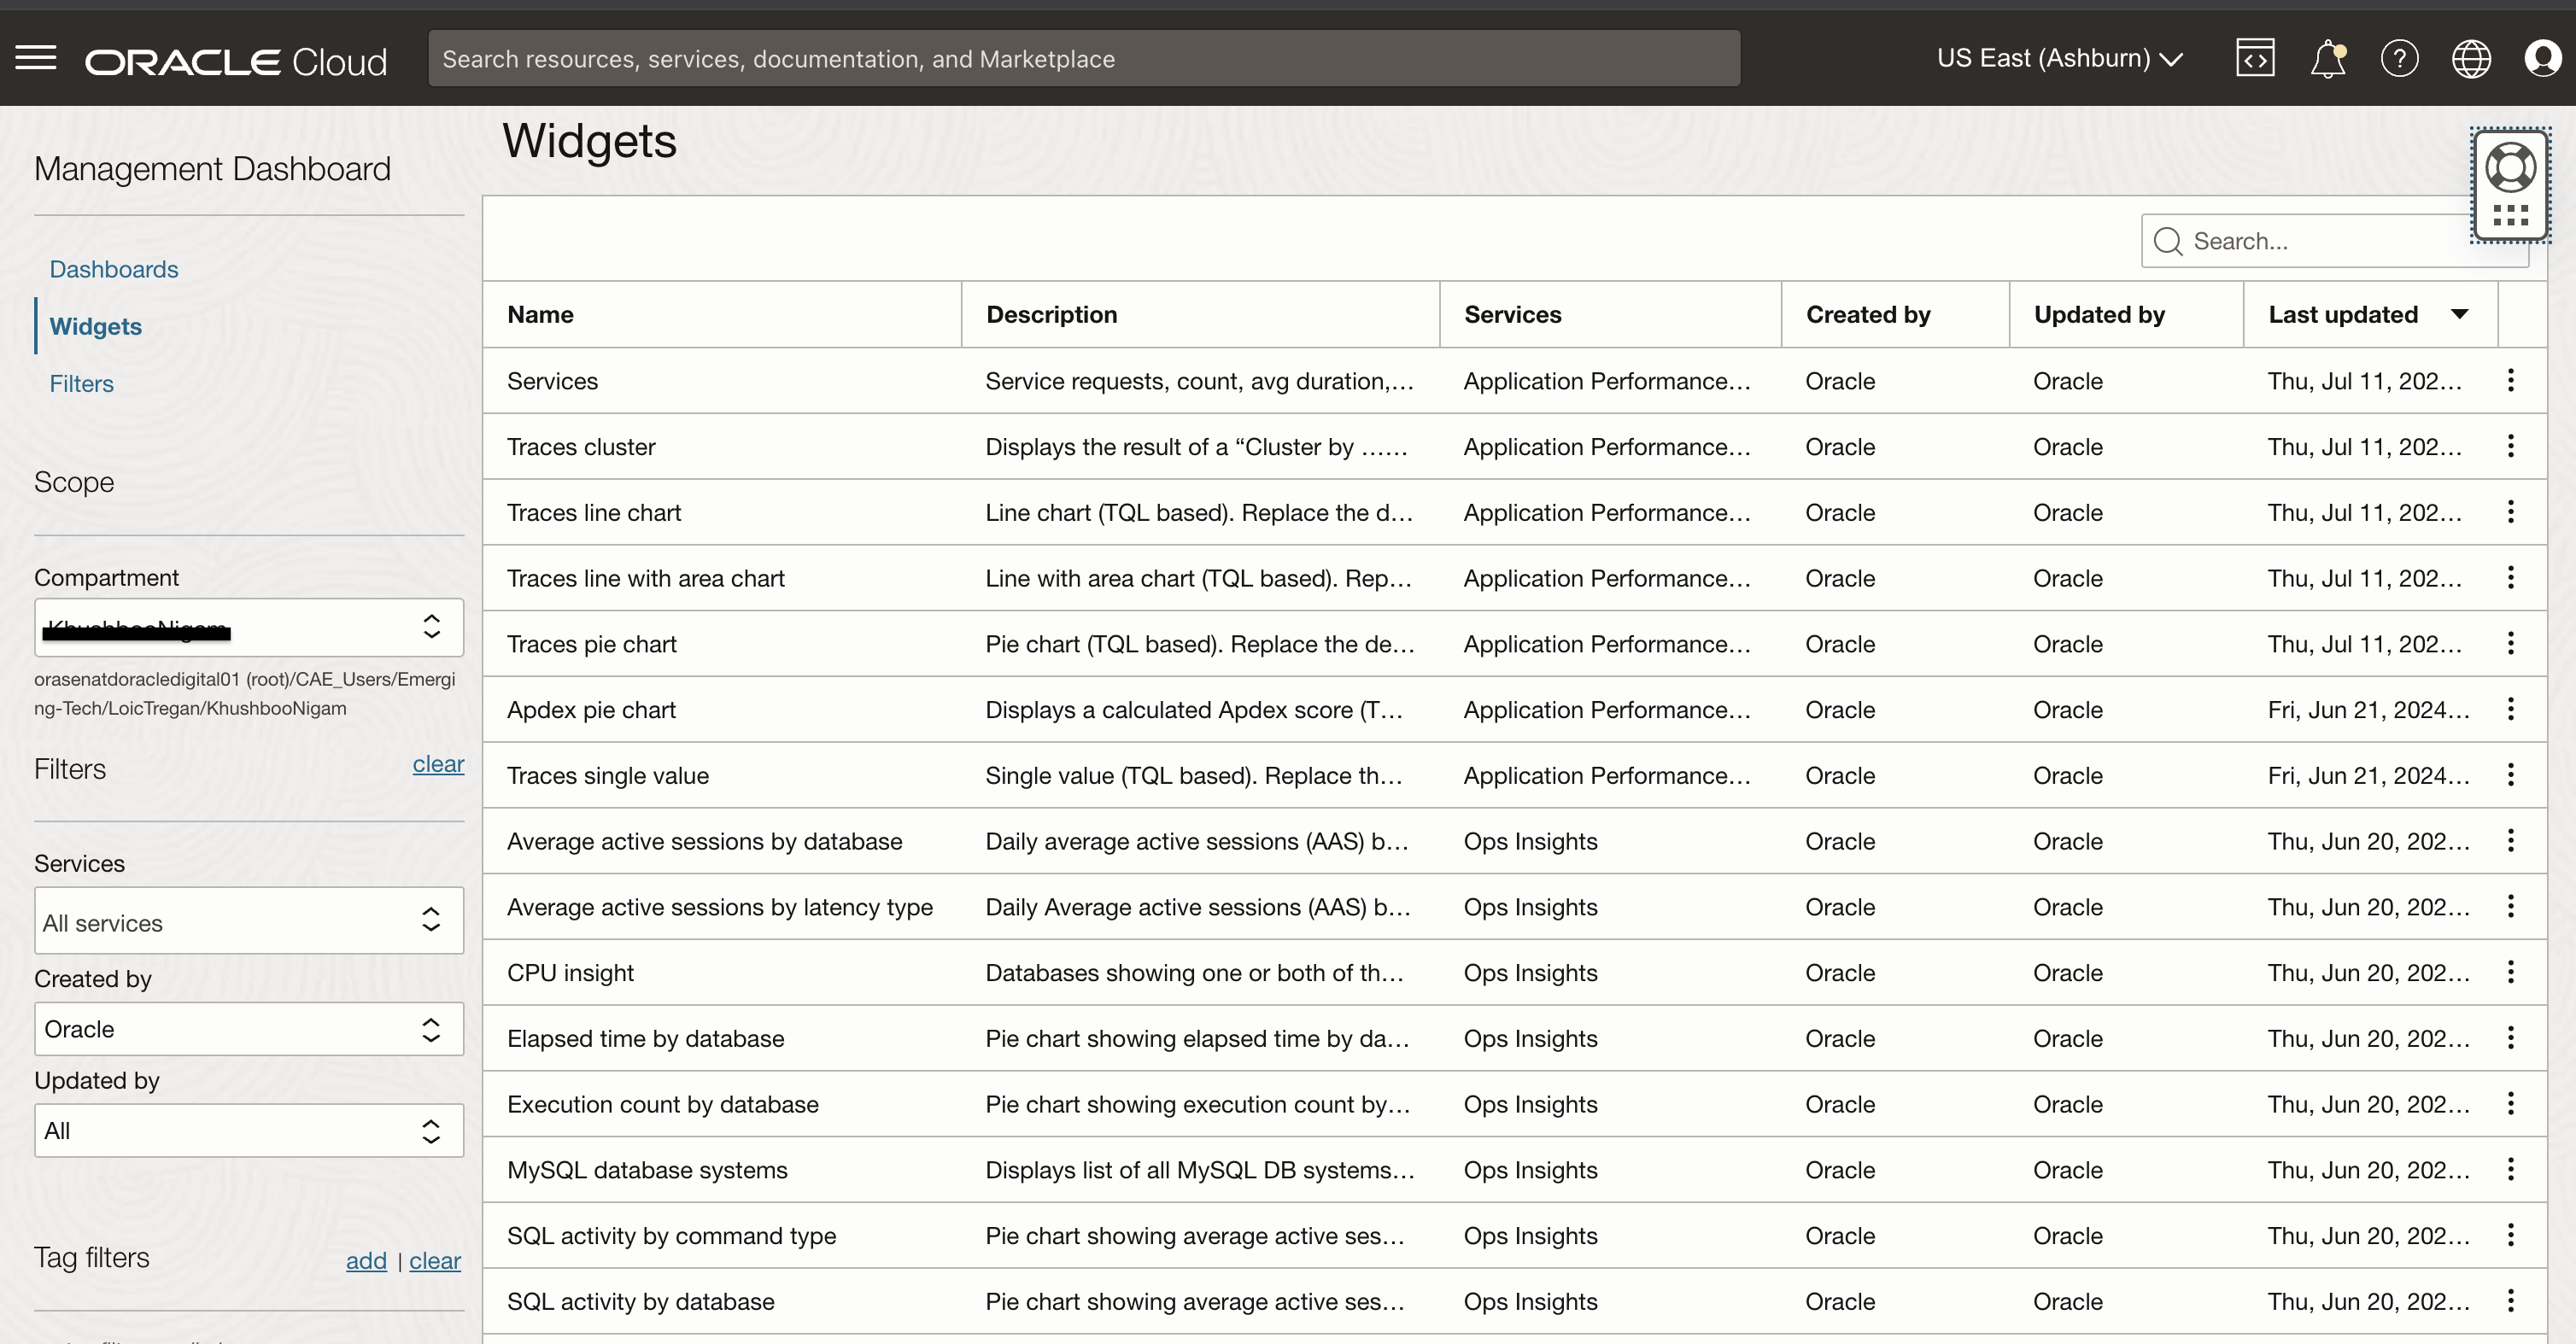
Here are a few examples of how the pre-defined widgets can represent data.
The image below shows widgets available for Logging Analytics service. These 2 widgets focuses on the packet rate per hour captured for different subnets identified by their OCIDs and the amount flow logs generated by different VNICS. These widgets are a good addition to a dashboard focusing on network monitoring.

New widgets can be created on 3 basis:
- Metric Data Explorer Widget: Metrics collected in OCI Monitoring service can be added to a dashboard. You can create a widget using out of the box metrics and it is possible to choose dimensions such as a particular resource id, chart type, intervals, Y axis title, chart title and a legend to tailor metric data widget as per your requirement.
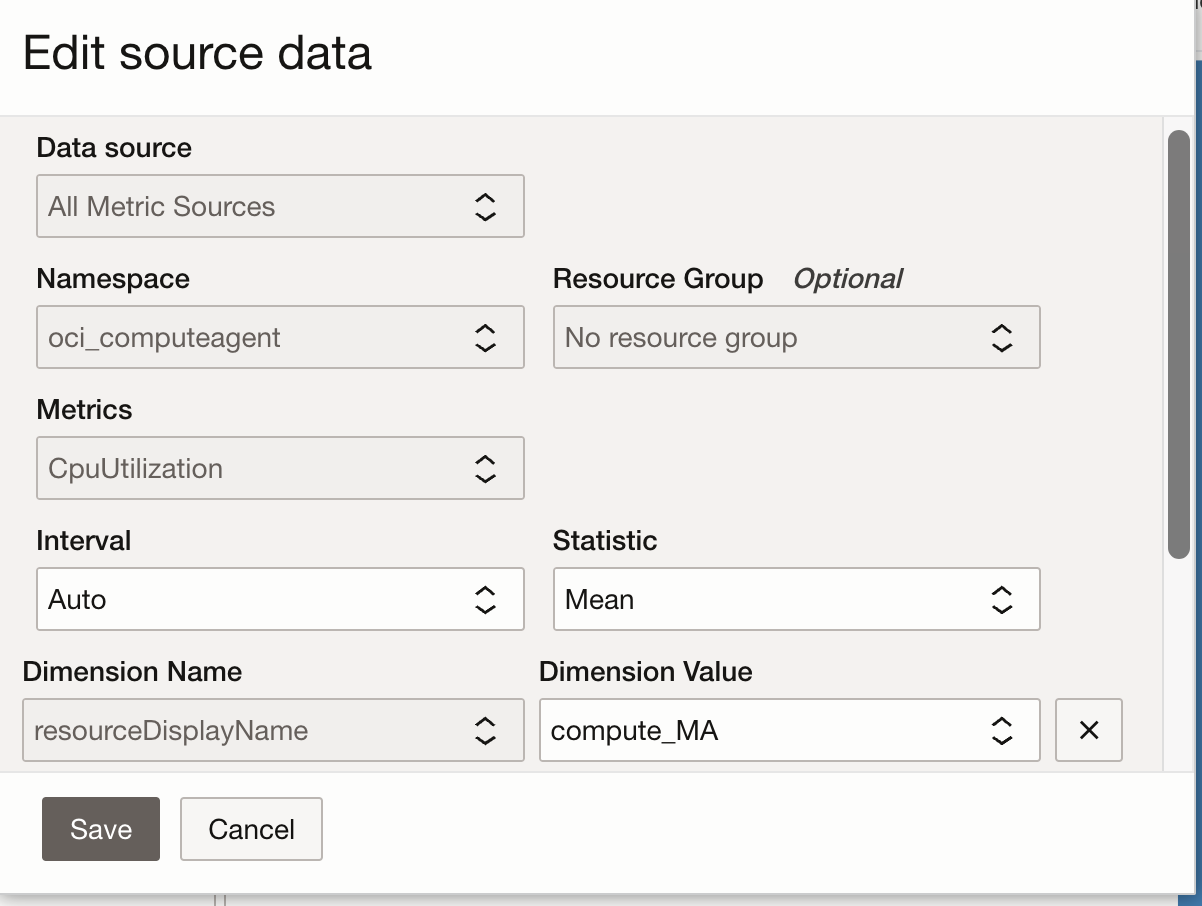
The image below shows a widget created by adding out of the box compute instance metrics. Data section shows the metrics CPUUtilzation and MemoryUtilization aavailable to be dded to this widget. These can be individually customized as shown in the image above to choose different interval, statistic and a dimension. Visualizaition panel lets you choose chart type, what values to add to the Y axis and it’s title. Also, you can choose to add a legend. Time and Compartment selection are important in order to see relevant metrics data.

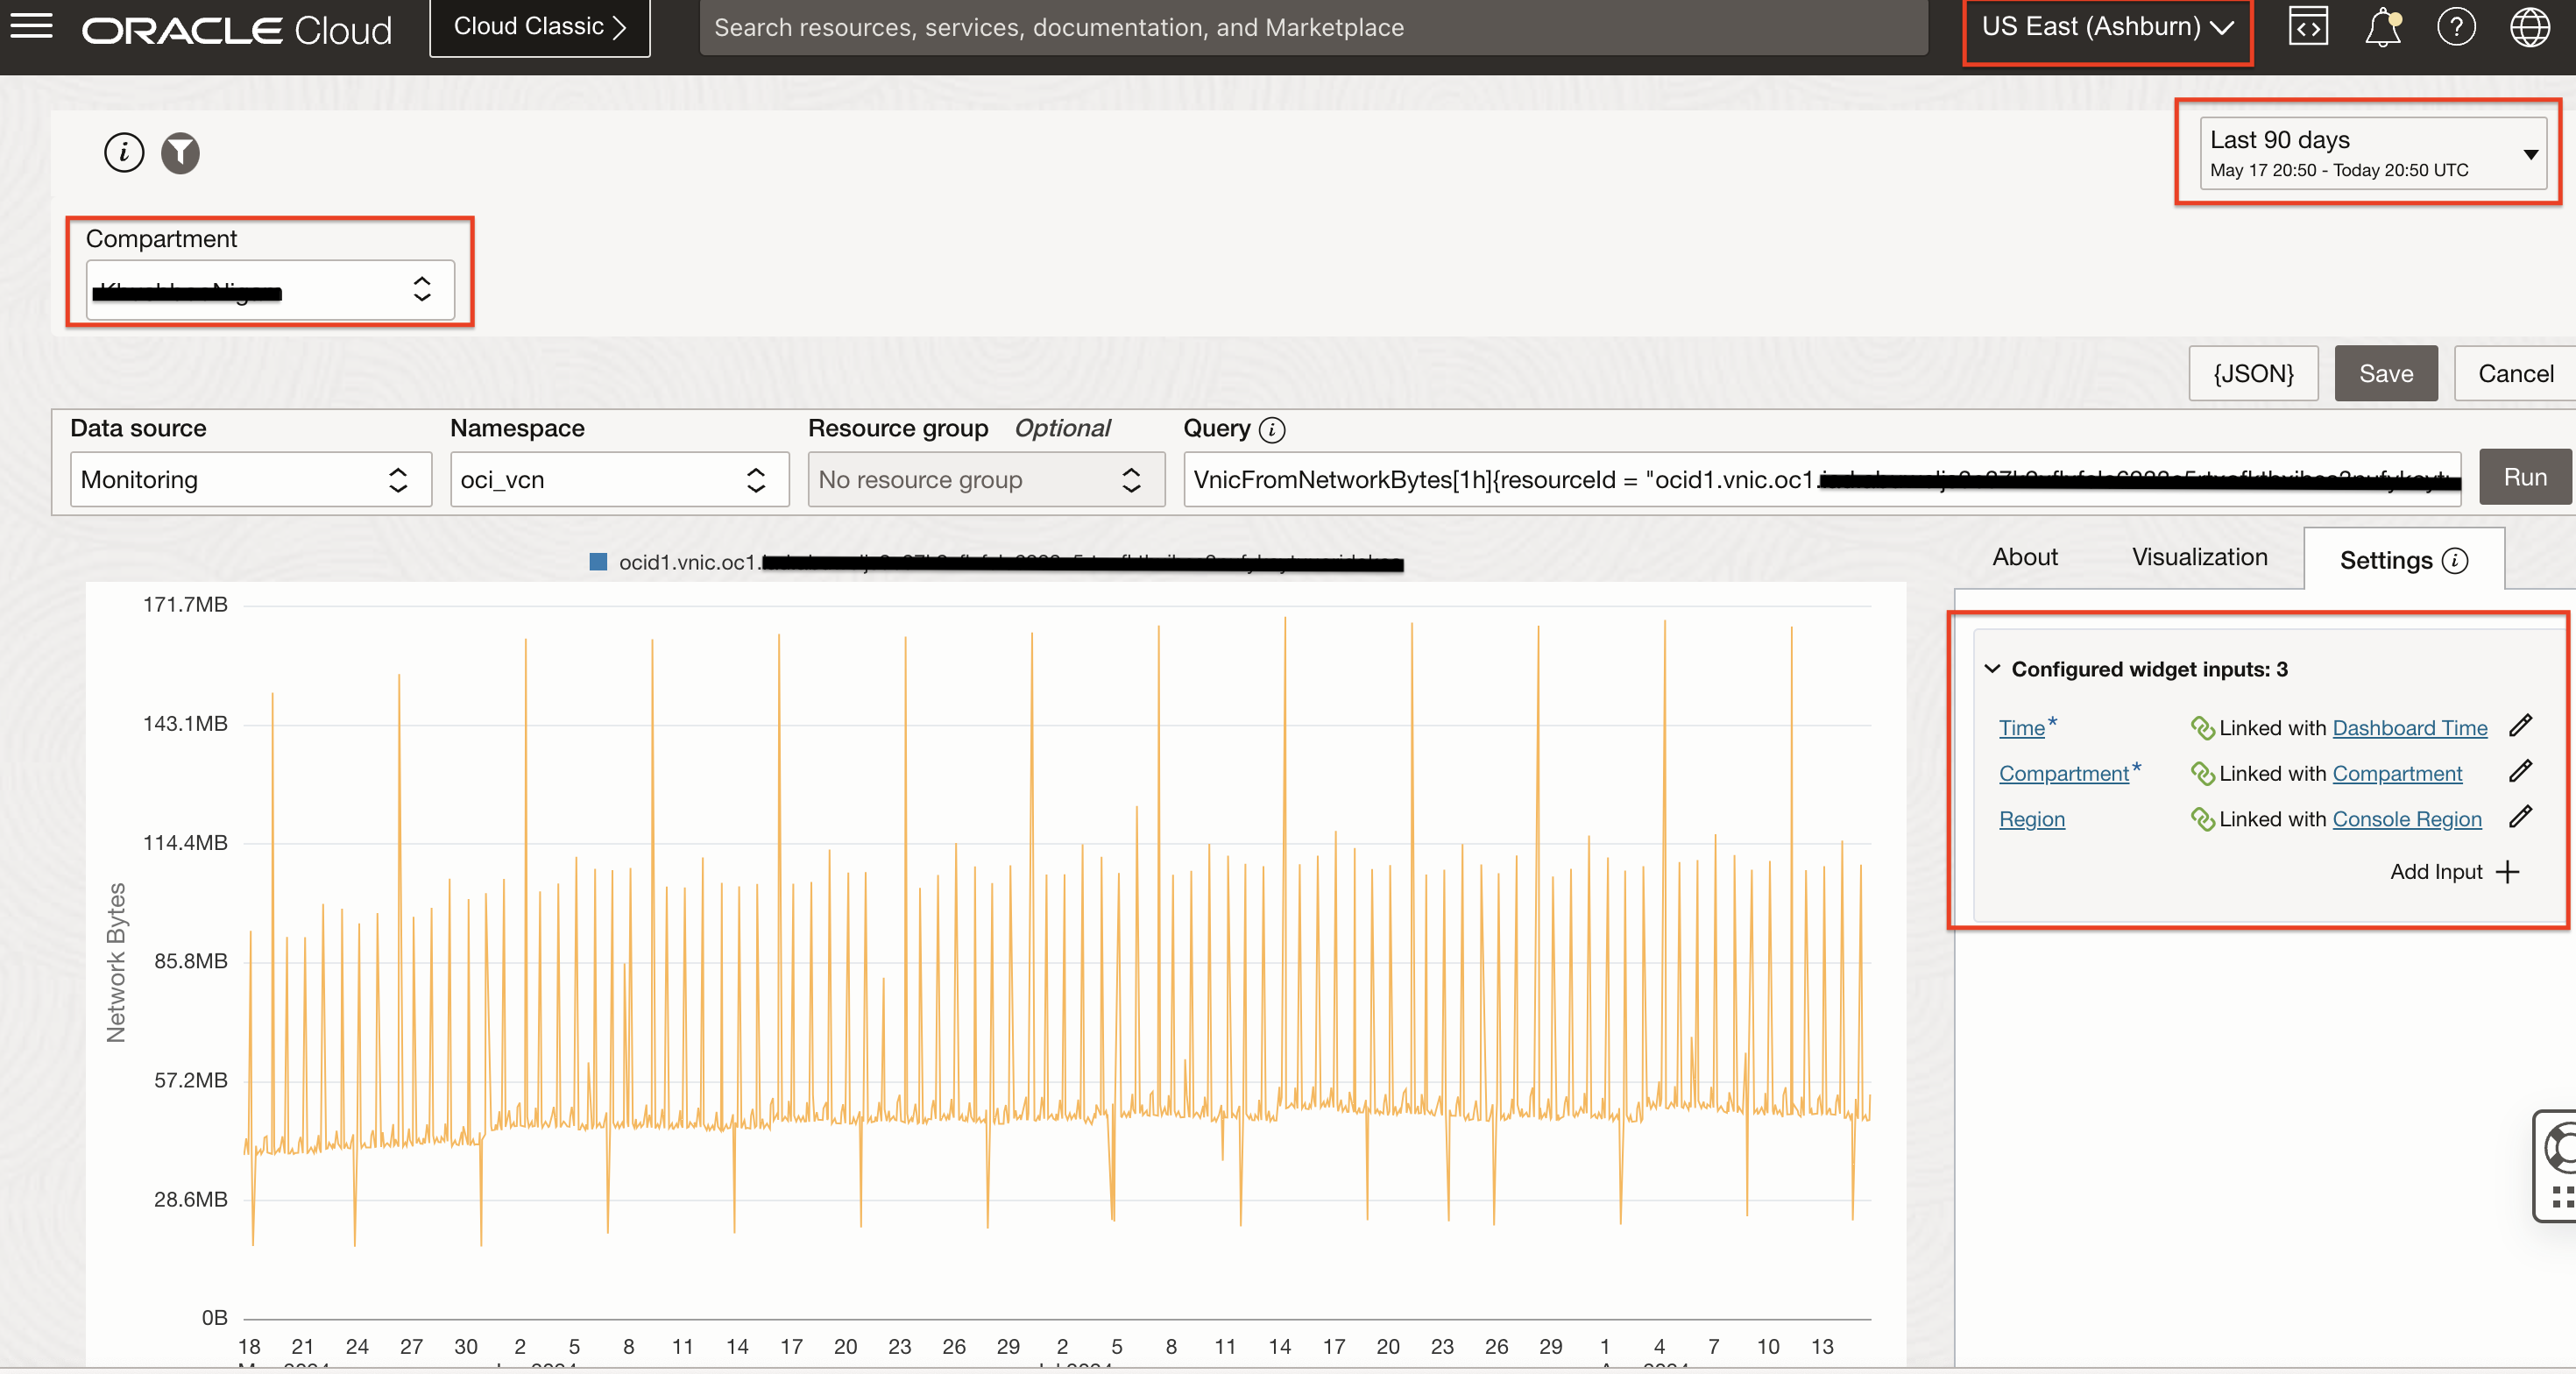
- Query Based Widget using Metrics: This option lets you add the widget based on advanced queries run on metrics (Monitoring Query Language) in the OCI Monitoring service or traces (Trace Explorer Query Language) in the Application Performance Monitoring service. Image below shows example of monitoring query gathering total bytes received at the VNIC from the network after any traffic drop. Here the Query box represents the MQL expression fetching the metric data for a particular VNIC as defined by the “resourceid”. The data is being gathered from VNIC in the specified Compartment.

Visualization panel gives you options to create different charts to represent metric data. Also, this is where you can choose between different values on both the axis, provide a title for Y axis data and choose to have a legend.

The settings panel provide the option to configure widgets which govern the metric data you finally see. Here there are 3 inputs, Time, Compartment and Region and all of these are the default filters available for Management Dashboards.
-
Query-Based Widget using Traces: This option lets you add the widget based on queries run on traces in the Application Performance Monitoring service. Image below shows example of trace query which returns trace status, first span start time of a this trace, service name, exact operation name and trace duration.
Also, APM domain and time are the widget filters here.

Trace Query Based Widget Filters
Filters are an essential feature of management dashboards, allowing users to focus on specific subsets of data and gain more detailed insights. Ready filters provided by the Management Dashboard for Observability & Management services can streamline the process of creating and customizing dashboards, making it easier for users to visualize and analyze the information that matters most to them. As you add filters to the dashboard, an additional input may be required and the additional input is automatically configured to use the corresponding filter. You can also edit the configuration of a filter when adding it to a dashboard.
The image below shows an example of how multiple filters can be added to the same dashboard. Each filter can be connected to multiple widgets added to a dashboard and then the filter selection will govern data shown by the widgets.

Filters in a Dashboard One relevant feature to use when working with Region filter is to make your dashboards populate data from different regions if you have resources spread out in more than one region, hence making your dashboards cross-regional. This can be done by editing Region Filter and allowing multiple selections.
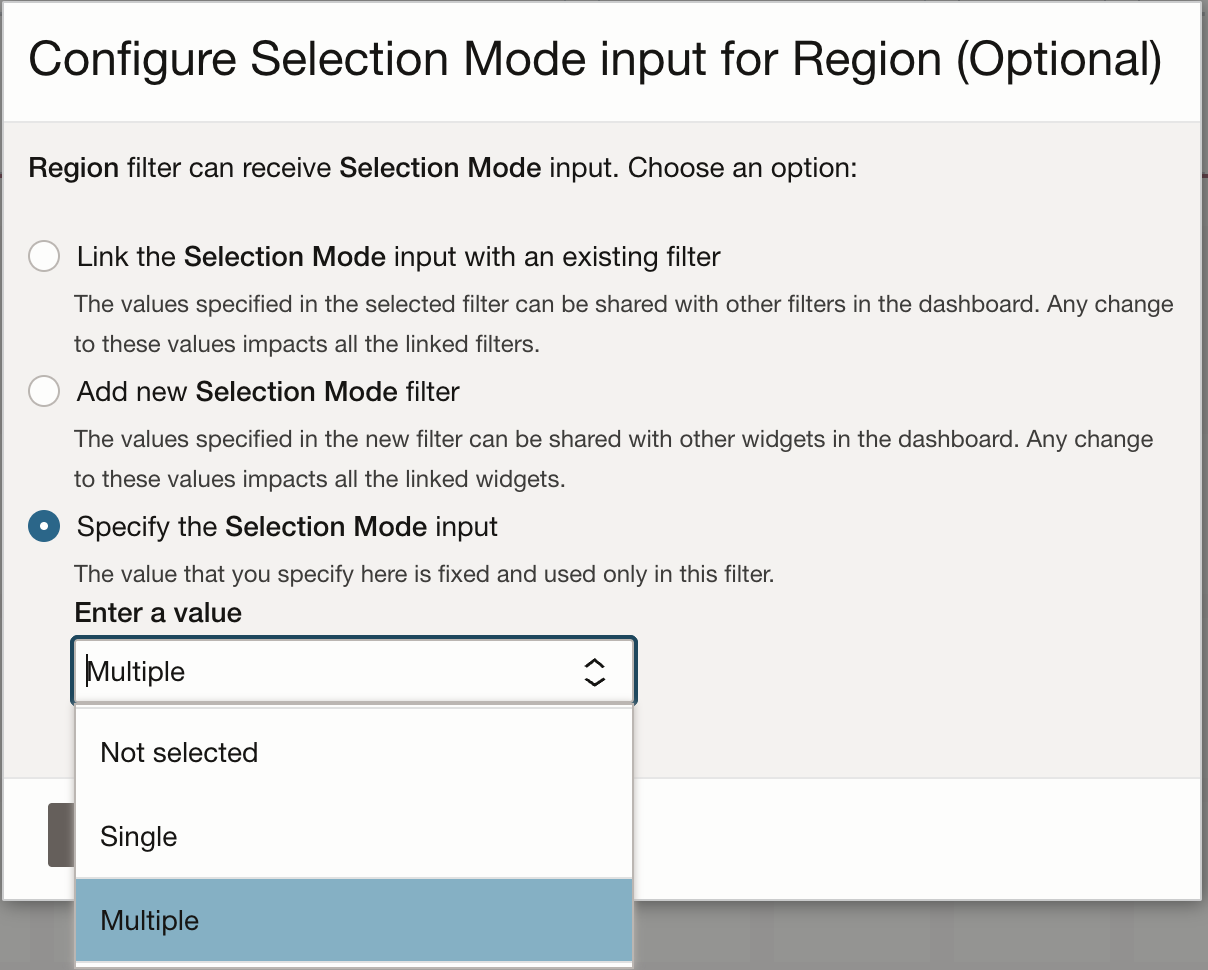
Choosing Multiple Regions Values After adding to a dashboard, this how the Region filter allow you to input multiple values.

Cross-Region Enablement in a Dashboard Management Dashboards Use-Case
One of our popular implementation of Management Dashboards are Security Fundamentals Dashboards. These custom dashboards cater to three essential domains that form the cornerstone of a strong security posture: Identity, Network, and Security Operations and are built using Logging Analytics capbilities to search through Audit and Flow Logs. These dashboards leverage adding both custom searches as well as metrics for holistic reporting.
Console Dashboards
Oracle Cloud Infrastructure (OCI) Console Dashboards offer a powerful and intuitive way to monitor, manage, and optimize your cloud infrastructure. With OCI Console Dashboards, you can easily customize your view to align with your specific needs. Whether you’re an administrator, developer, or business user, you have the flexibility to create tailored dashboards that present the most relevant information at a glance. From monitoring resource utilization and performance metrics to tracking costs and managing security, these dashboards are a one-stop solution for efficient cloud management.
Accessing Console Dashboards in OCI Console
Once you login to your tenancy, the first time you visit the Dashboard tab, you’re presented with a default dashboard and sample widgets that contain instructions for getting started with widgets. If you have already created a dashboard before then you wil see the most recently visited dashboard. If you click on the “Manage Dashboards” option you will see an overview page displaying all the available templates and recently updated dashboards. From here, you can create a new dashboard either from scratch or by using an Oracle provided Template.
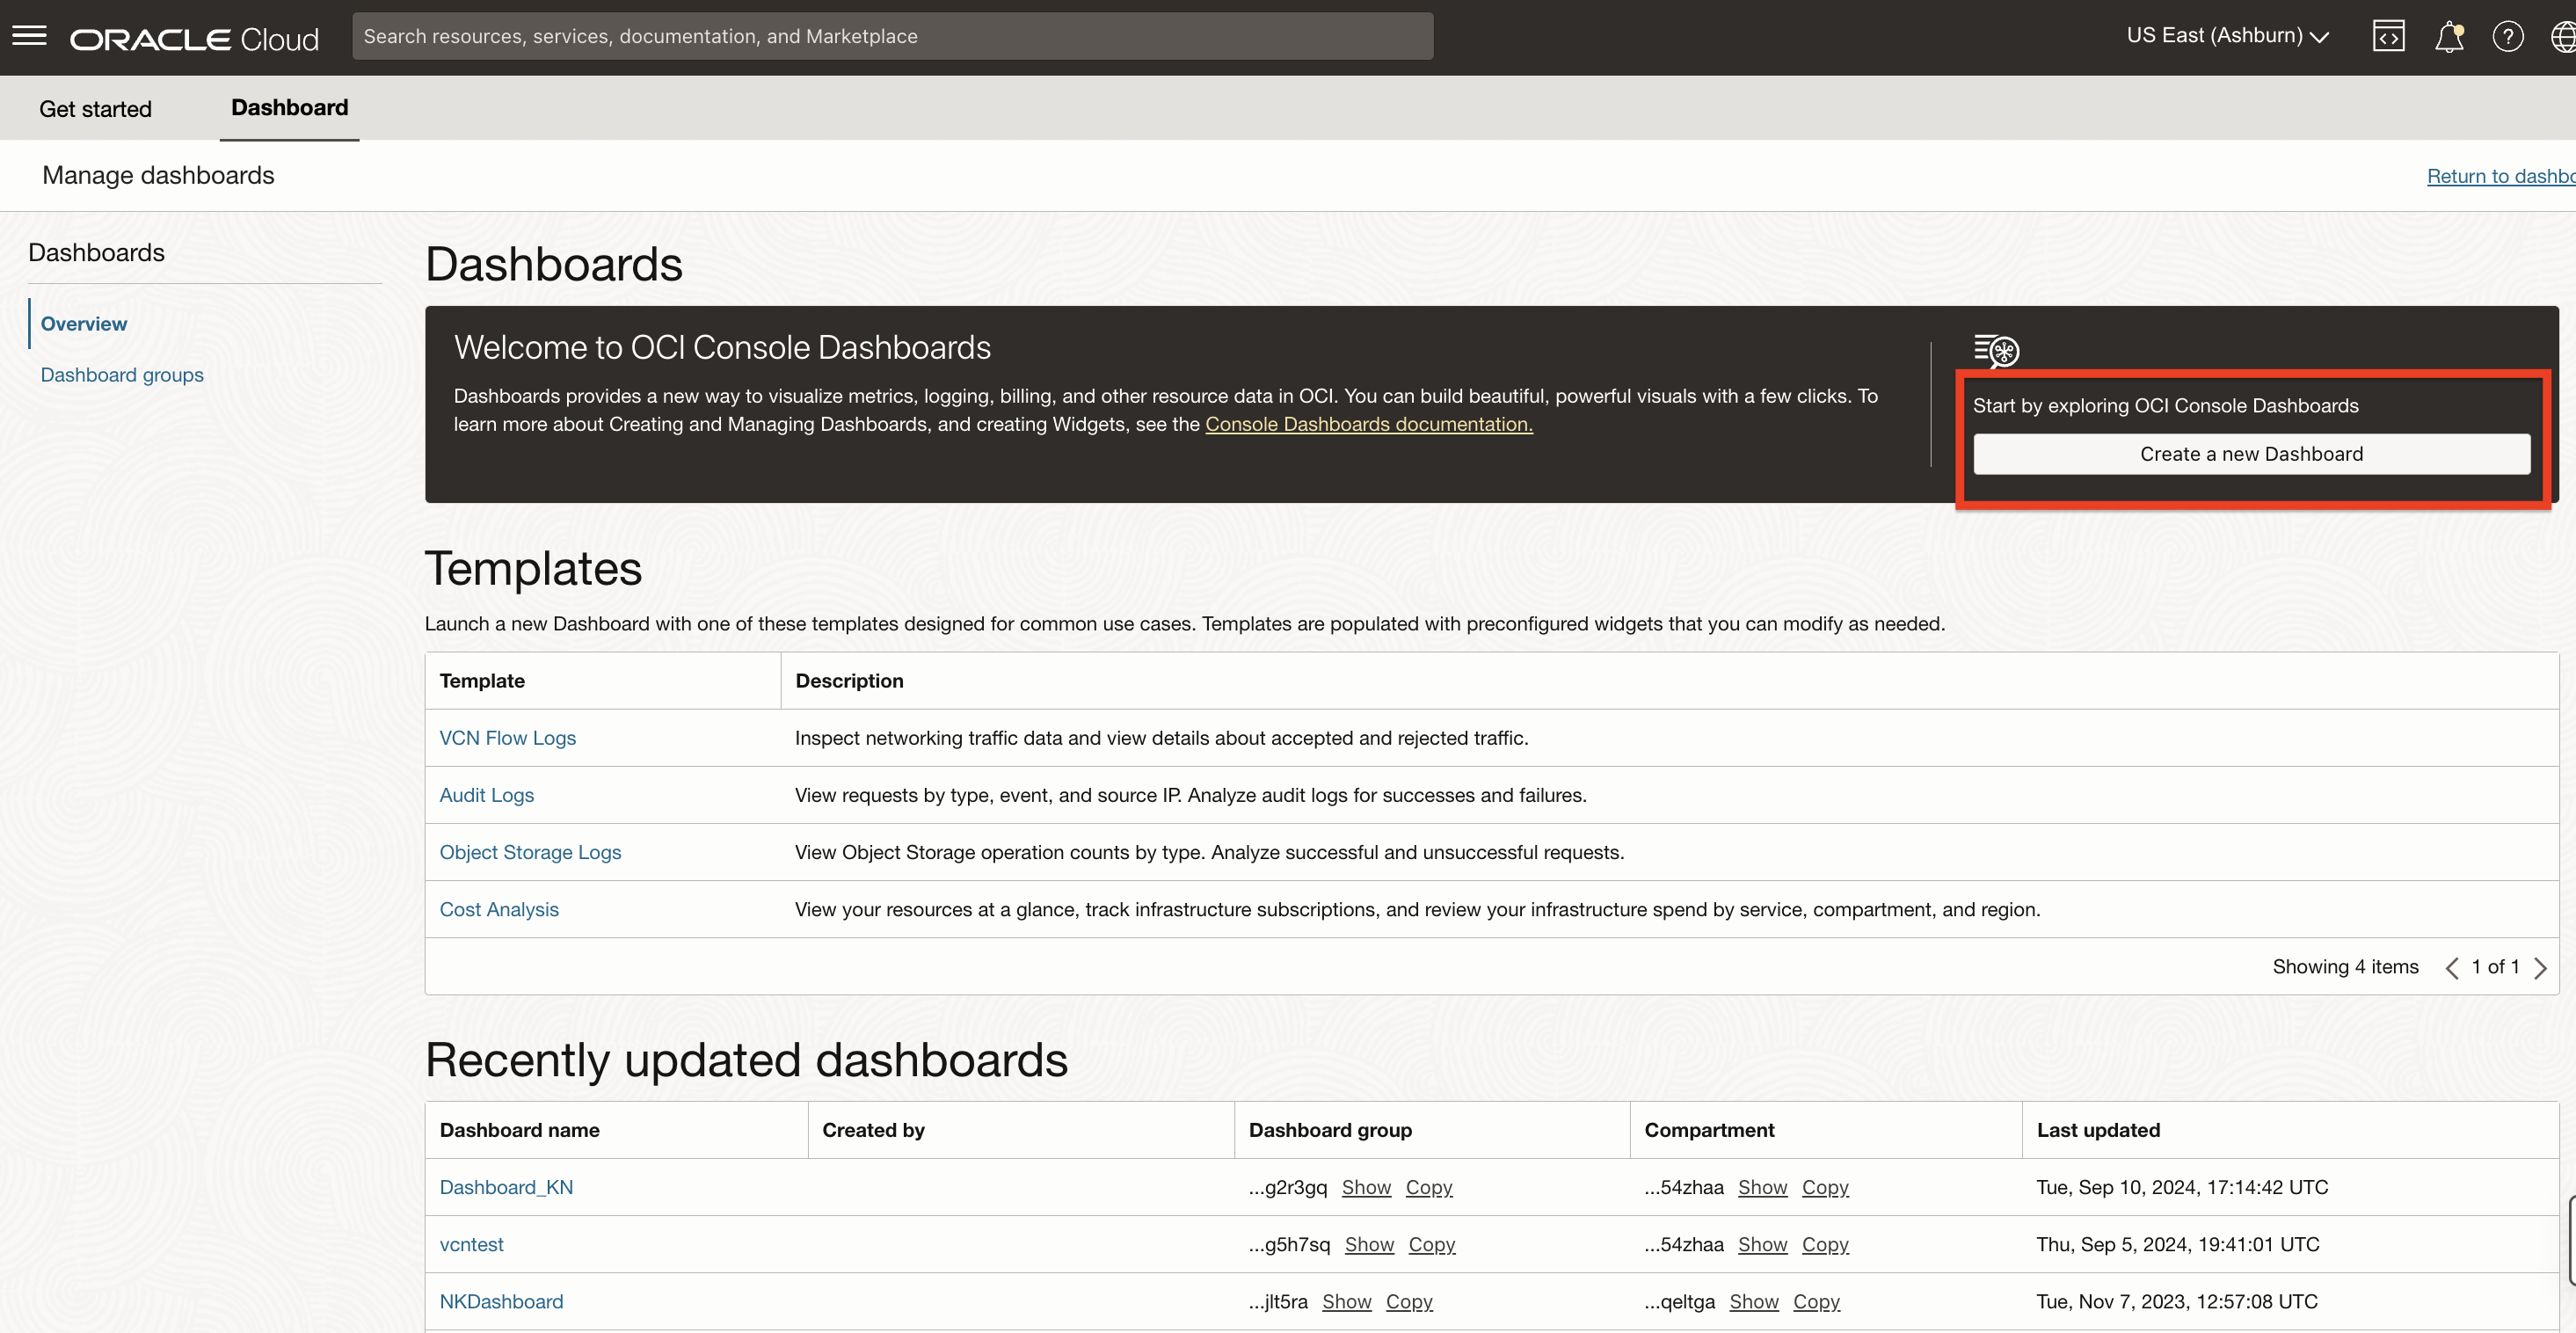
Access Console Dashboard
Templates can be used to quickly create a dashboard for some sample use-cases. The image below shows VCN Flow Logs template based dashboard.
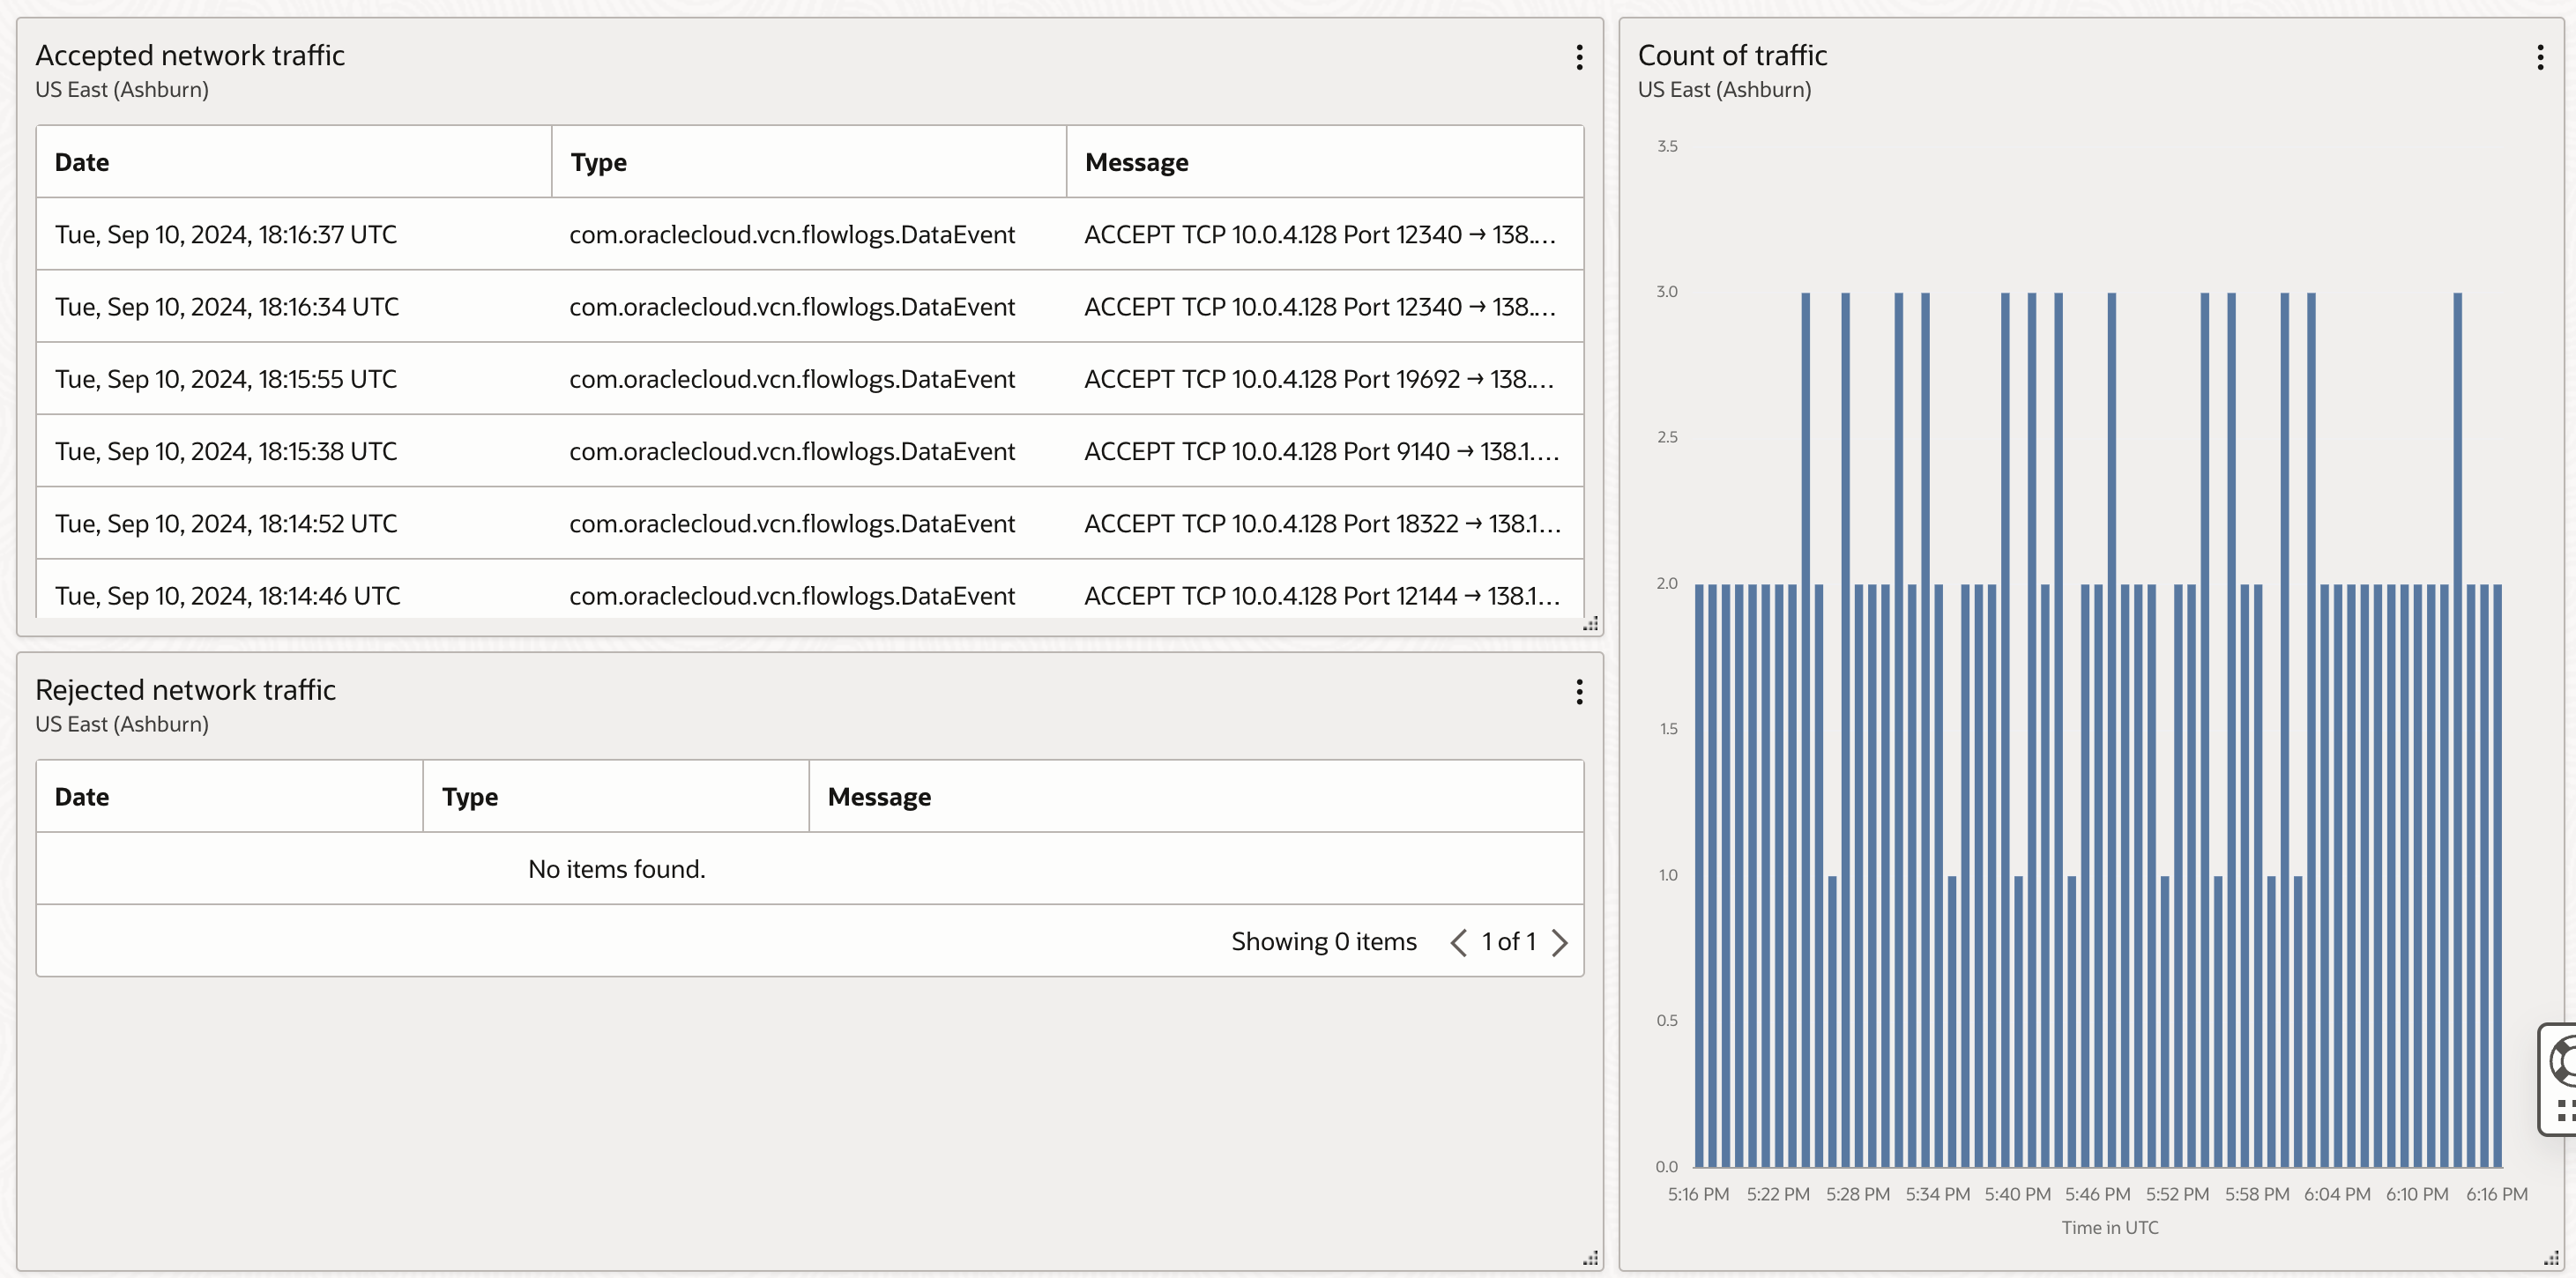
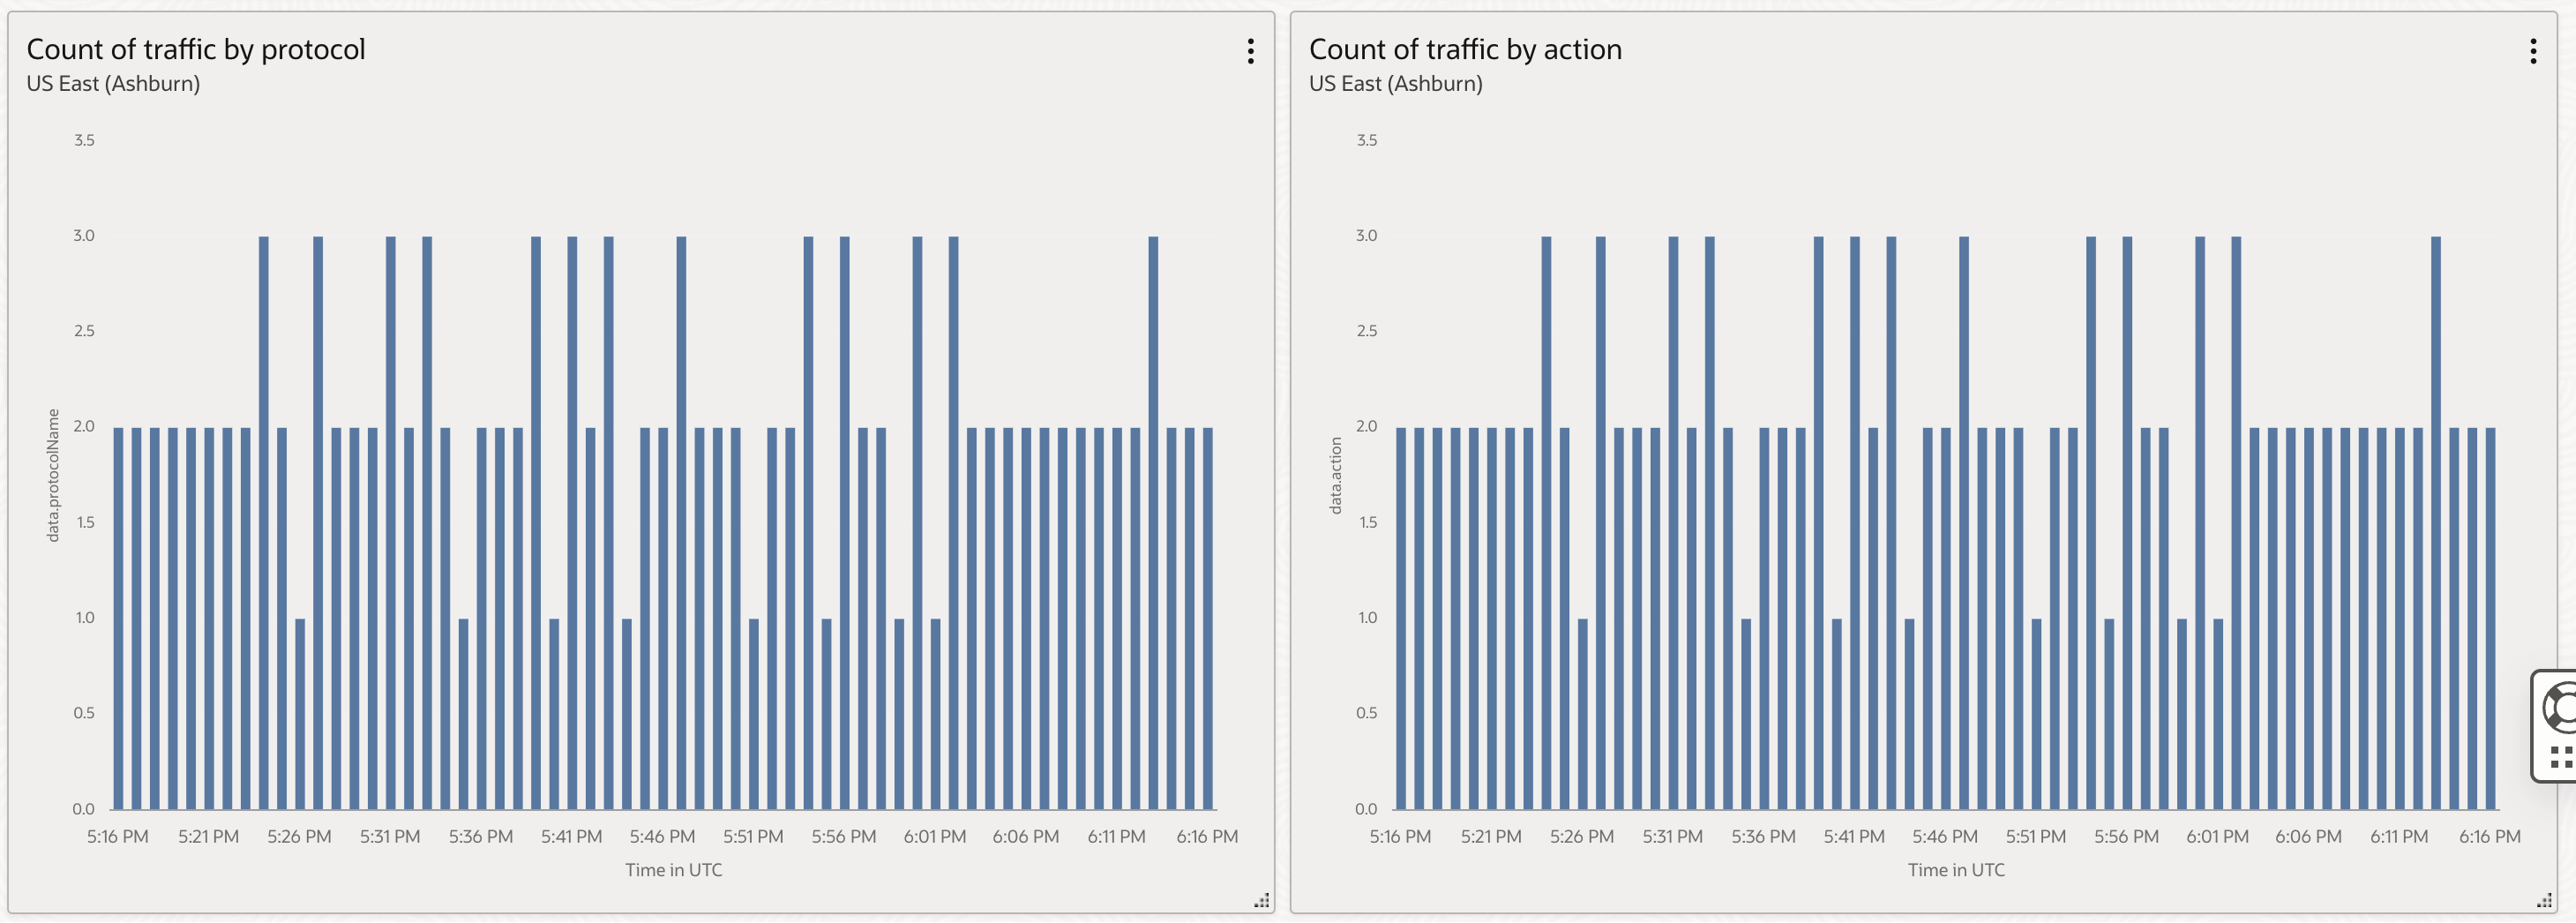
VCN Flow Logs Dashboard It is worth noting that each widget in this dashboard is based on a search that is done within the foundational Oracle Cloud Infrastructure Logging service which is part of the observability & Management platform. The search is performed on the VCN Flow Logs enabled on VCNs. You can expand on any of these widgets and take a look at the detailed search in the OCI Logging service as shown in the image below.
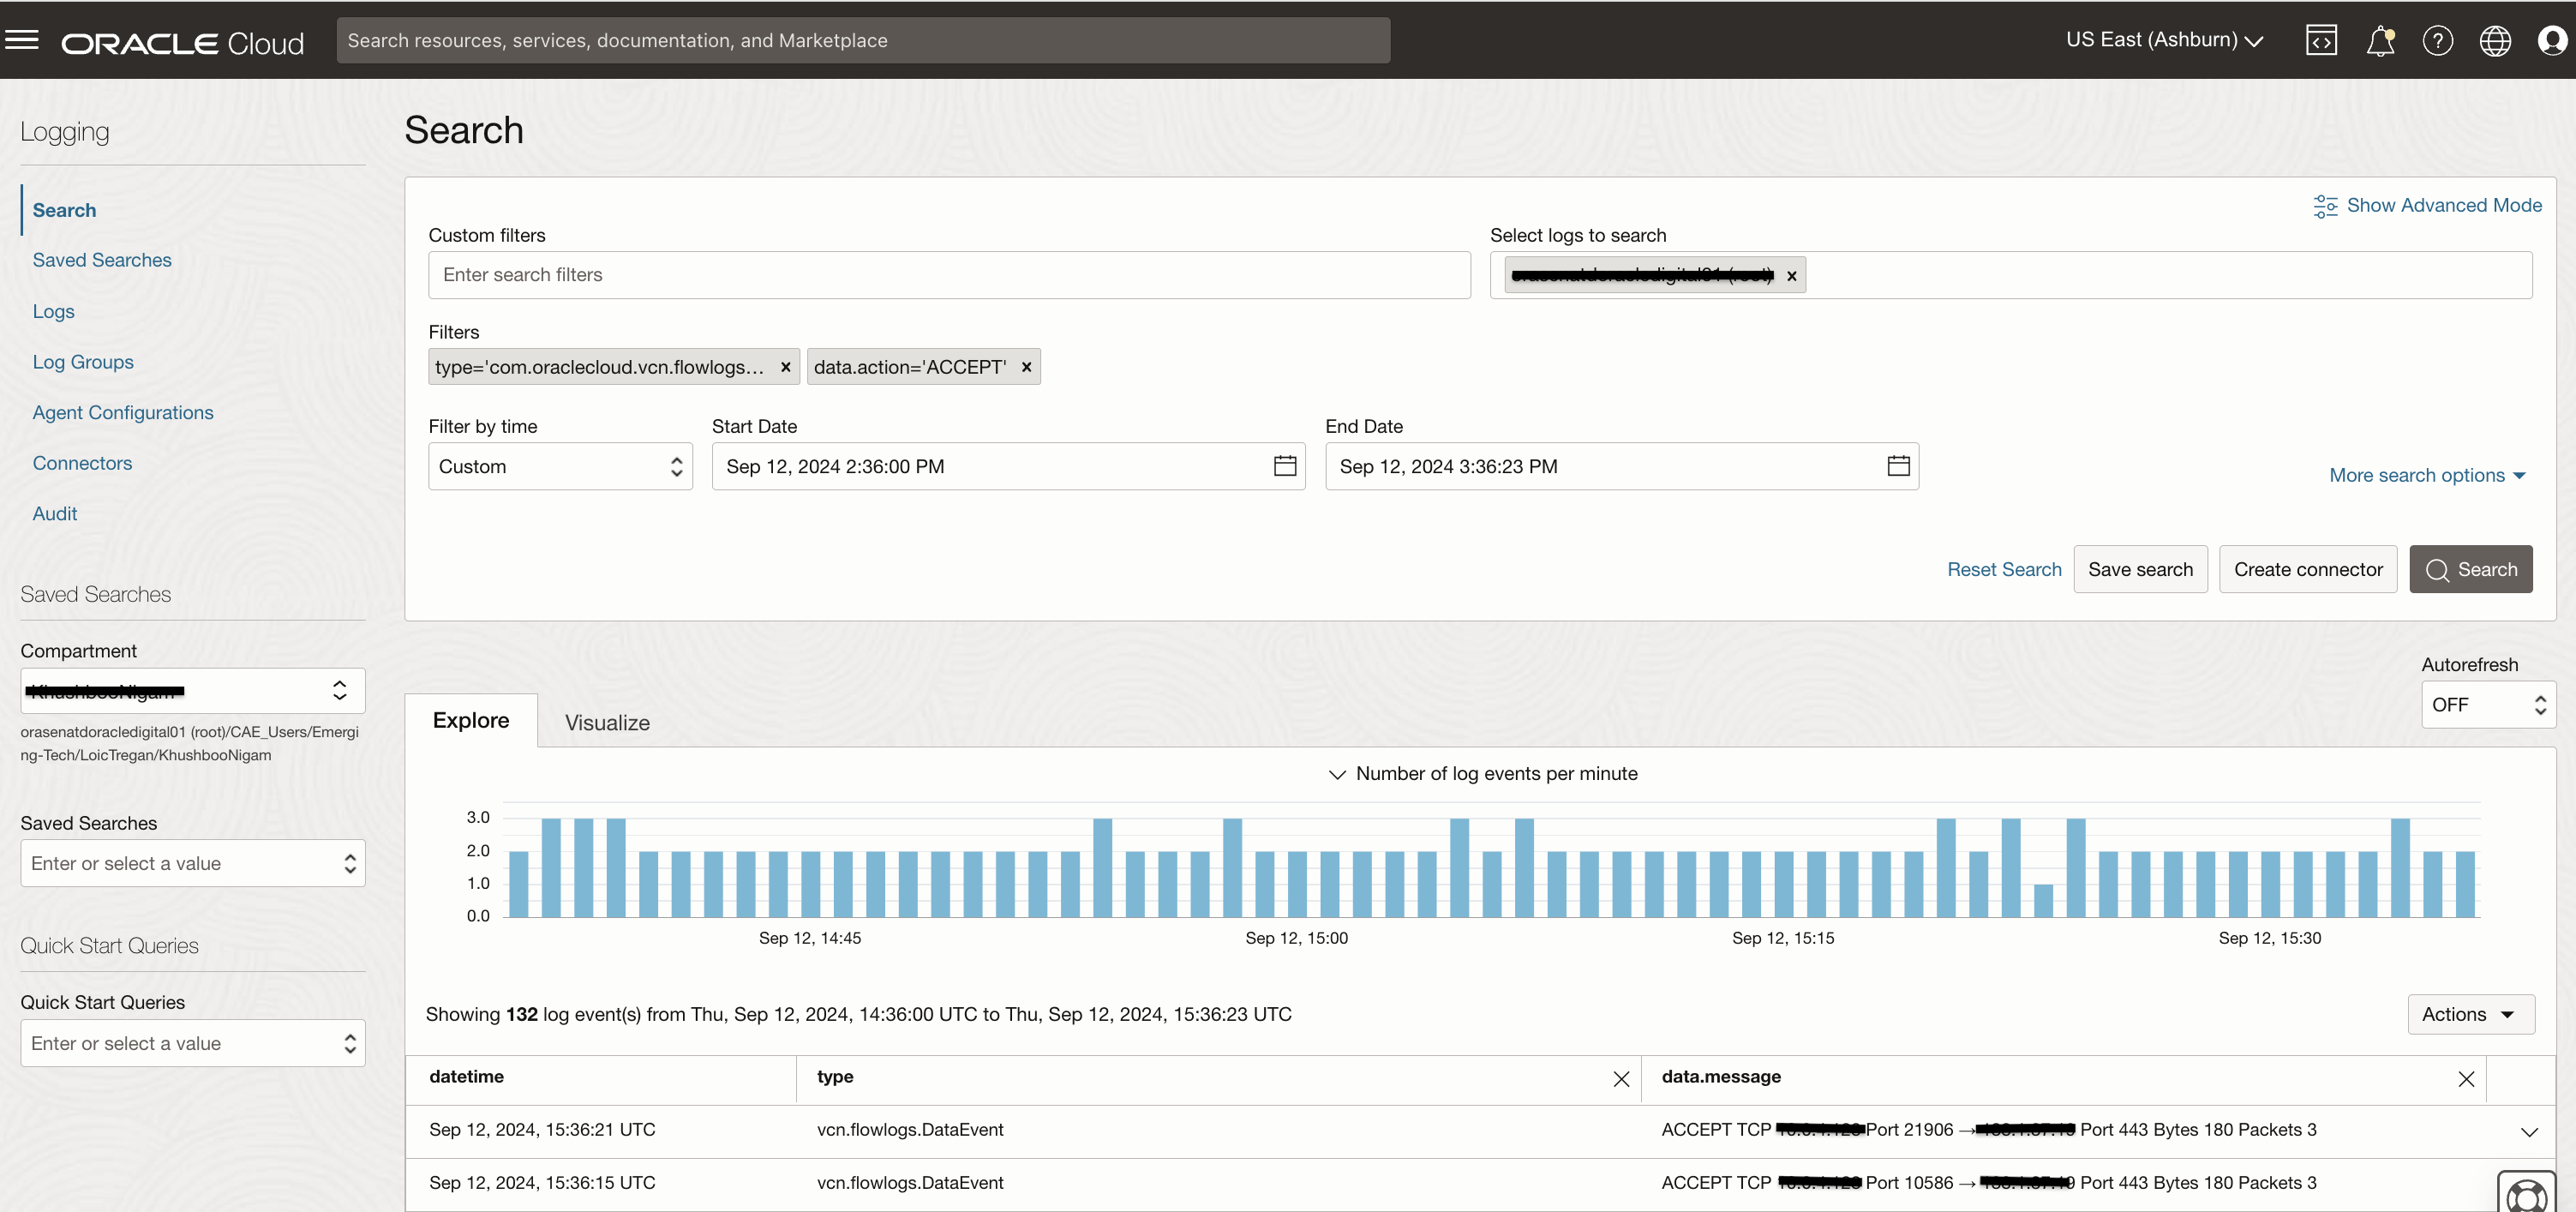
Accept Traffic Widget Expansion in OCI Logging In order to share a console dashboard with other users, you have to work with IAM policies so that a certain group of users can get access to it. You can also share the URL to the dashboard with these users as well.
Widgets
If you decide to create a dashboard from scratch then you can leverage a variety of widgets that can display information about inventory, usage, billing, alerts, outages, and more. Following are the widgets offered by the console dashboards:
- Infrastructure Billing Widget: This widget shows current billing cycle information. You can only include a single instance of the infrastructure billing widget in your dashboard.
- Cost Management Widget: This widget helps you track and optimize your Oracle Cloud Infrastructure spending by generating charts with aggregated Cost Analysis data. You can include multiple cost management widgets in your dashboard.
- Logging Chart Widget: This widget allows you to create visualizations with data from the Oracle Cloud Infrastructure Logging service which is a foundational Observability & Management service. You can include multiple logging chart widgets in your dashboard.
- Logging Data Table Widget: This widget allows you to display a table of the data stored in the Oracle Cloud Infrastructure Logging service. You can include multiple logging data table widgets in your dashboard.
- Markdown Widget: This widget lets you add and format text-based content. You can include multiple markdown widgets in your dashboard.
- Monitoring Widget: This widget lets you view and compare metrics from the Oracle Cloud Infrastructure Monitoring service which is a foundational Observability & Management platform service. You can include multiple monitoring widgets in your dashboard.
- Resource Explorer Widget: This widget allows you to view resources by compartment. You can only include a single instance of the resource explorer widget in your dashboard.
- Resource Query Widget: This widget allows you to use queries to get detailed information about specific resources. You can filter by region, compartment, resource type, or write an advanced query using Search Language Syntax.
The image below shows how the widgets appear in the console.
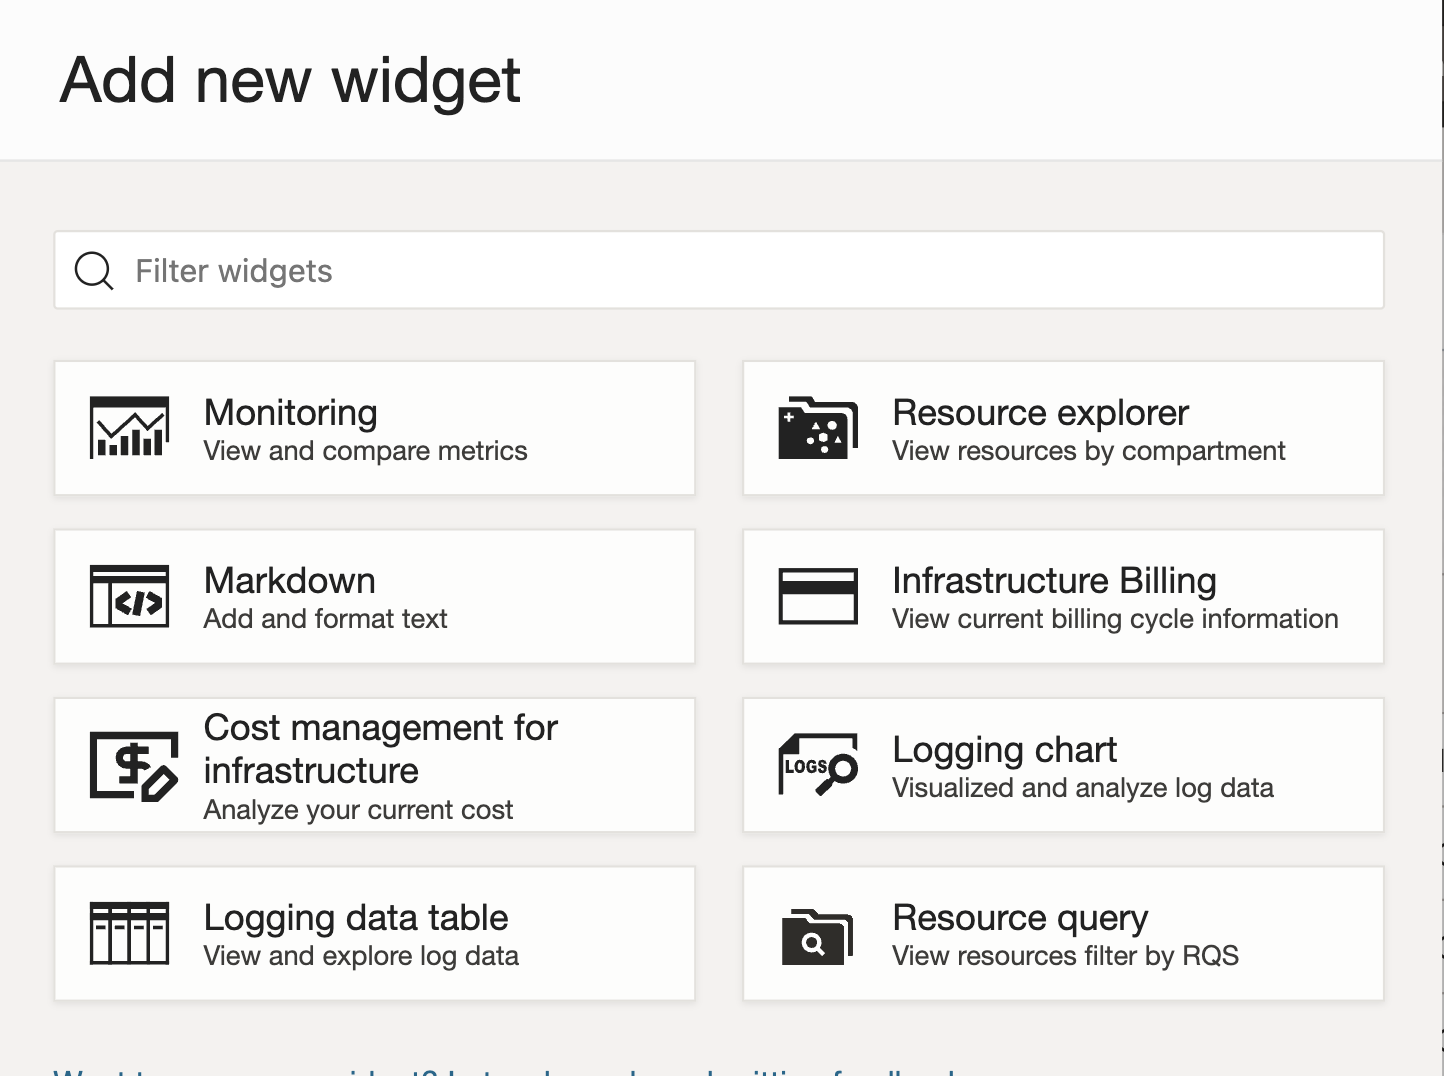
Widgets for a Console Dashboard Following images show how to configure monitoring widget which leverages OCI Monitoring Service which is a foundational service offering on Observability & Management platform. This widget is configured to show mean CPU utilization of compute instances residing in a compartment. It is possible to focus on only selected compute resources by adding dimension values.
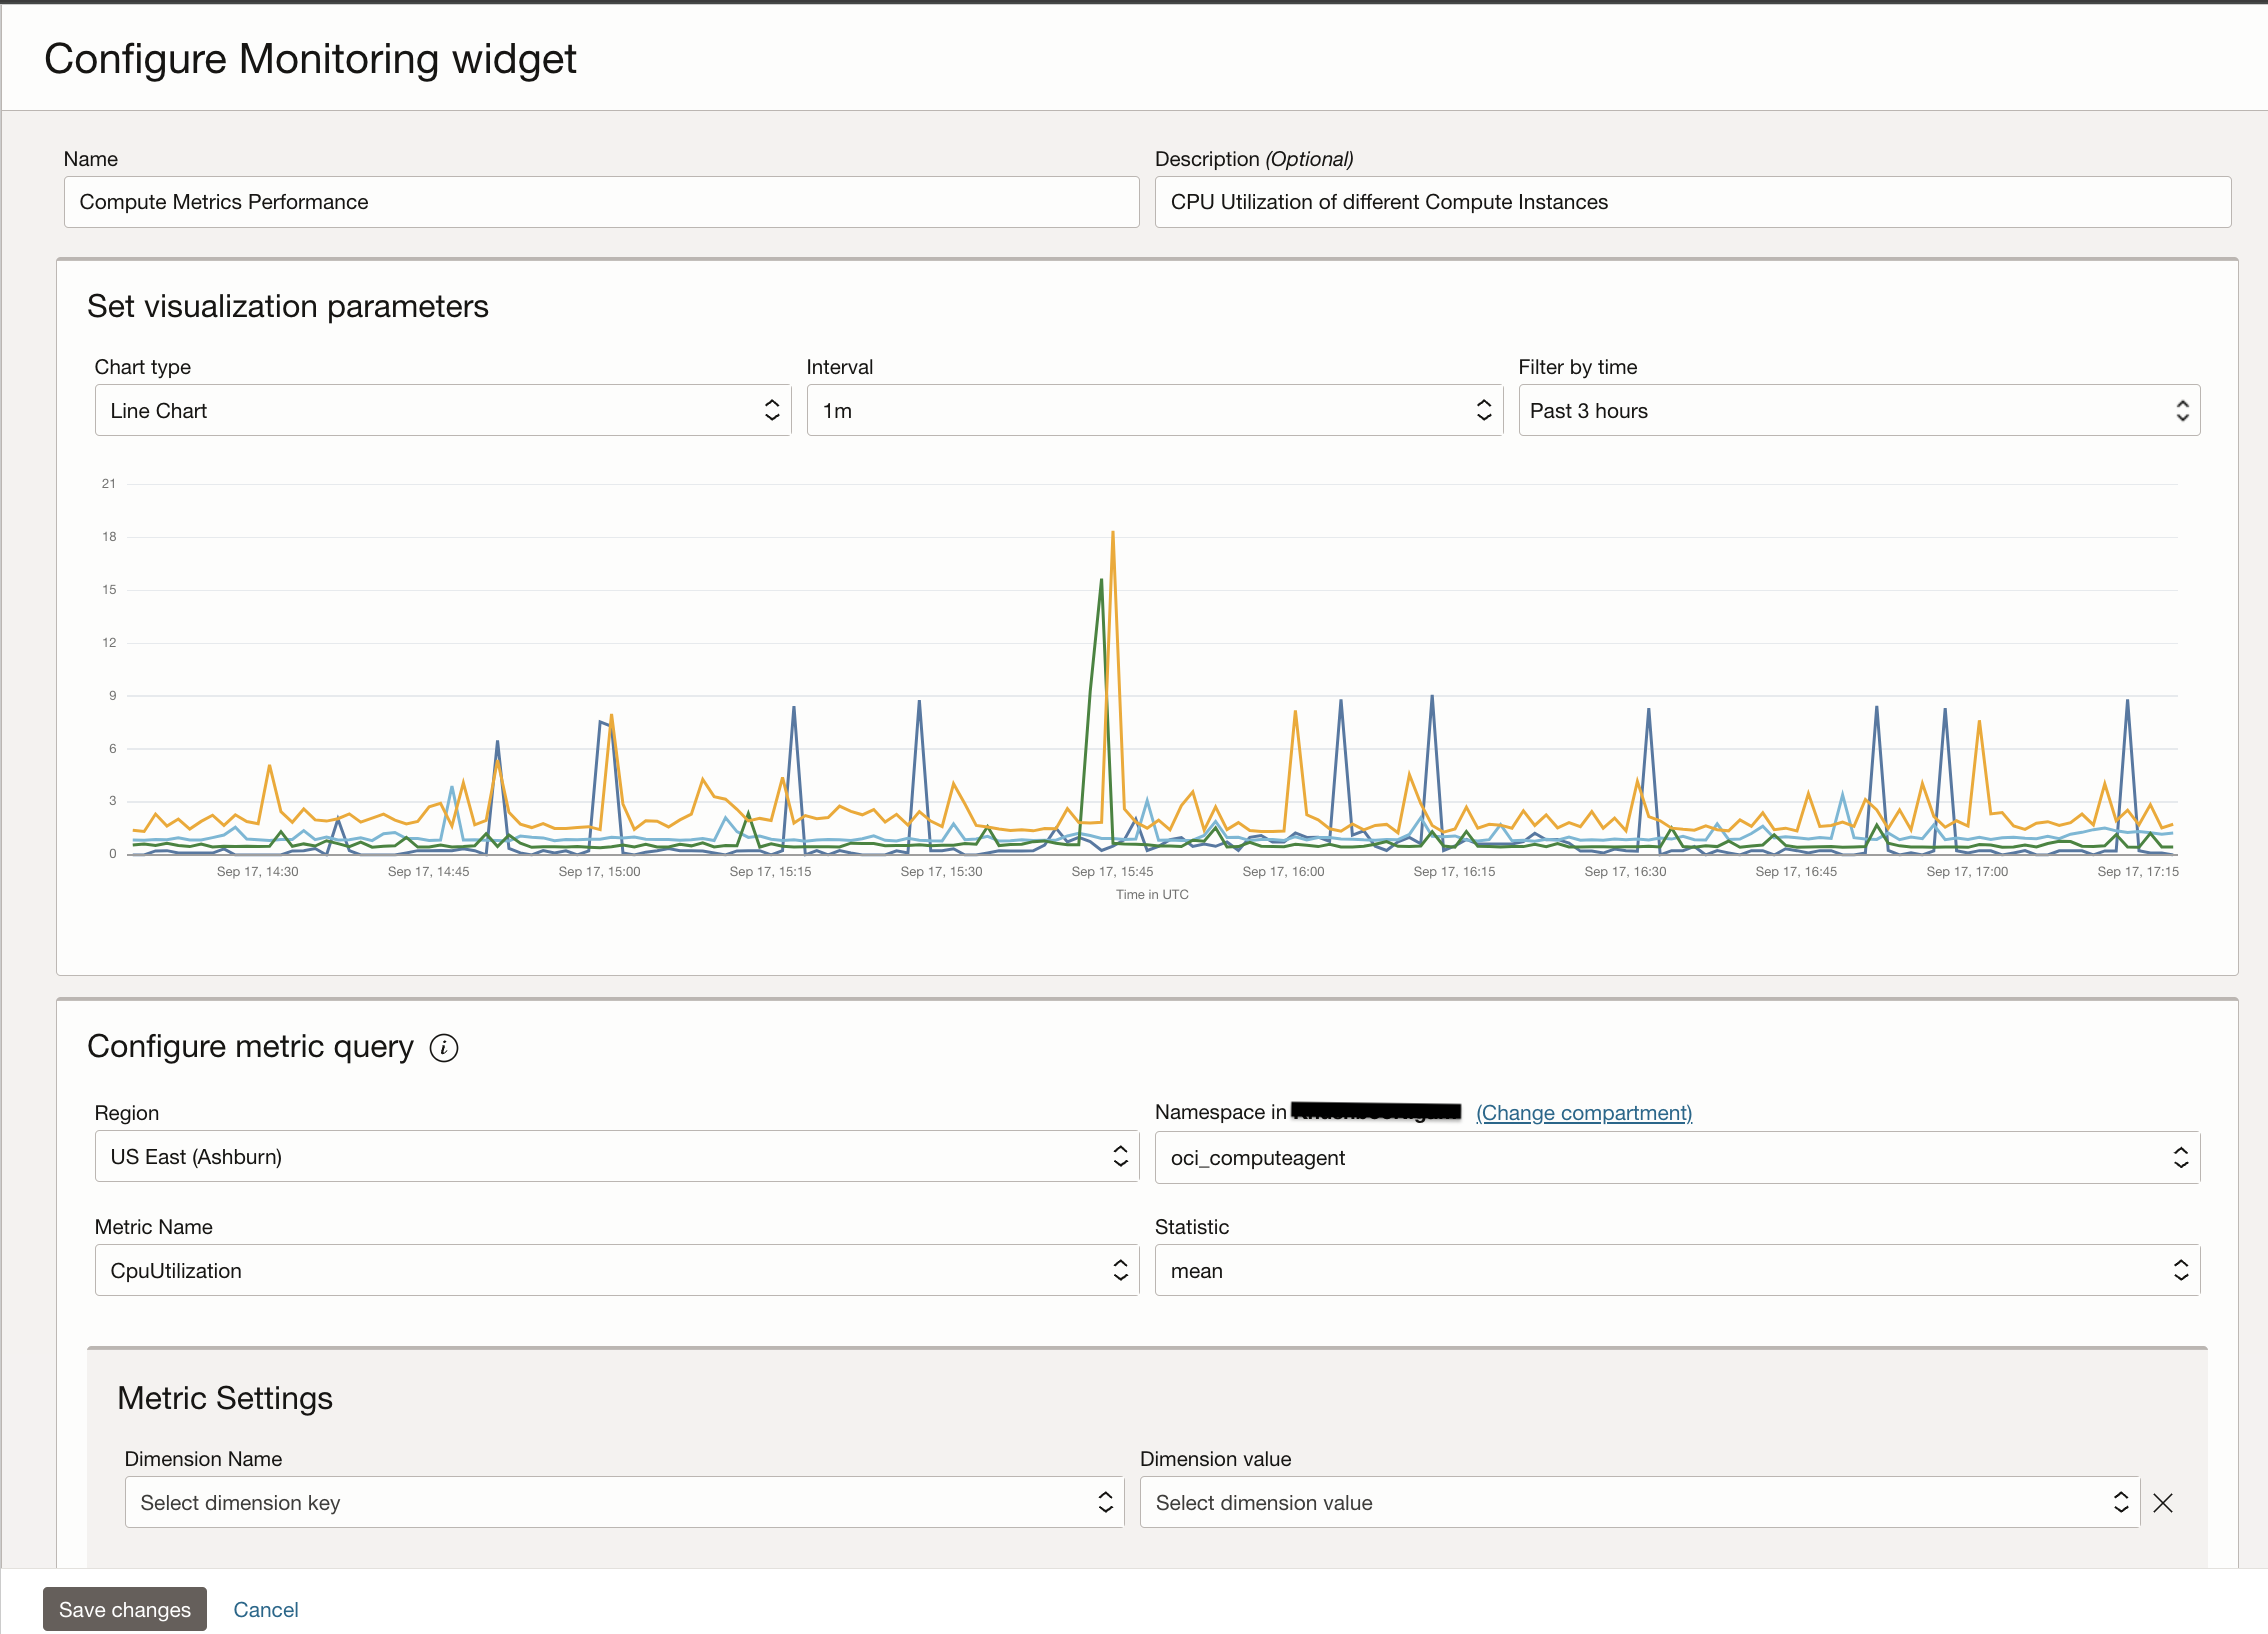
Configure Monitoring Widget for a Console Dashboard 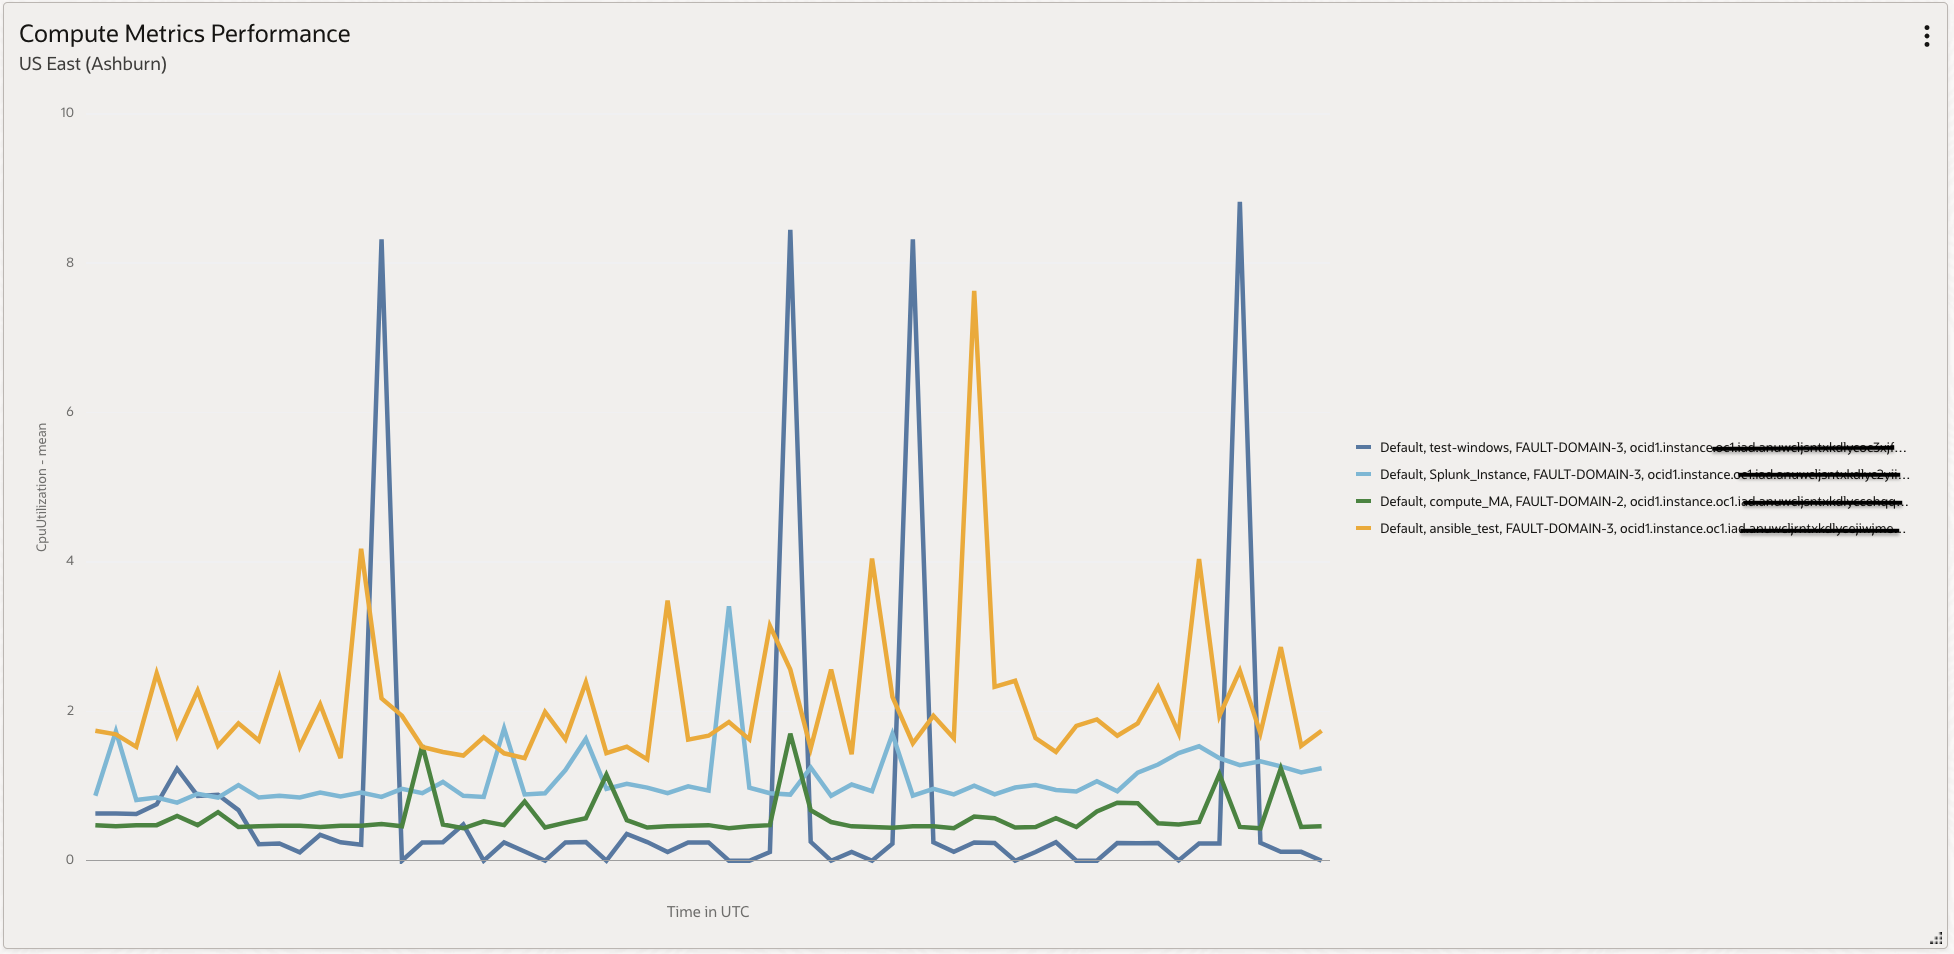
Final Metrics Widget Console Dashboards Use-Case
Console dashboards can be used to create an operations focused dashboard as seen in the image below. Here you can see costs incurred by different services in a specific compartment, resource explorer to understand number of different type of resources in a compartment, overall infrastructure billing, and add a query on your resources such as a widget to show you status of different compute instances. These widgets can be focused on entire tenant as well.
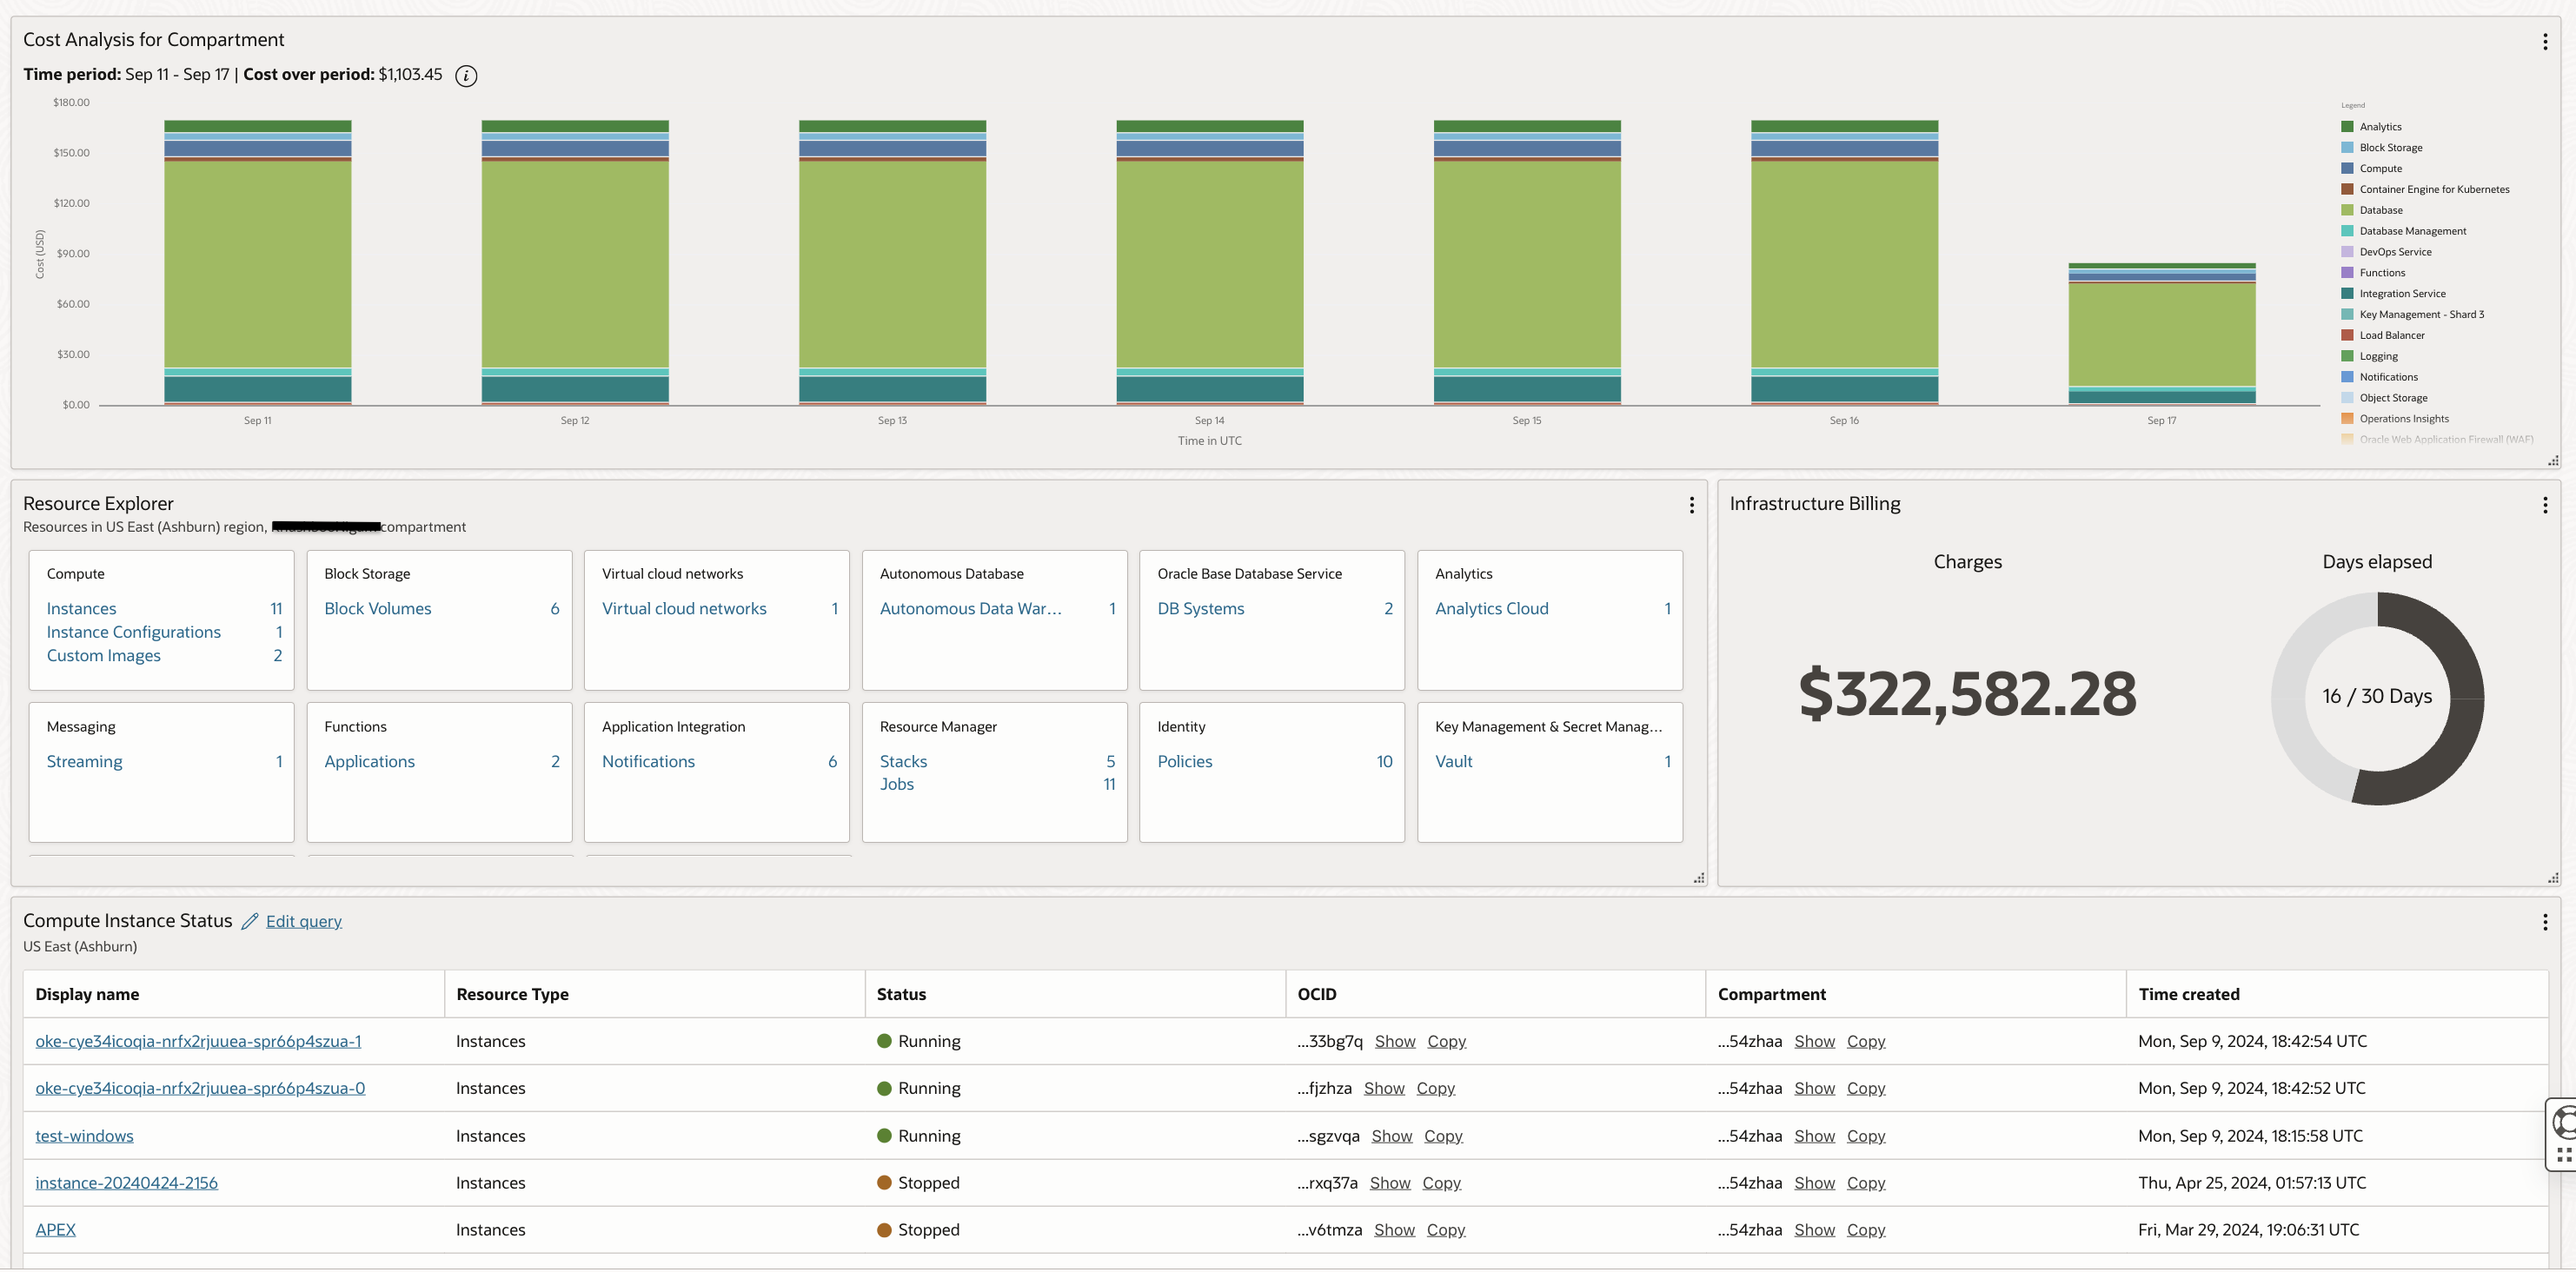
Operational Dashboard created using Console Dashboard Comparison of Console & Management Dashboards
- Reporting Focus :
- OCI Console Dashboard provides a holistic view of OCI services and resources by offering cost analysis, resource exploration, and a centralized view of OCI components. This makes them suitable for high-level monitoring, resource management, and cost optimization.
- Management Dashboards provides in-depth technical insights and analysis. Focuses on health, performance, and detailed metrics of applications, infrastructure, and databases. They are tailored for deep-dive troubleshooting, performance optimization, and detailed analysis of specific components. They do not include widgets related to cost data.
- So if you require a high-level reporting which would also encompass cost component then you should go for Console Dashboards and if you are looking for more technical insights into your resources, you should go for Management Dashboards.
- Logging & Monitoring Widget Capabilities:
- Both the Console and Management Dashboards offer logging & monitoring widgets but the capabilities vary. OCI Console Dashboards offers basic logging and monitoring capabilities based on the foundational OCI Logging and Monitoring services. Monitoring Widget does not support advanced queries on top of metrics data. Also, you can add only one metric from a namespace at a time. Logging widget data will be limited to 14 days of log data as that is how far back you can go when searching through logs using OCI Logging service. Also these logs will have a maximum log retention of 6 months as supported by Logging.
- In a Management Dashboard while creating metrics widgets, you can write advanced queries using monitoring query language or add multiple metrics from a single namespace to the same widget. Widgets for logs are created using advanced OCI Logging Analytics service which would supports complex queries, custom visualizations, and longer log retention periods.
- This makes OCI Console Dashboards ideal for a high-level overview of resource health, performance, and log activity, including cost analysis and Management Dashboards suited for in-depth technical analysis, troubleshooting, and performance optimization, allowing deeper insights into metric and log data without time constraints.
- Costs: The cost associated with dashboards depends on the underlying services used for telemetry data collection and presentation. Console dashboards rely on basic Monitoring and Logging services, with costs tied to data volume and monitored resources. Management dashboards leverage various Observability and Management services, each with its own pricing model, allowing for customized solutions but with costs depending on the chosen services and their specific features.
- Sharing Dashboards: A Console Dashboard can be shared with OCI users using a URL or by adding these users or an entire group to an IAM policy to access these dashboards. A Management Dashboard can be accessed bu authorized users allowed through IAM policies but they can exported in a JSON format as well.
Conclusion
OCI Console Dashboards and Management Dashboards offer distinct advantages for monitoring and managing OCI resources. Console Dashboards provide a holistic view, including cost analysis, making them ideal for high-level oversight and resource management. On the other hand, Management Dashboards offer in-depth technical insights, detailed metrics, and advanced logging capabilities, catering to deep-dive troubleshooting and performance optimization.
The choice between the two depends on your specific requirements. If you need a centralized overview of OCI services, including cost optimization, the Console Dashboard is a suitable option. However, if you require detailed technical analysis and customizable widgets for metrics and logs, Management Dashboards provide a more advanced solution.
By understanding the features, capabilities, and use cases of both options, you can make an informed decision to select the dashboard that aligns with your monitoring, management, and cost requirements. Whether you choose Console Dashboards for a holistic view or Management Dashboards for technical depth, OCI provides flexible options to meet your OCI resource management needs.
