In today’s digital landscape, securing your Linux compute instances is paramount. This blog will explore the critical importance of Linux Secure logs, particularly in an Oracle Cloud Infrastructure (OCI) environment. Secure logs primarily focus on authentication and security-related events, such as user logins, failed login attempts, and changes to user privileges. While audit logs provide a more comprehensive view of system activities, focusing on tracking all actions taken on the system, including file accesses, process executions, and system changes. We will delve into best practices for collecting and analyzing logs from OCI compute instances using OCI Logging Analytics, a robust tool designed to maximize the value of your log data.
Pre-requisites
- Set up service policies for Oracle Cloud Logging Analytics. See Enable Access to Logging Analytics and Its Resources and Prerequisite IAM Policies in Oracle Cloud Infrastructure Documentation.
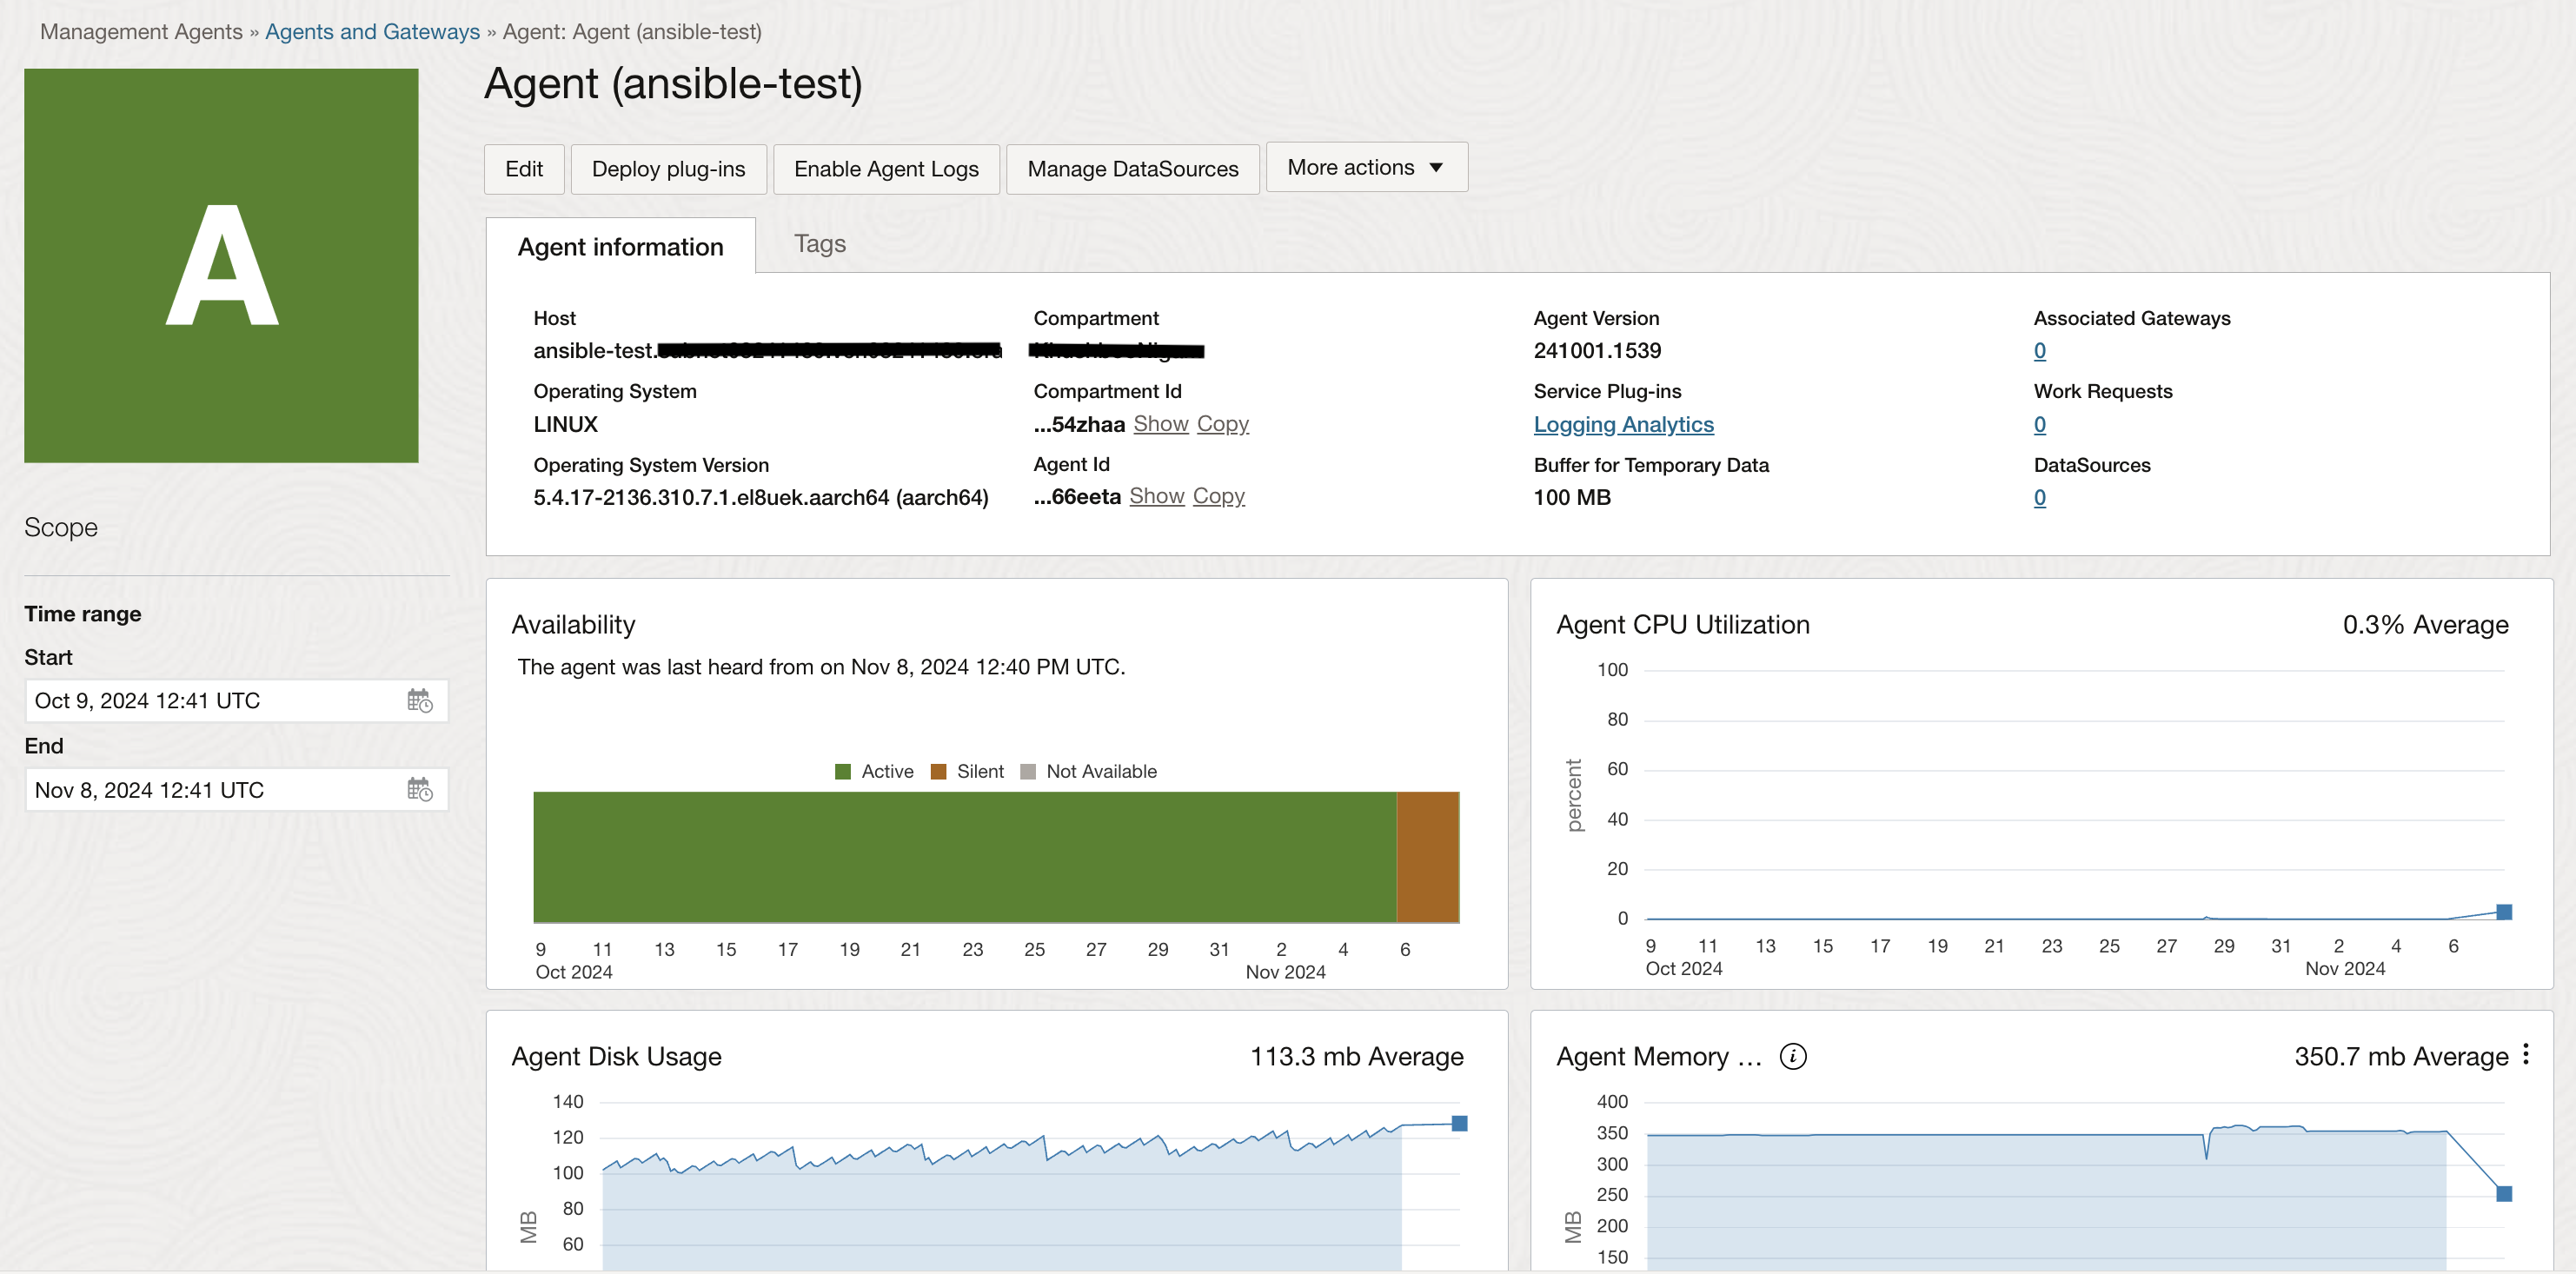
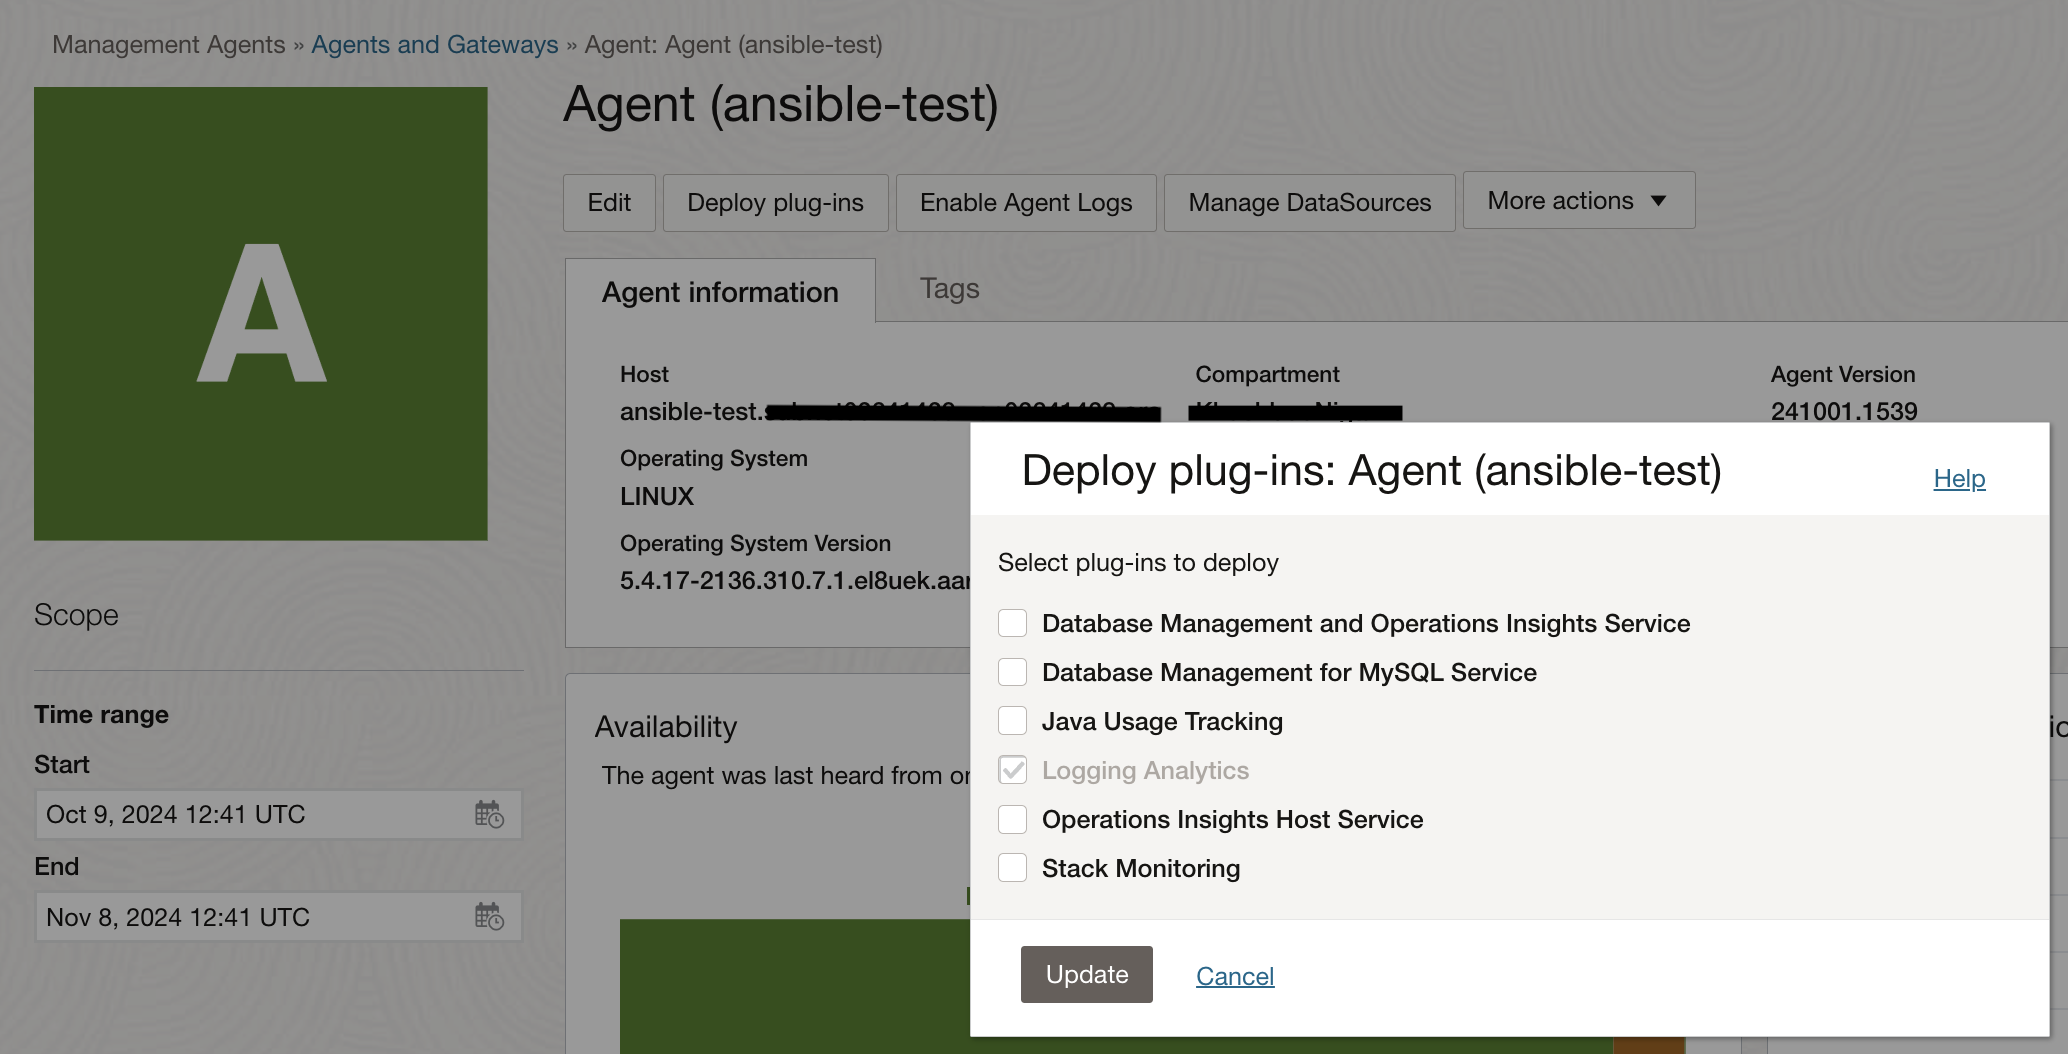
- When using an OCI Linux compute instance, you can use the Oracle Cloud Agent capabilities to enable the Management Agent plugin. Once the agent is up and running, enable Logging Analytics plug in on the agent page for it to start posting data to the service.
- On Unix-based hosts, the user that installs management agent is mgmt_agent for the manually installed management agent, and oracle-cloud-agent when the management agent is a plugin enabled with Oracle Cloud Agent.
Collecting Logs from an OCI Linux Compute Instance
The Management Agent is a powerful tool that facilitates seamless log retrieval from compute for analysis within Logging Analytics. The OCI Linux compute instance comes with Management Agent available is a plugin enabled with Oracle Cloud Agent.
To ensure smooth operations, the appropriate IAM policies must be in place, granting the necessary permissions to the IAM group intended for working with the Management Agent. These policies encompass permissions for managing agents, install keys, and dynamic groups.
The other important step of collecting logs from OCI Linux instance is by granting read access of the logs to the management agent user. In case of an OCI Linux compute, the mangement agent is a plugin enabled with Oracle cloud Agent, therefore, the user is oracle-cloud-agent.
For example, to provide access to secure logs on an OCI Linux compute the following command should be executed:
setfacl -m u:oracle-cloud-agent:r cat /var/log/secure
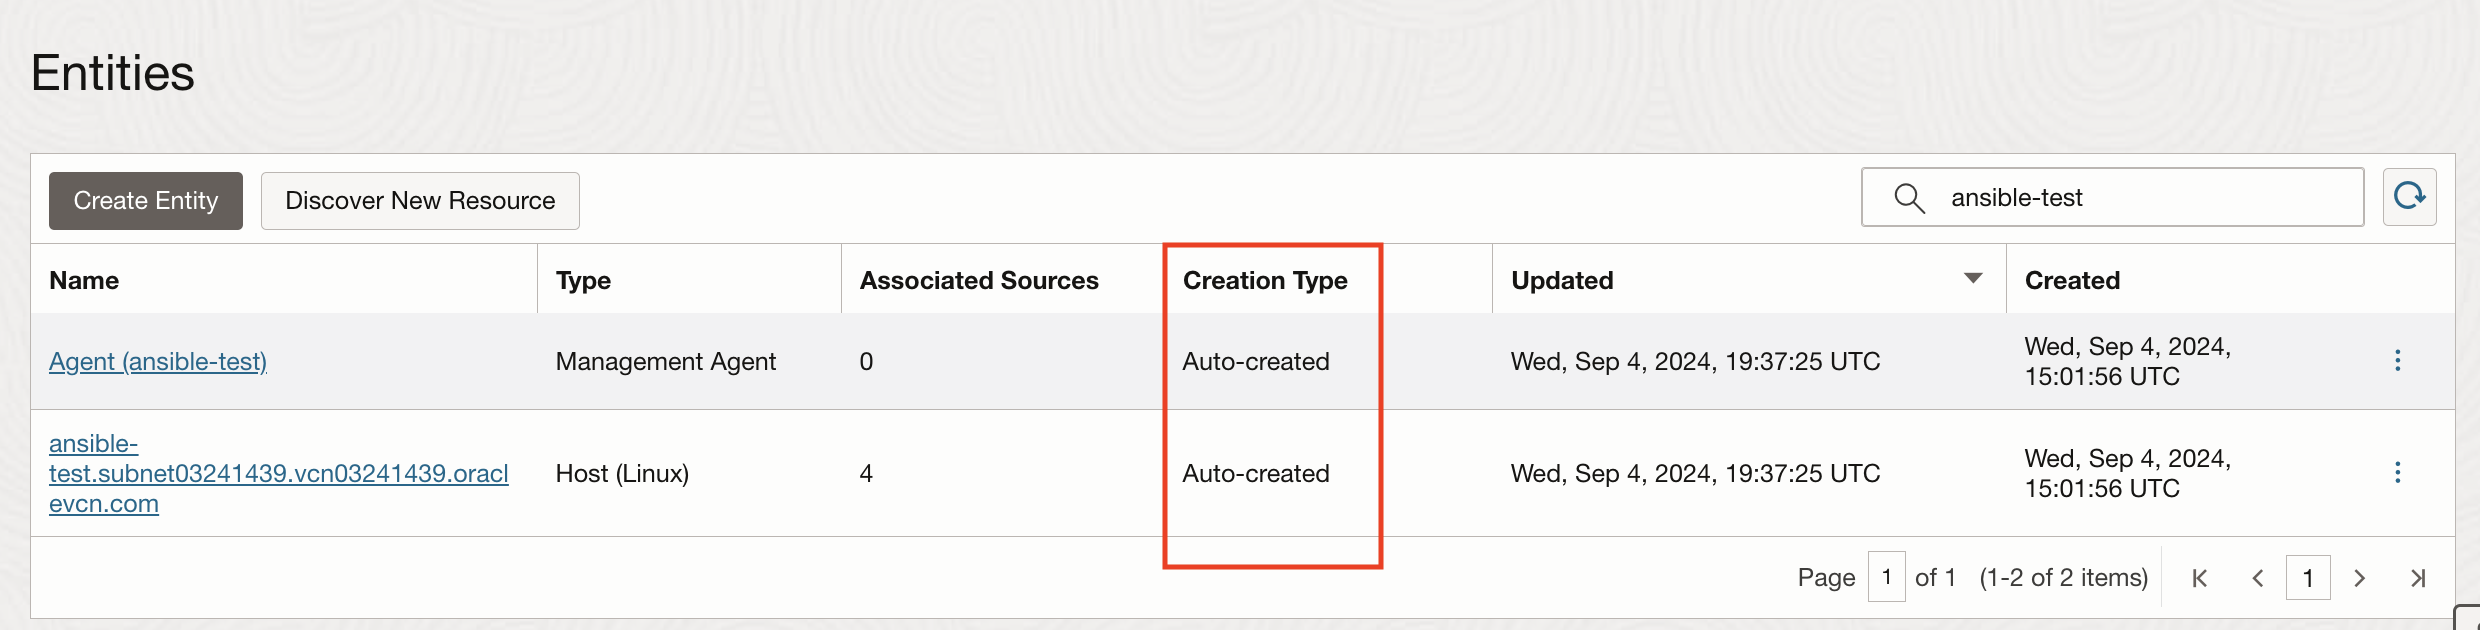
The next step is to access the Entity for this compute instance in Logging Analytics. Once you navigate to Observability & Management -> Administration -> Entities, you will see auto-created entities for the compute. We will use the Host (Linux) type entity.
Once the entity is available the next step is to associate with the corresponding out of the box Log Source available in Logging Analytics. For the use-cases, that we are going to discuss in this blog, we will use the Linux Secure Logs source.
We will use Compass for an easy collection of log data.
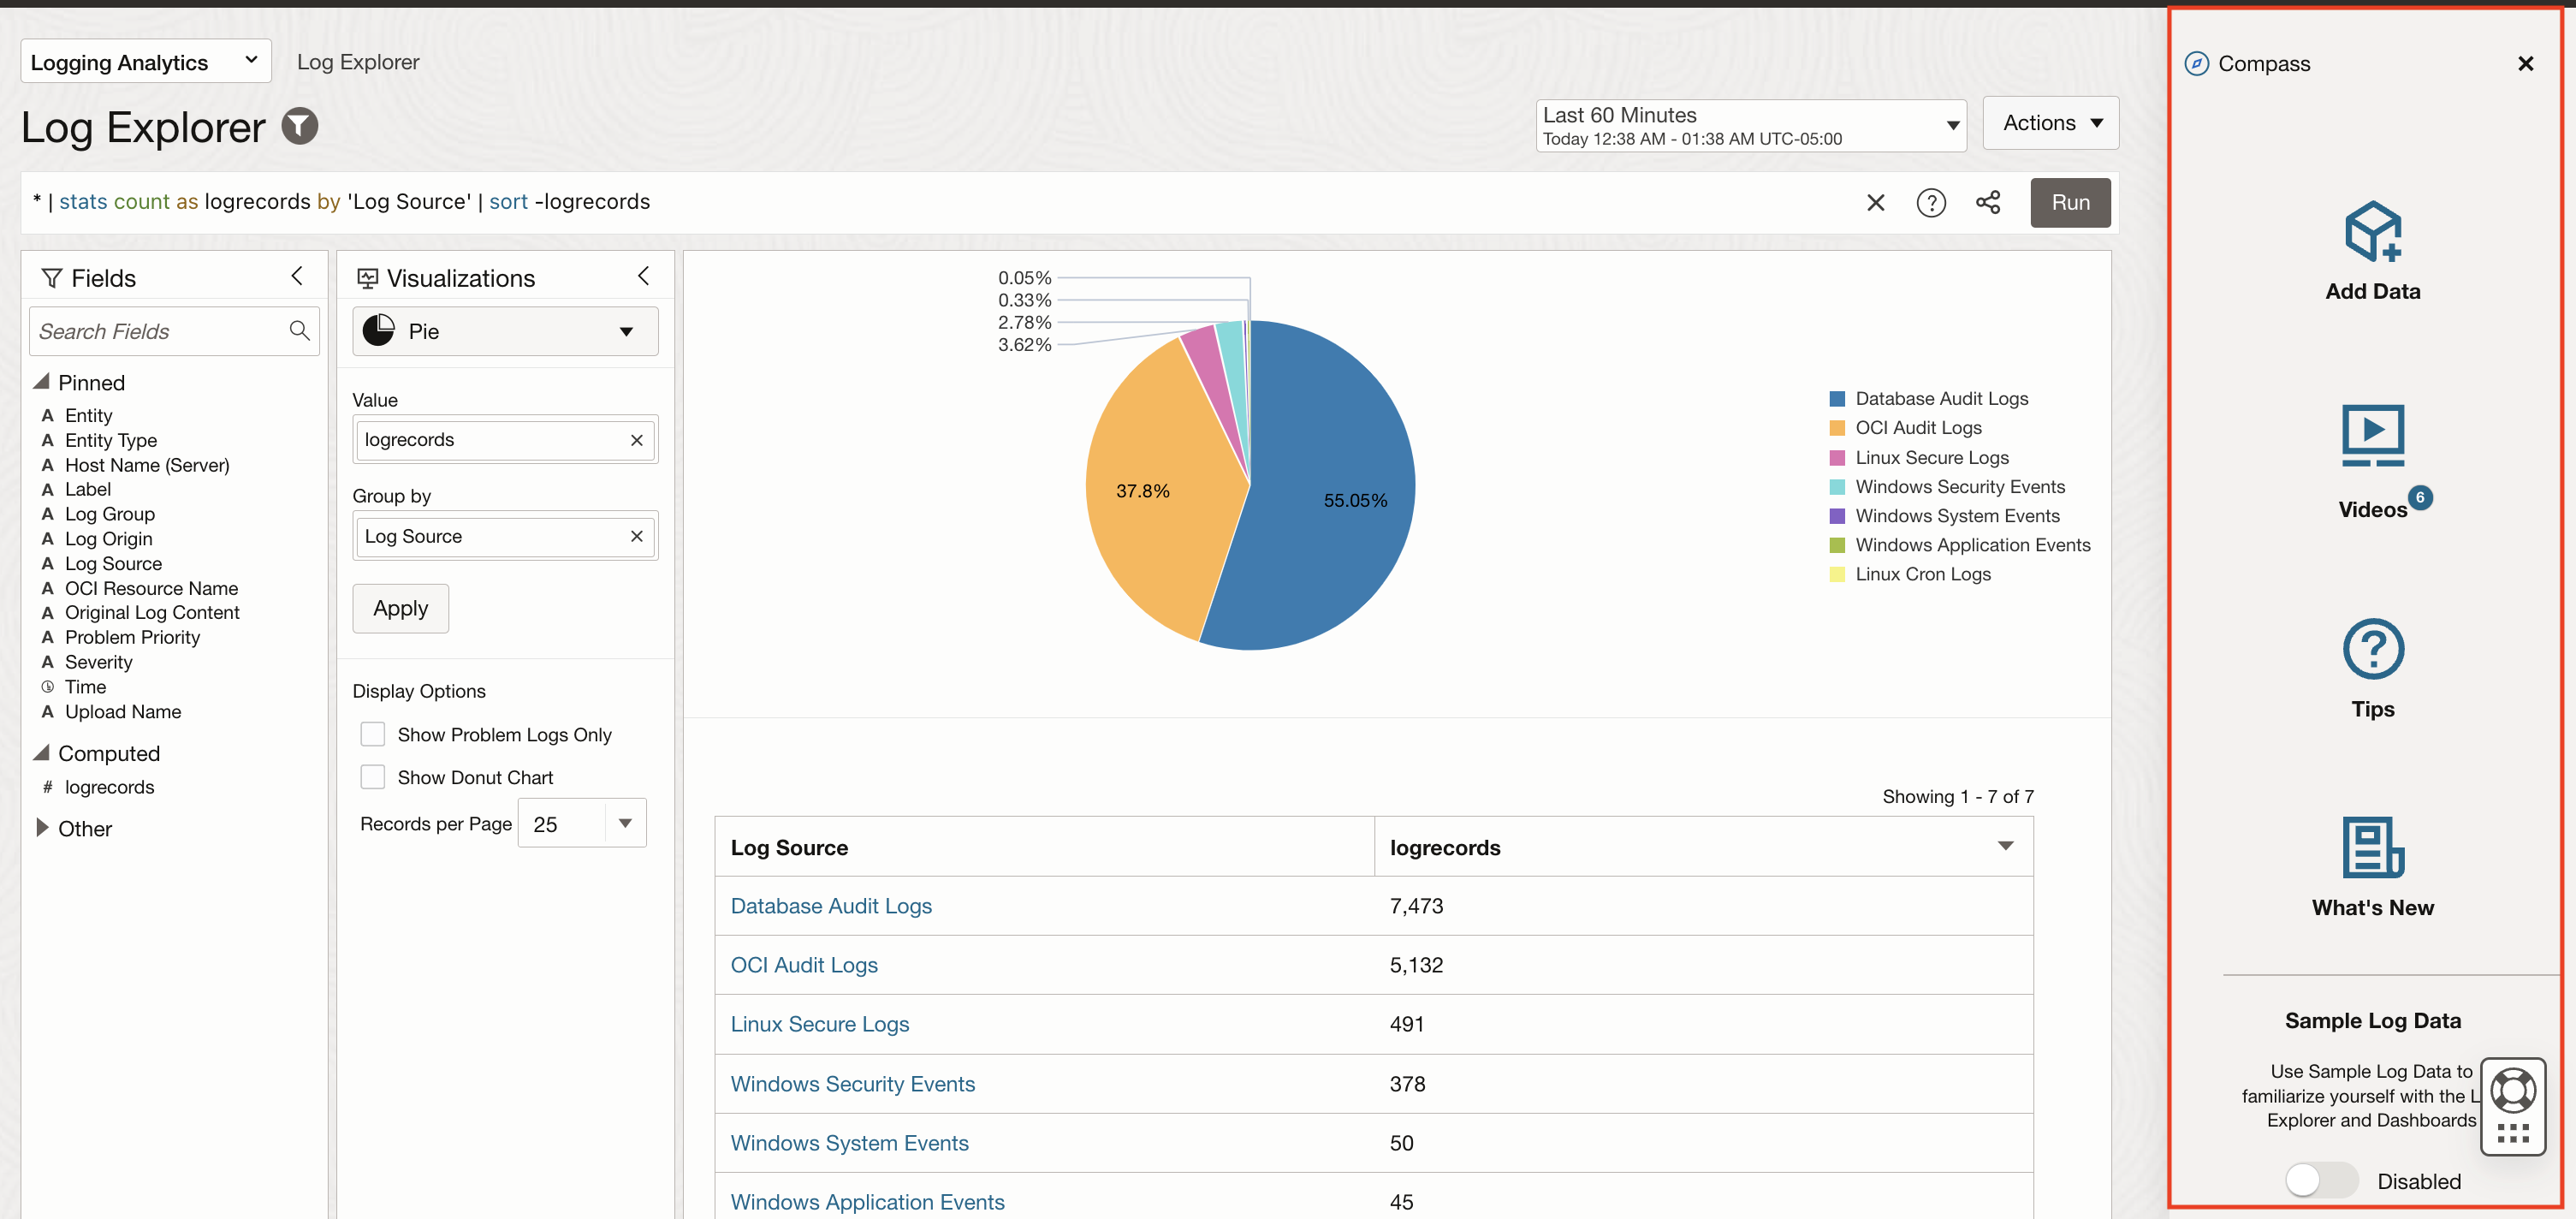
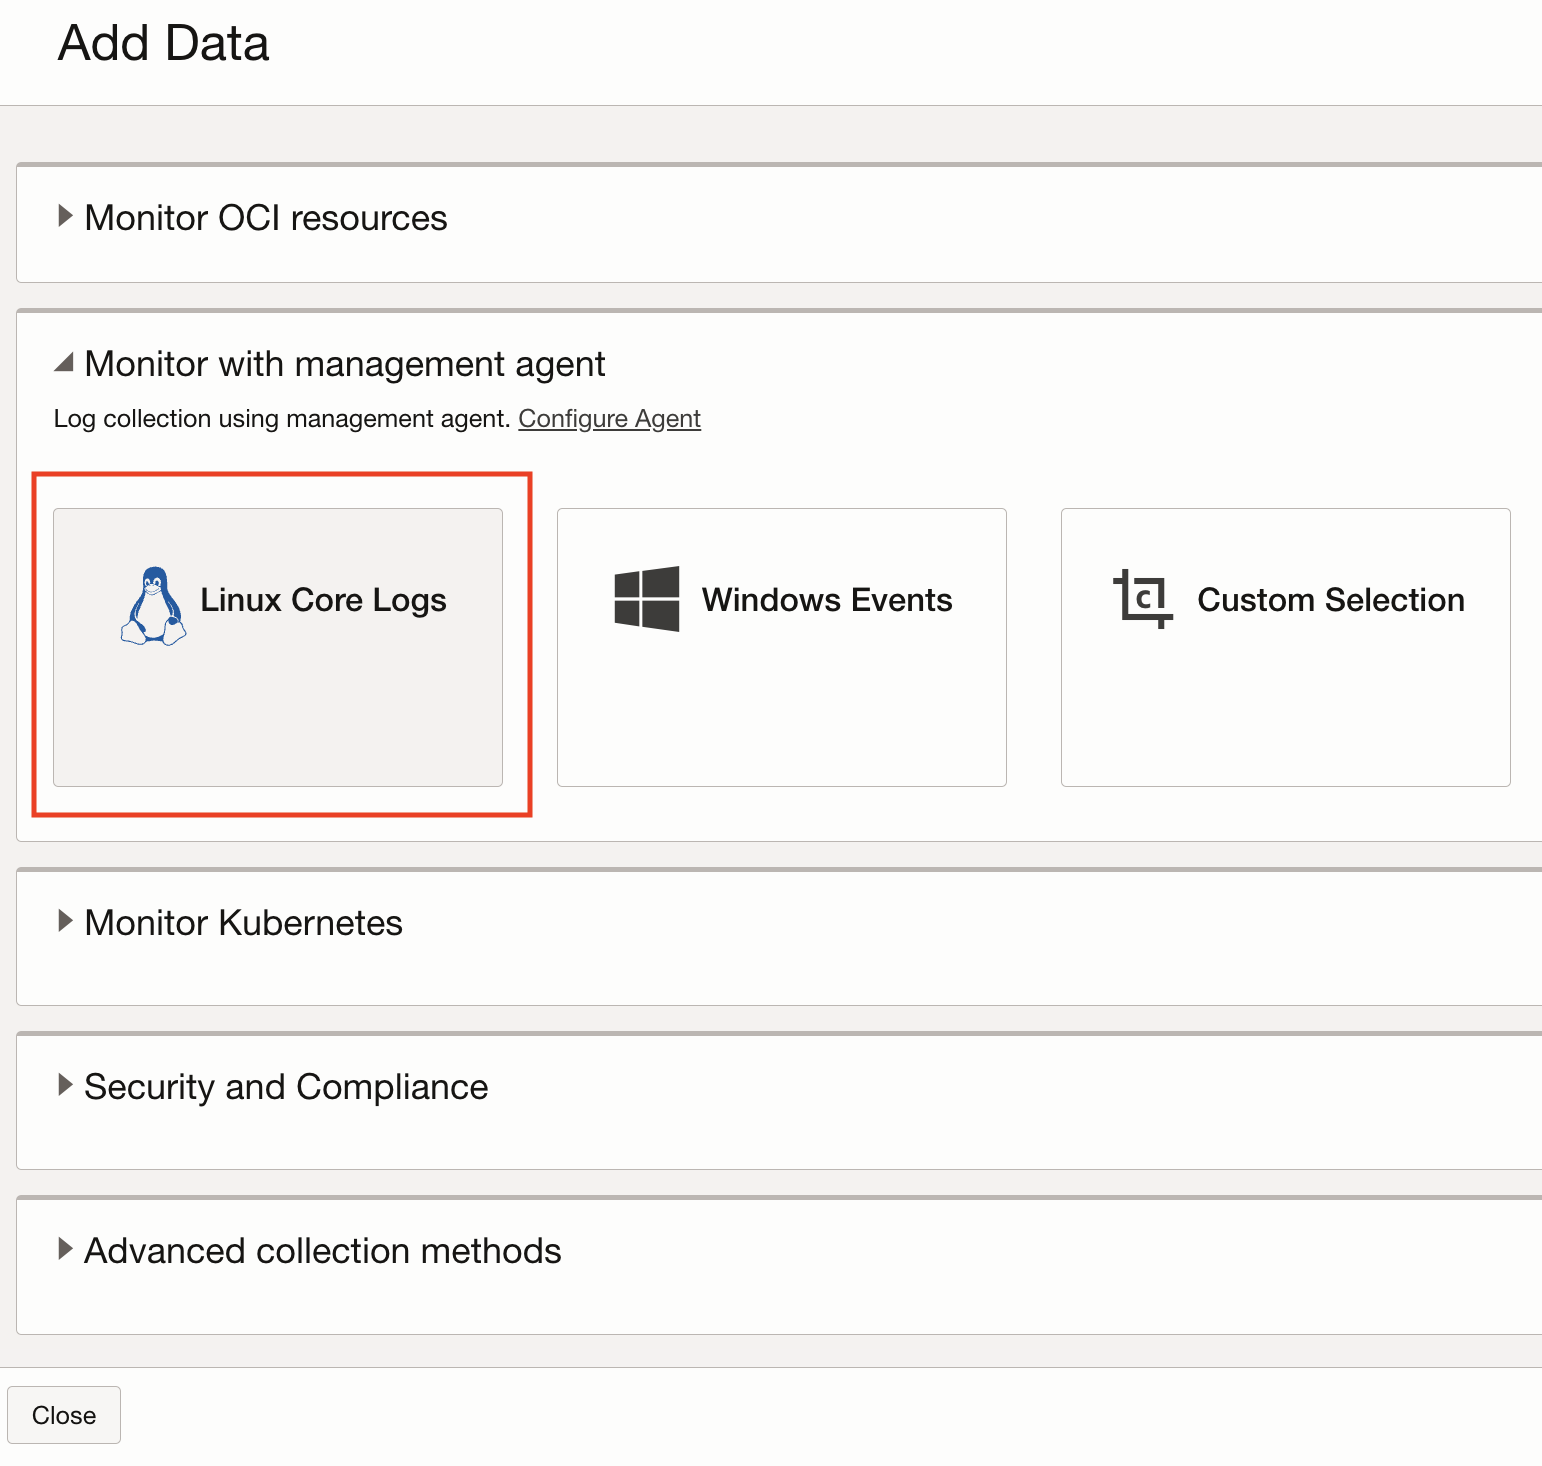
Click on Add Data to find all the options Logging Analytics offer to bring in log data from various log sources. For the use-case explained here, we are going with Monitor with Management Agent and collecting Linux Core Logs.
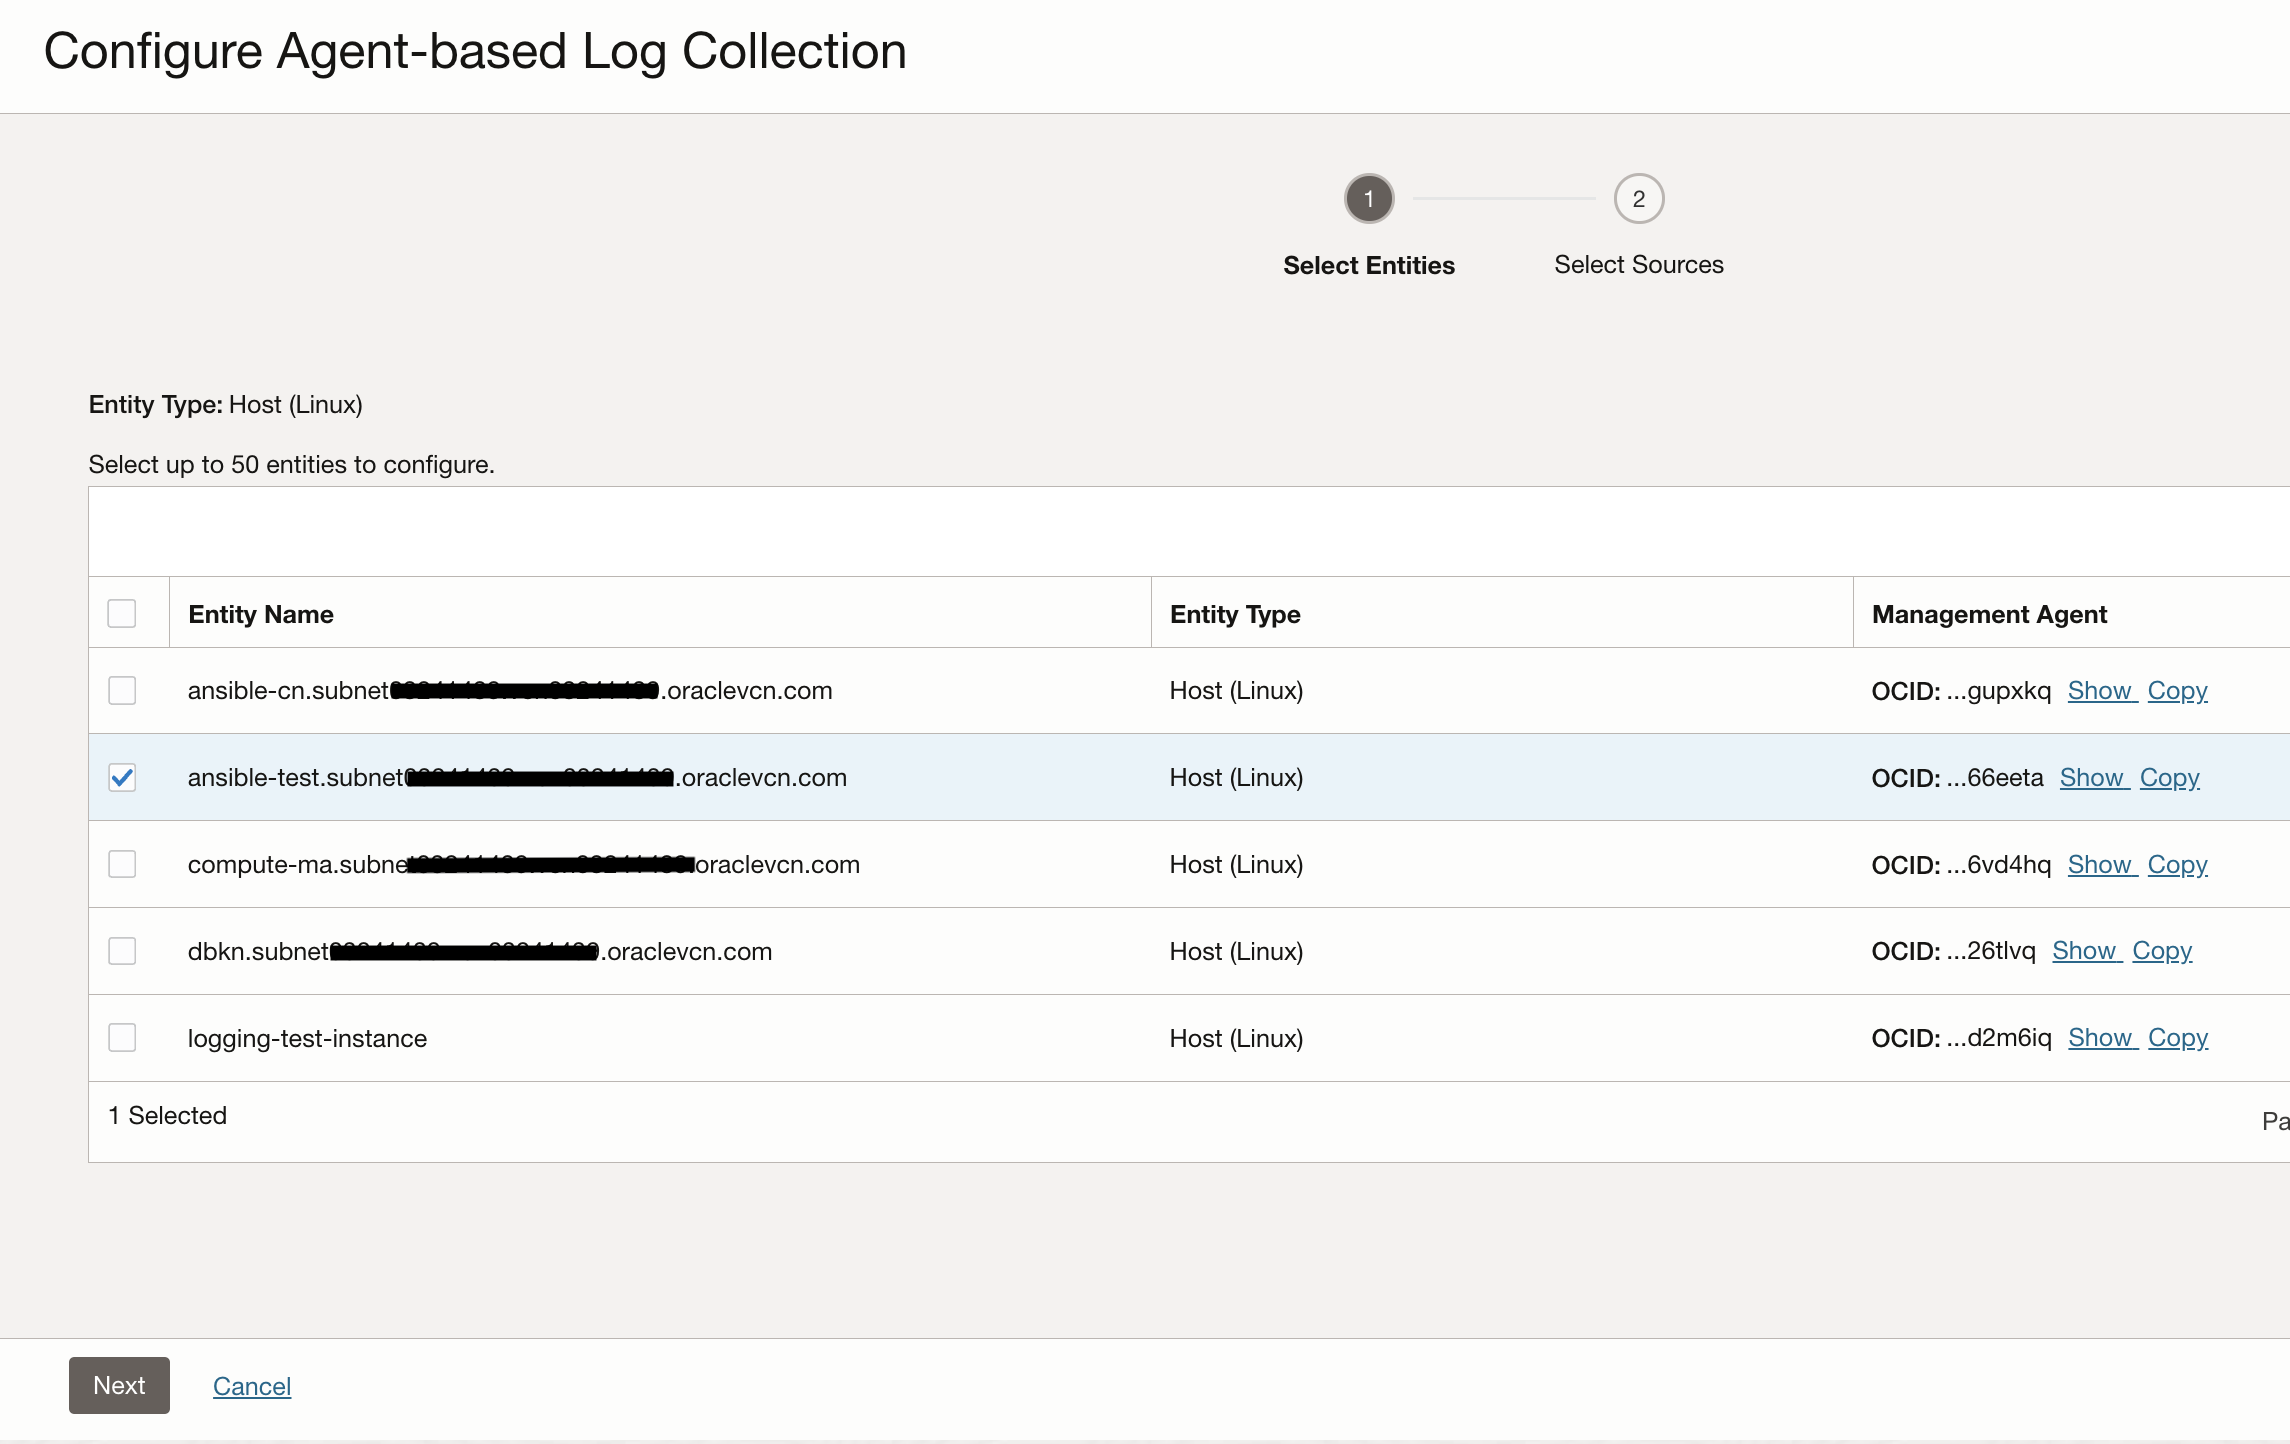
Next step is to select the Entity representing the compute instance. You will see that all the compatible entities are available to be selected from in this list.
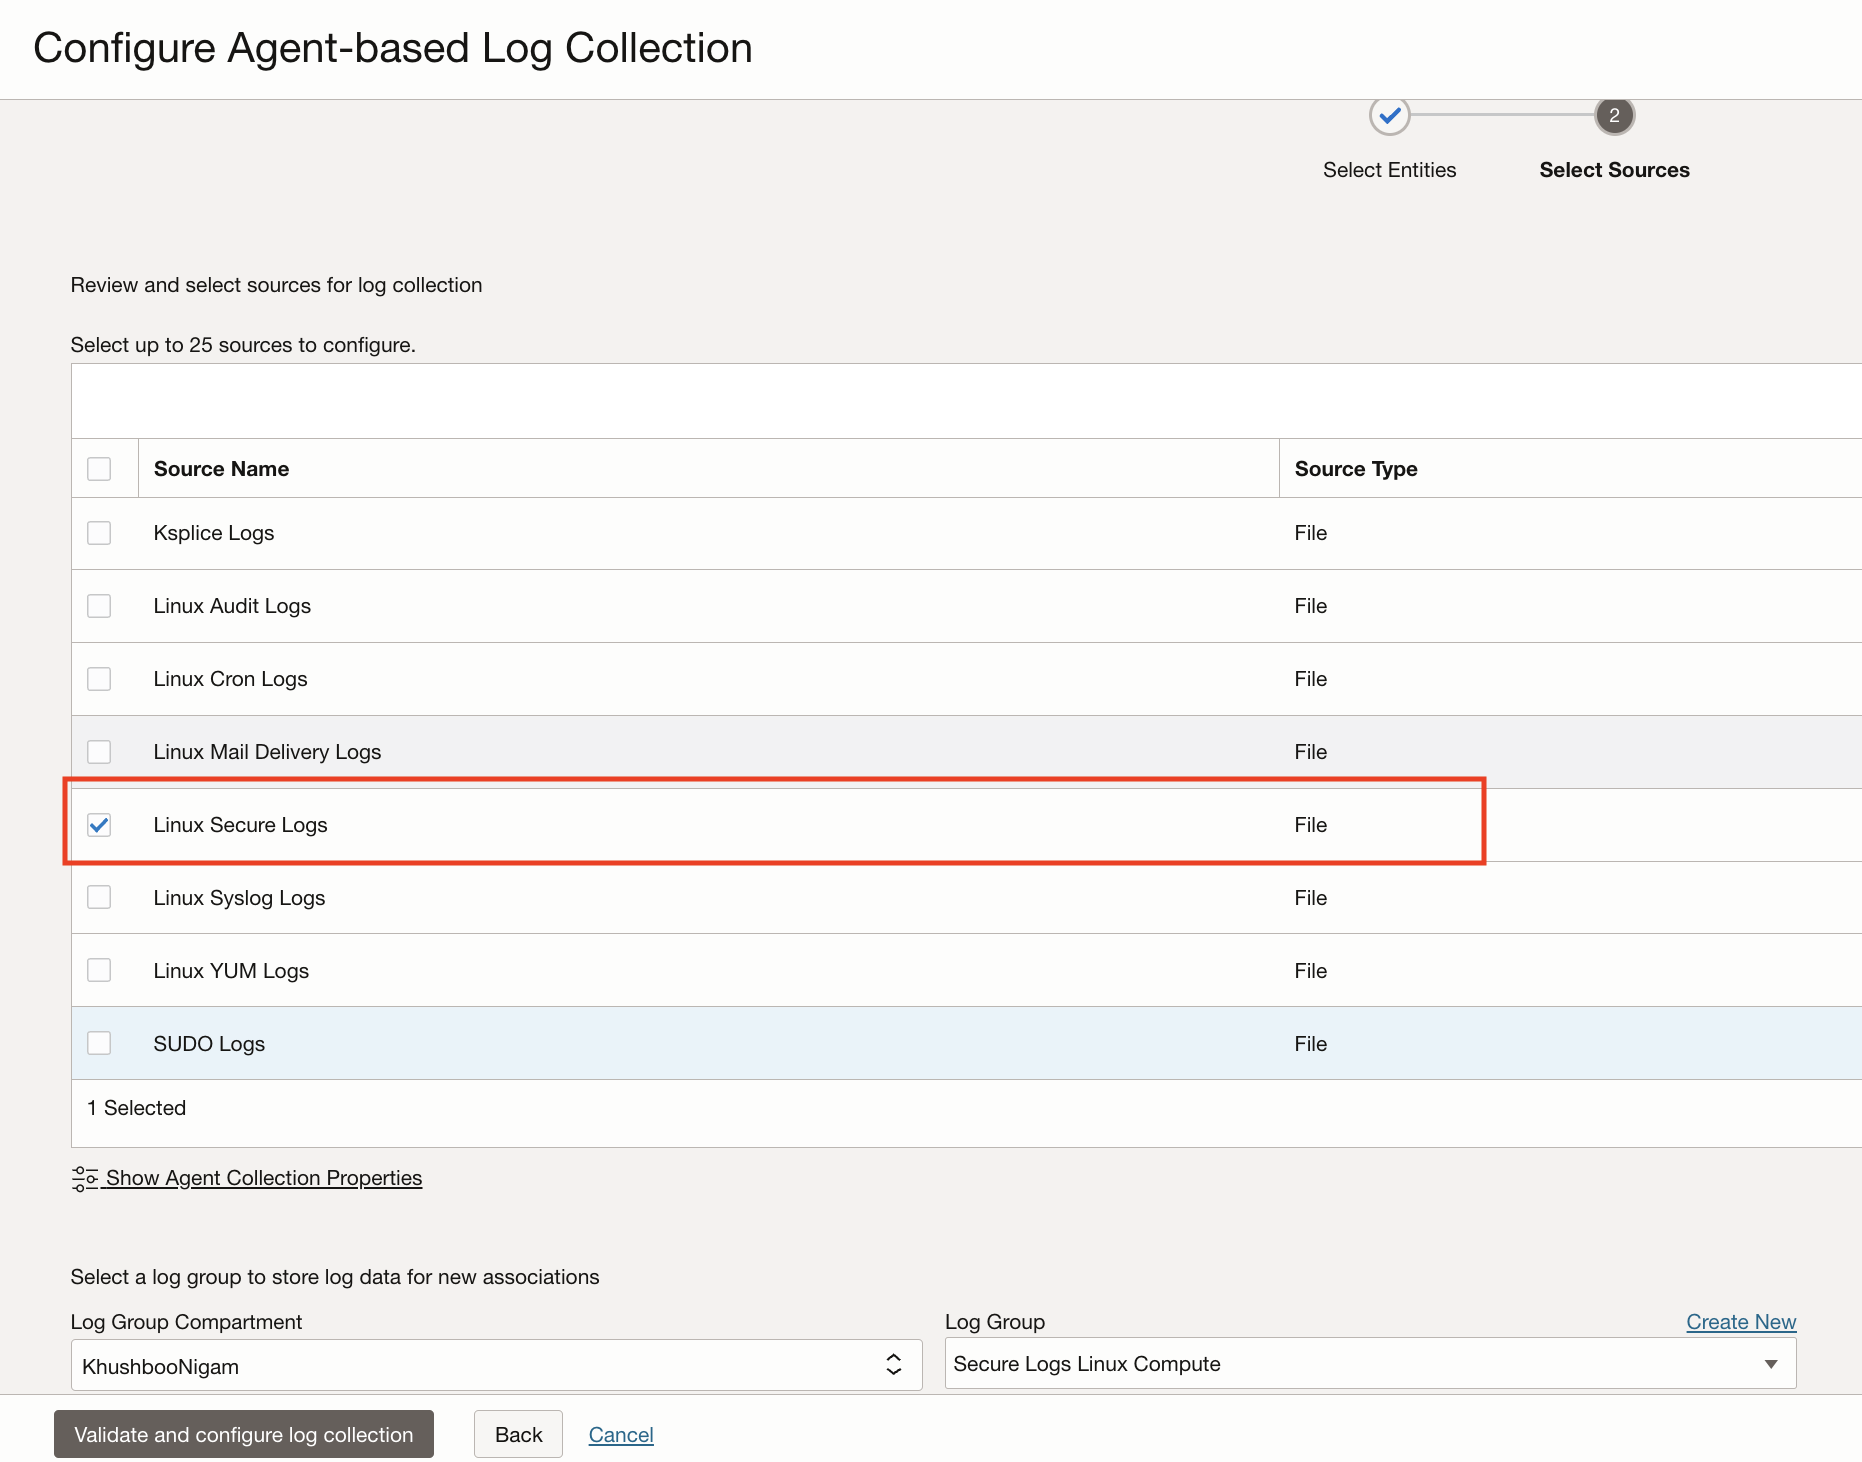
In the next step, select the required Log Source which in this case is Linux Secure Logs. In addition to secure logs, there are various other log sources available in this list which will are eligible for a Host (Linux) type Entity. It is also important to select a Log Group to contain these logs and which can help in regulating access to logs.
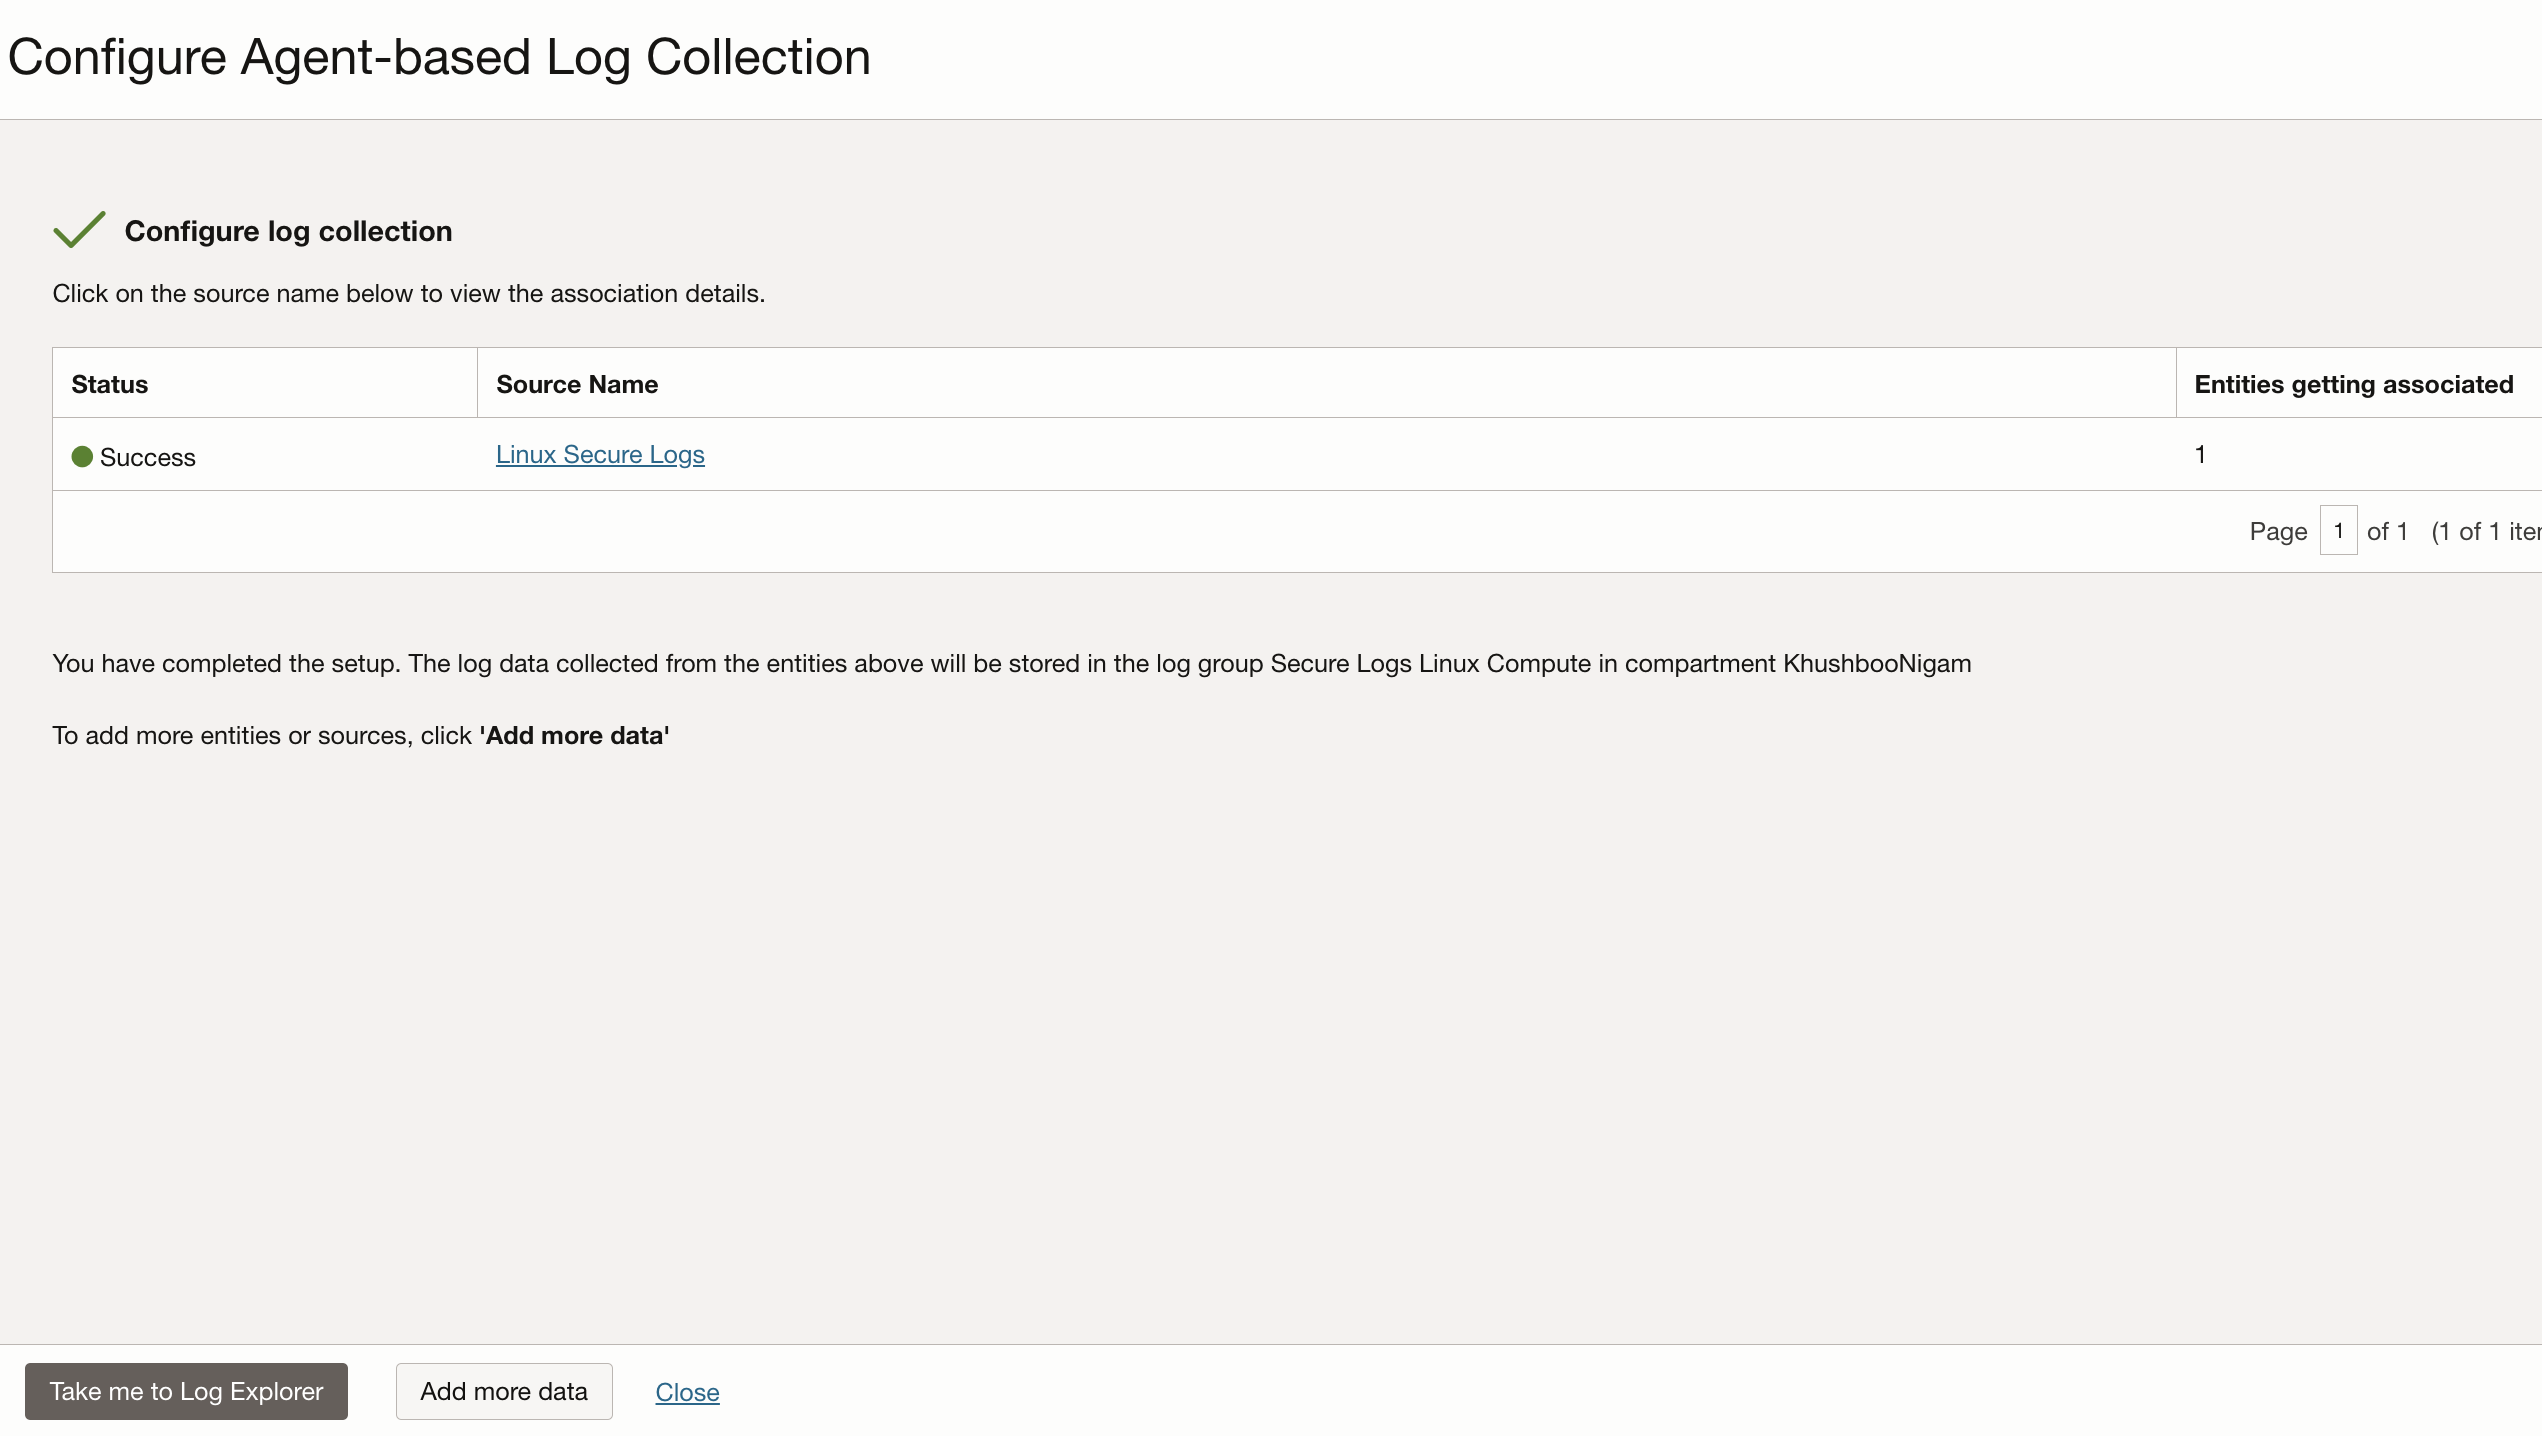
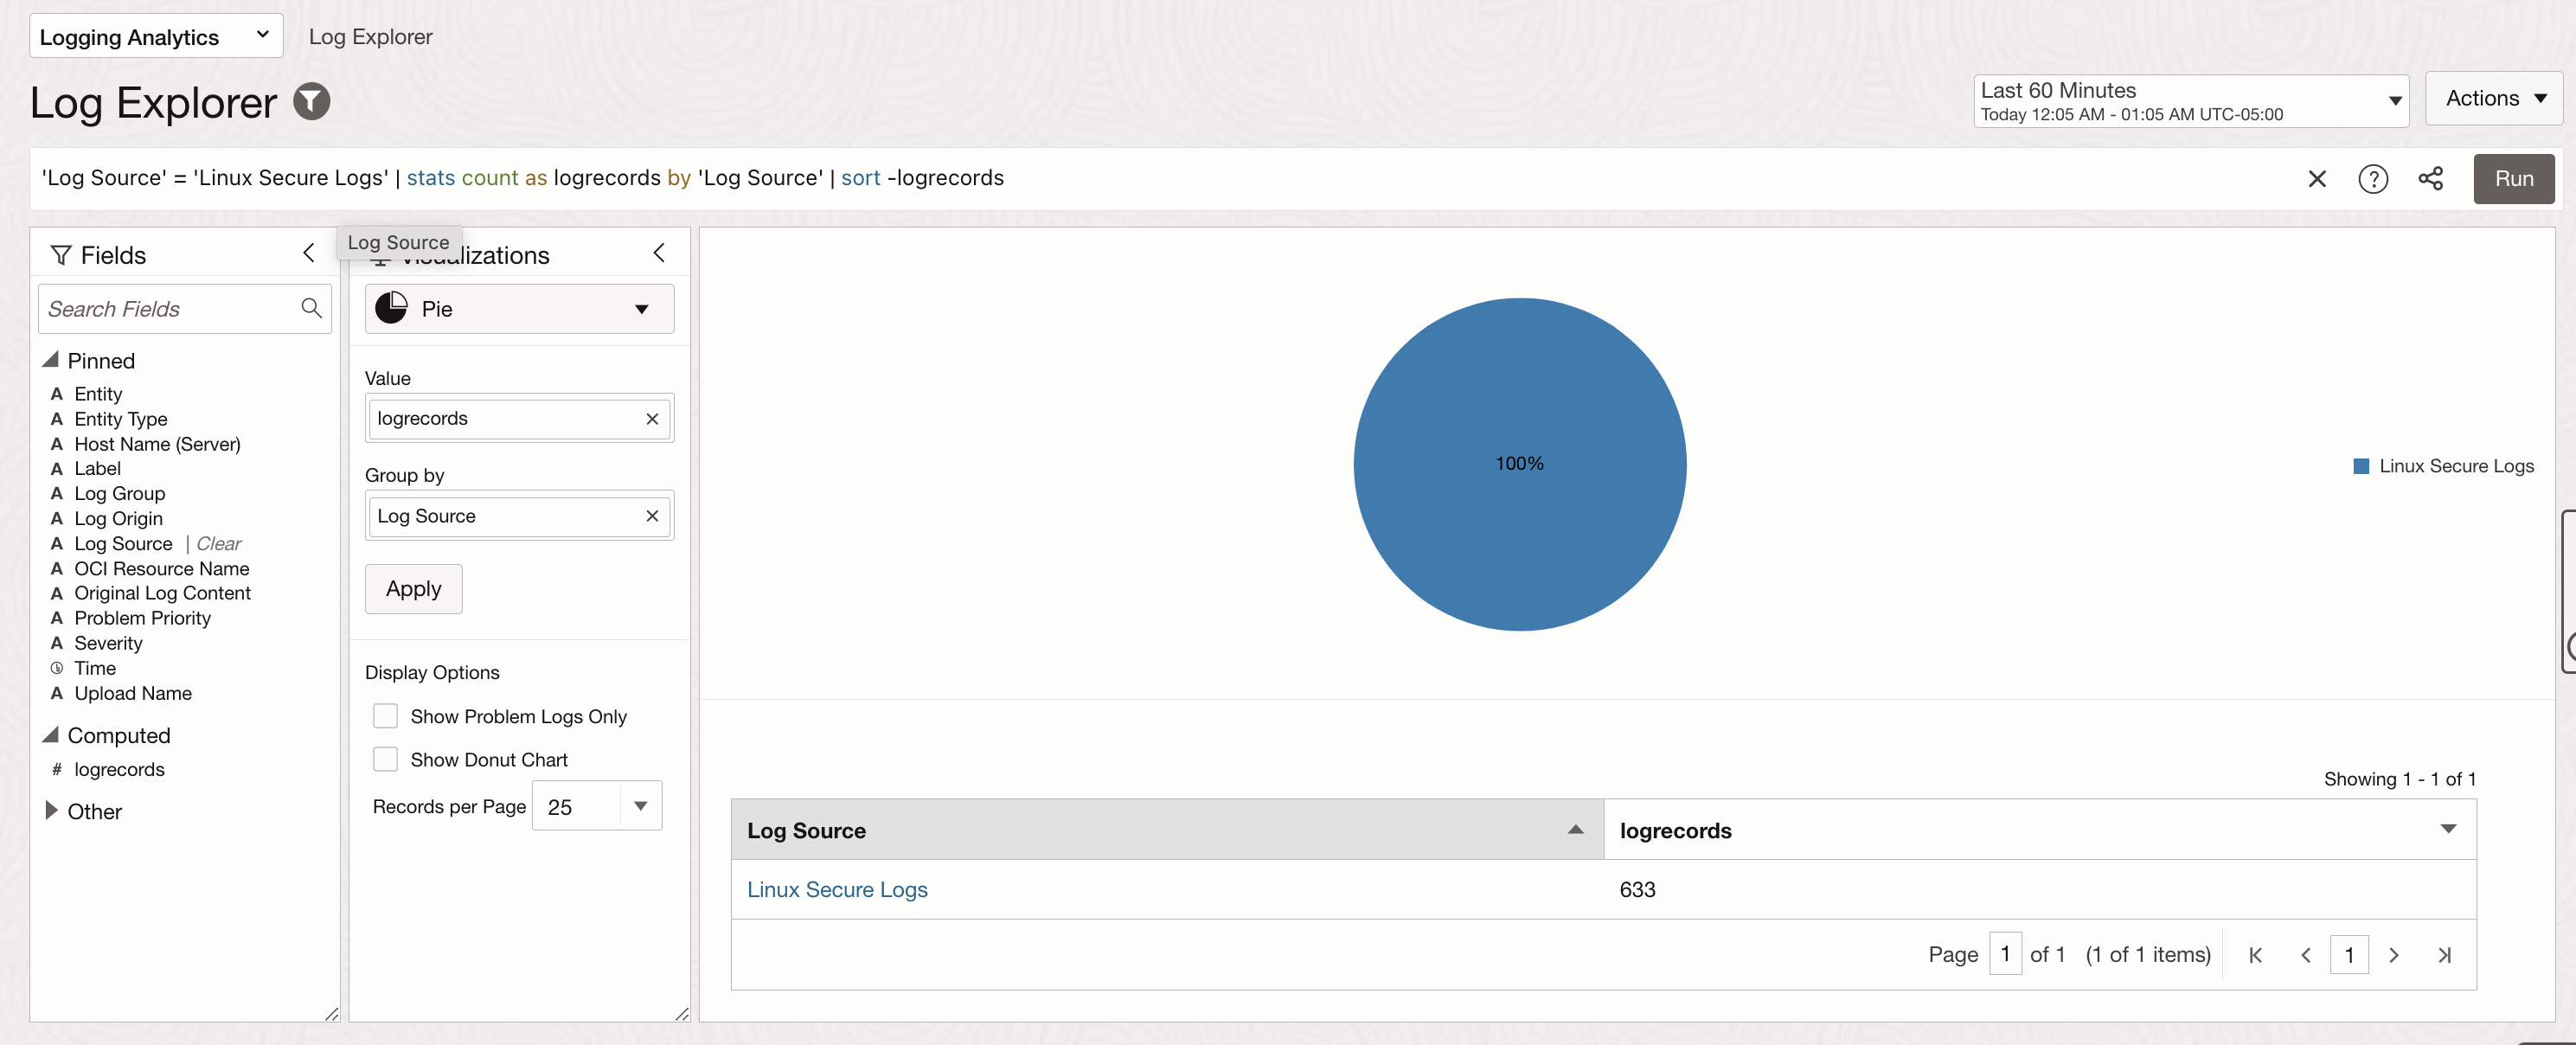
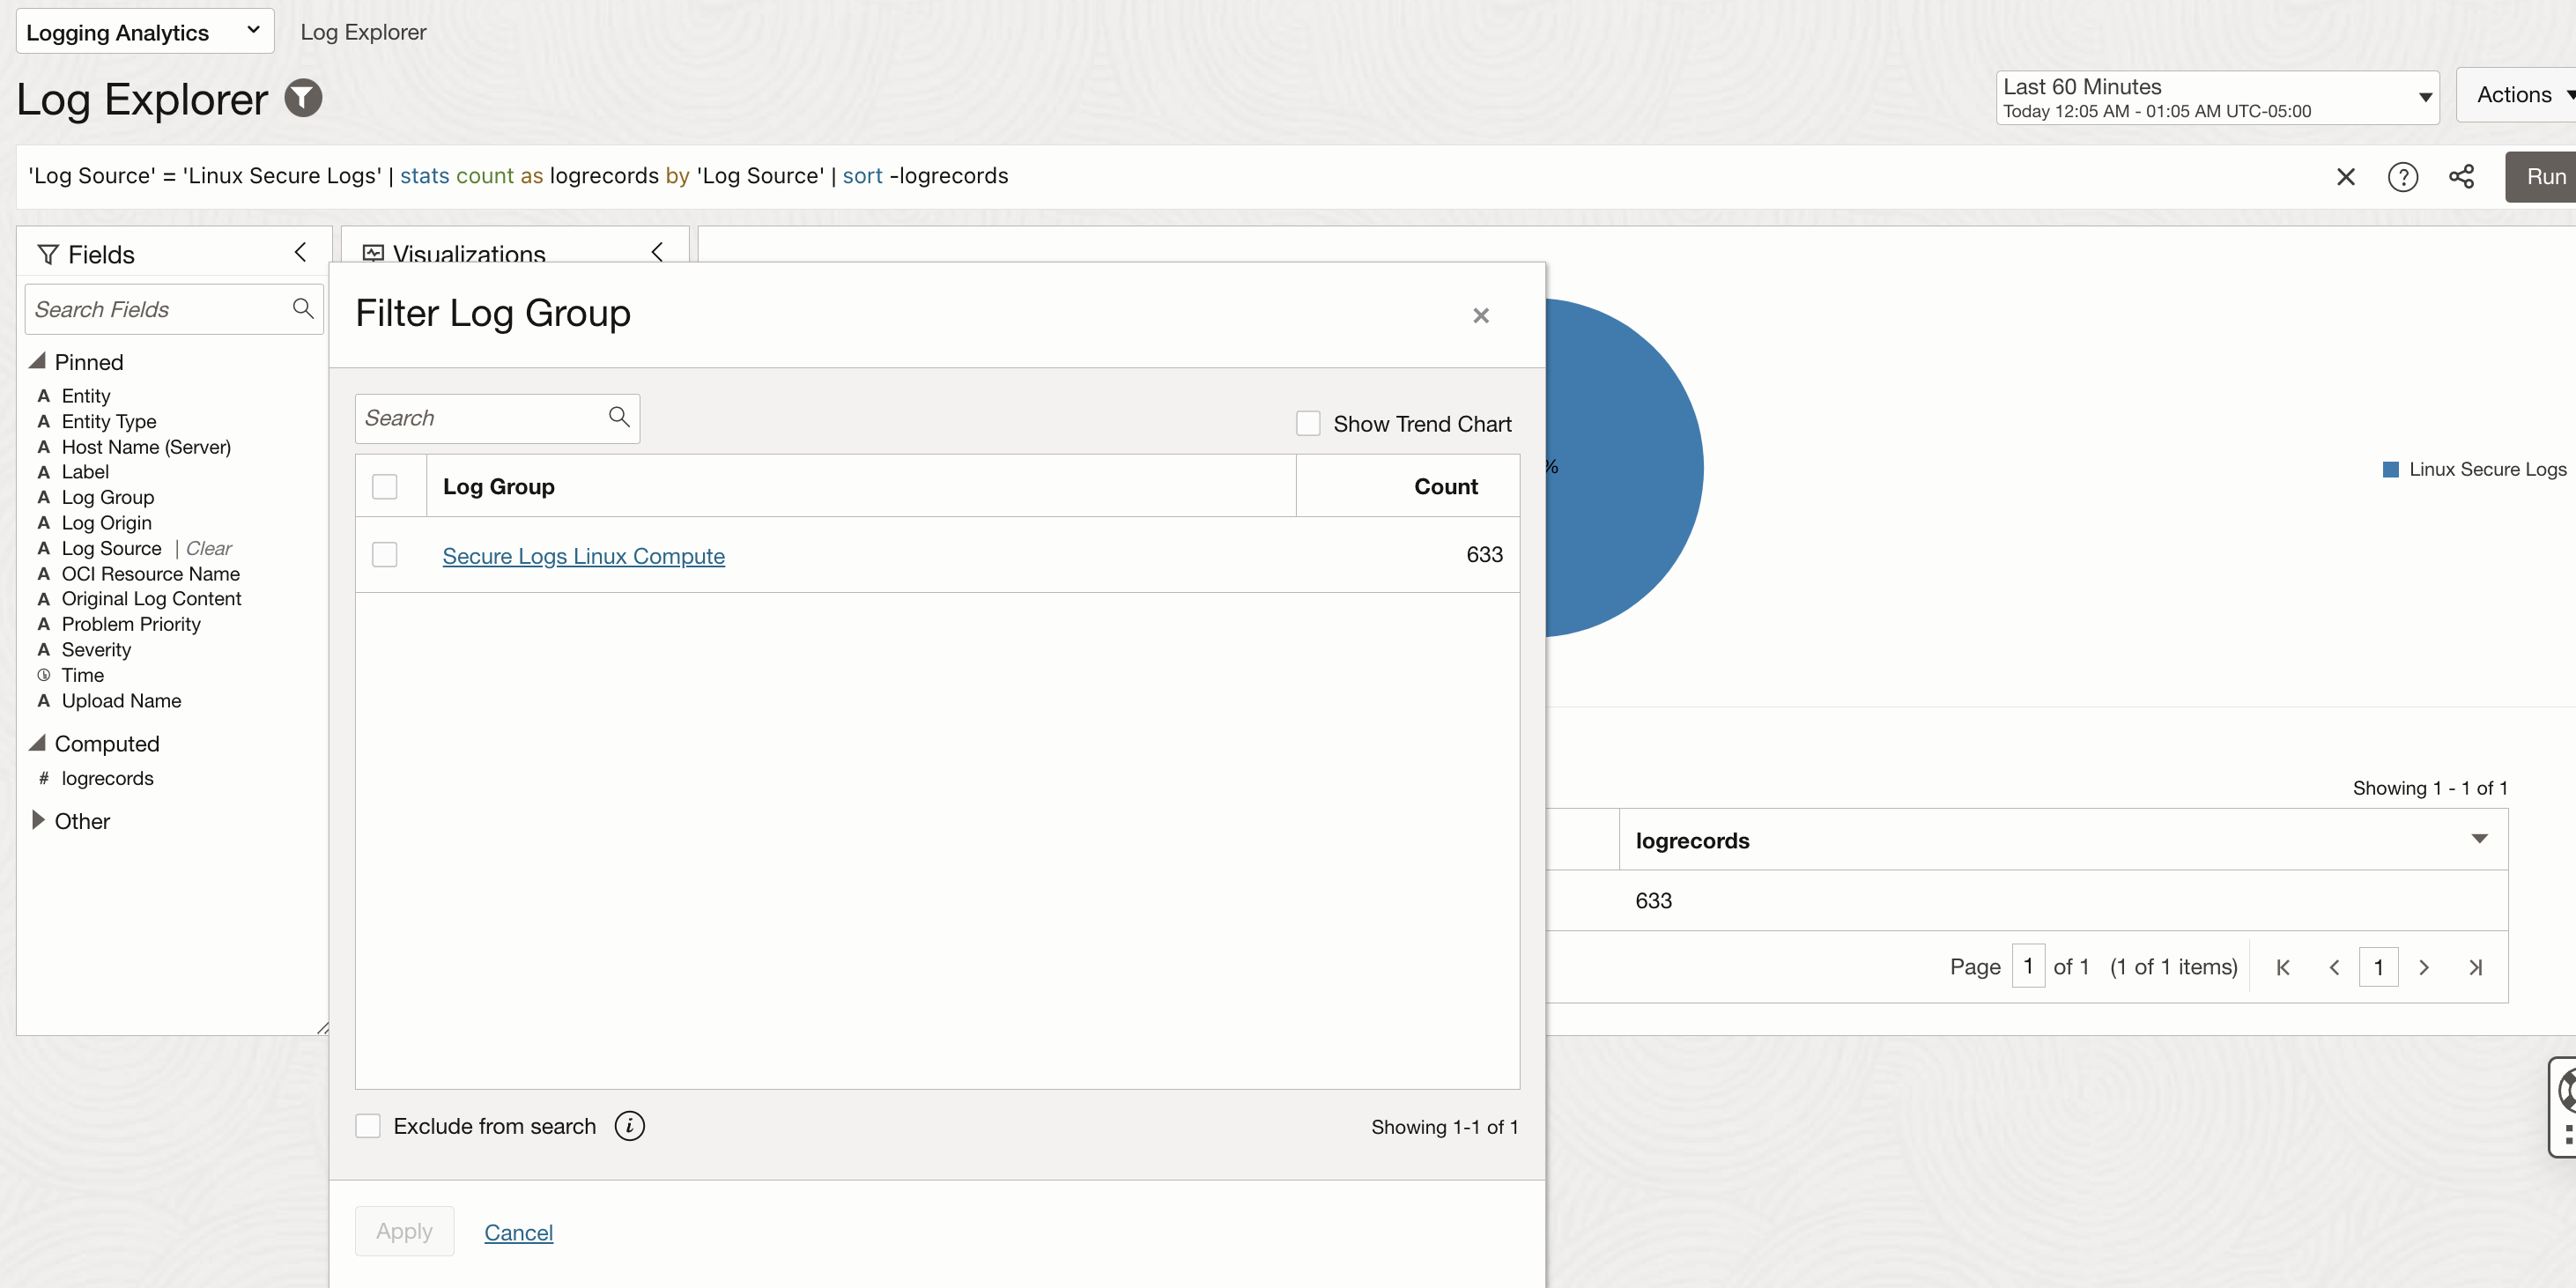
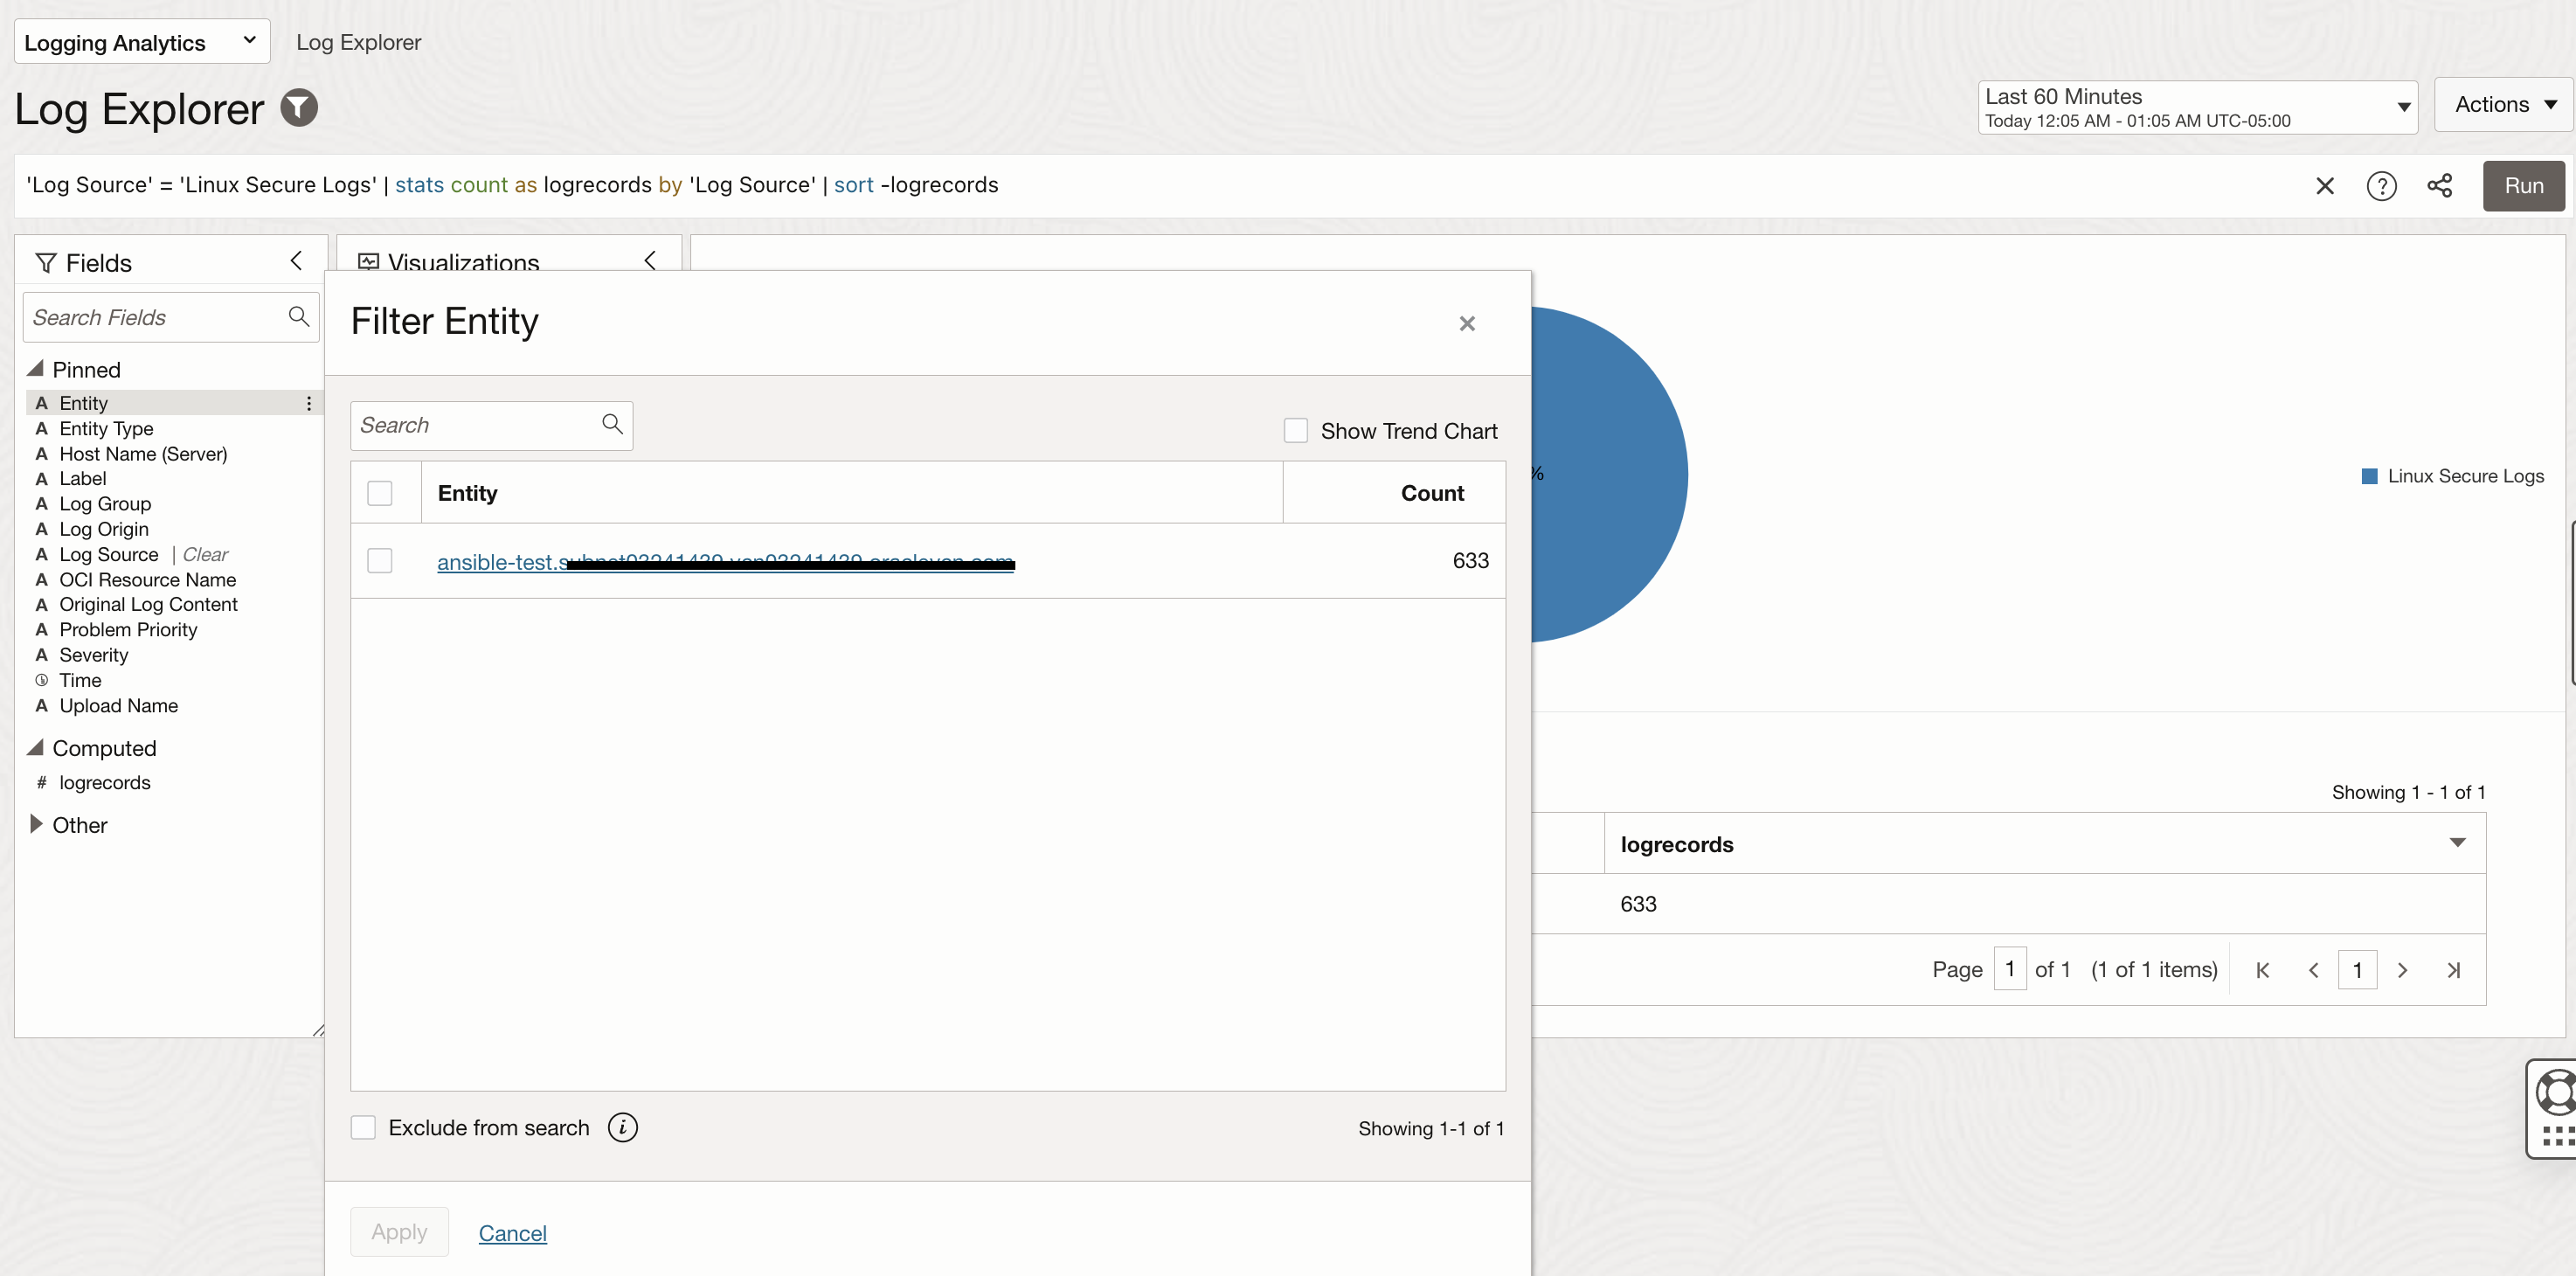
Once you click on validate and configure log collection, you will see confirmation on the next page. Log collection can be confirmed by going to the Log Explorer, checking the Log Source, Log Group and Entity.
Deriving Insights from Logs
Once your logs are securely collected, we’ll explore how to extract meaningful insights, focusing on some of the key metrics. Each of the following queries you run Log Explorer can also be saved as widgets and placed on an existing or new dashboard.
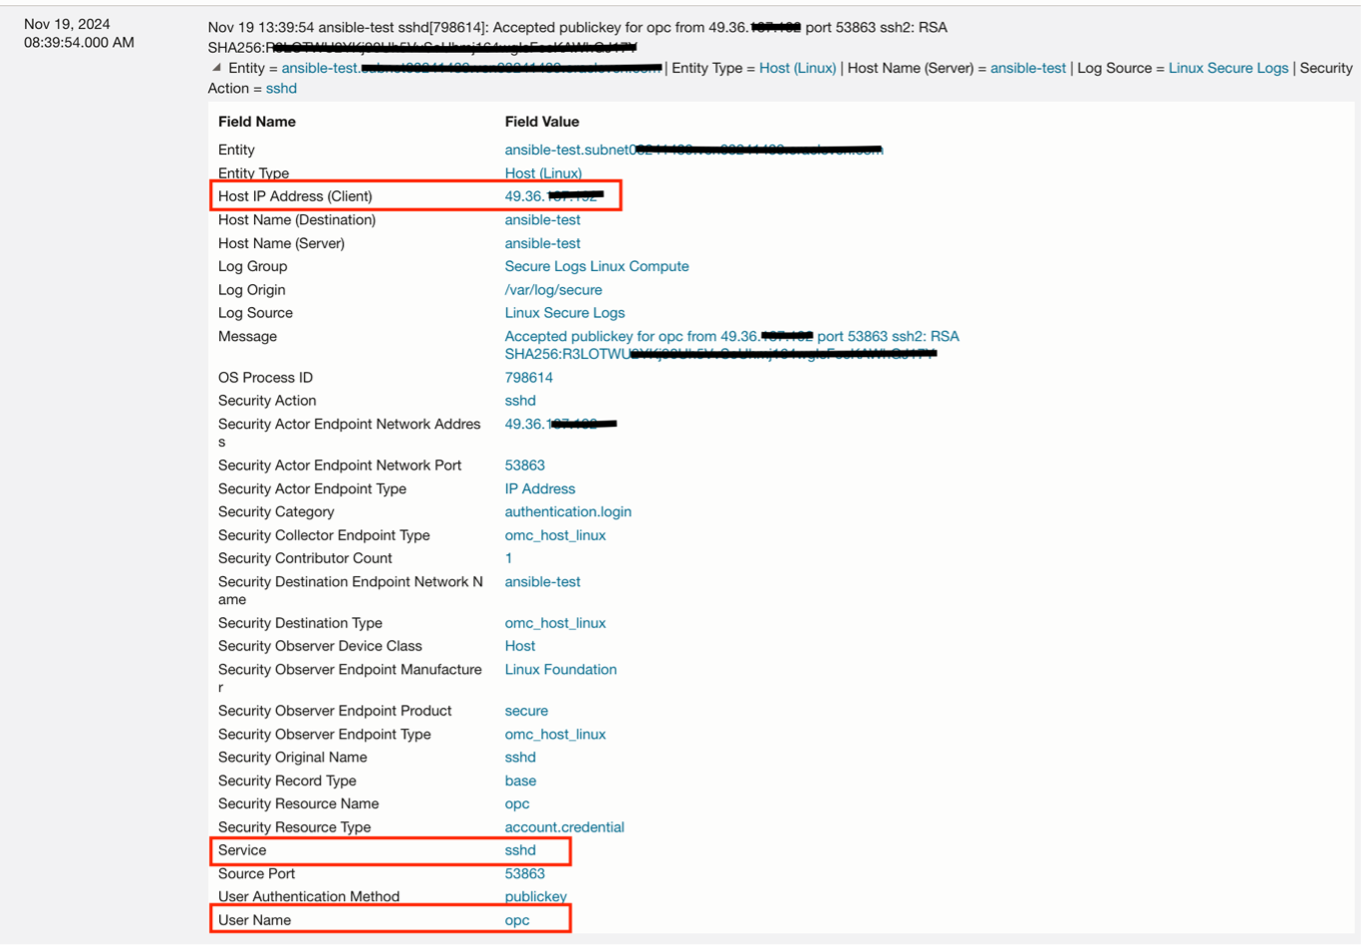
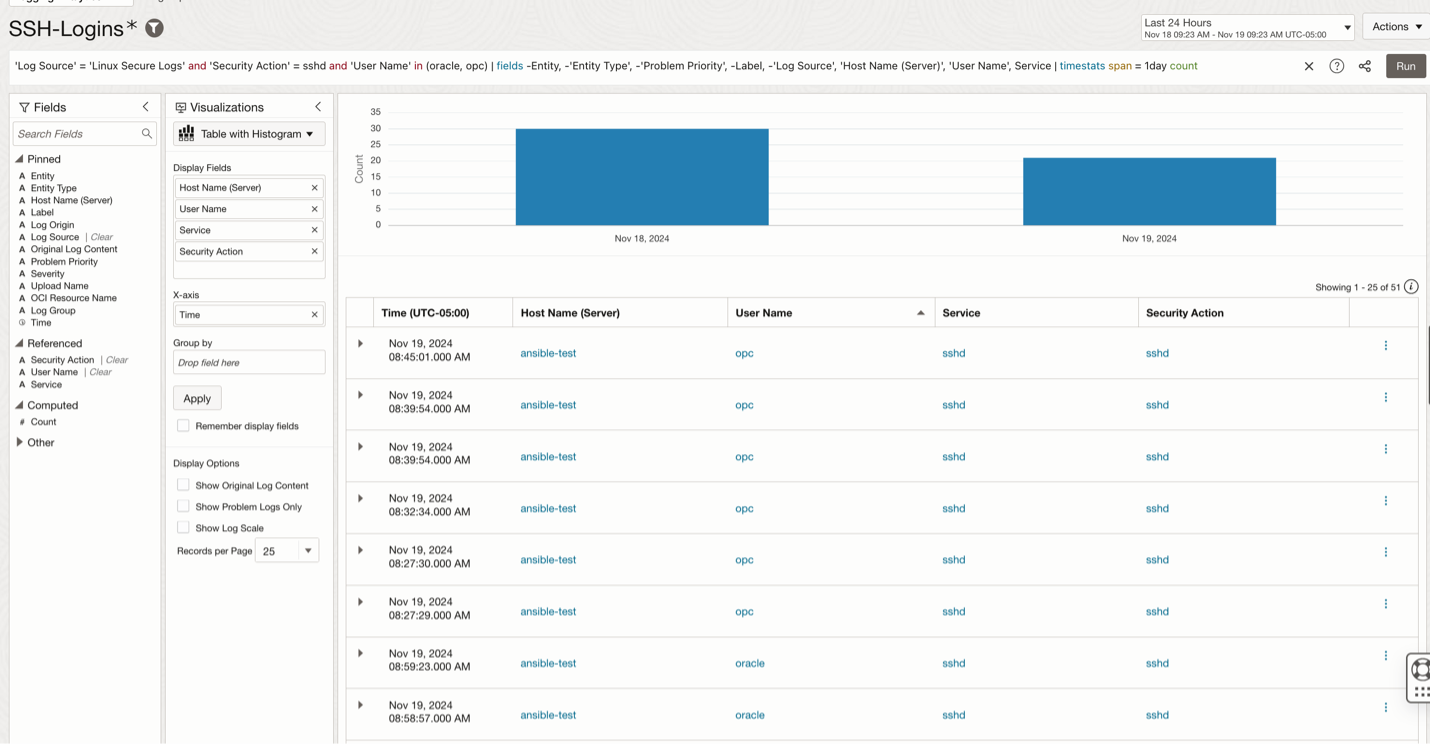
1. Successful logins: Determine details of successful logins into a compute instance. The image below shows details of a successful ssh login: Host IP Address Client, service name, username.
You can also utilize the advanced query language in Logging Analytics to efficiently search through log data. By combining the query results with various visualizations and customizing them with features like Display Fields, you can maximize the insights gained from your log data.
‘Log Source’ = ‘Linux Secure Logs’ and ‘Security Action’ = sshd | fields -Entity, -‘Entity Type’, -‘Problem Priority’, -Label, -‘Log Source’, ‘Host Name (Server)’, ‘User Name’, Service | timestats span = 1day count
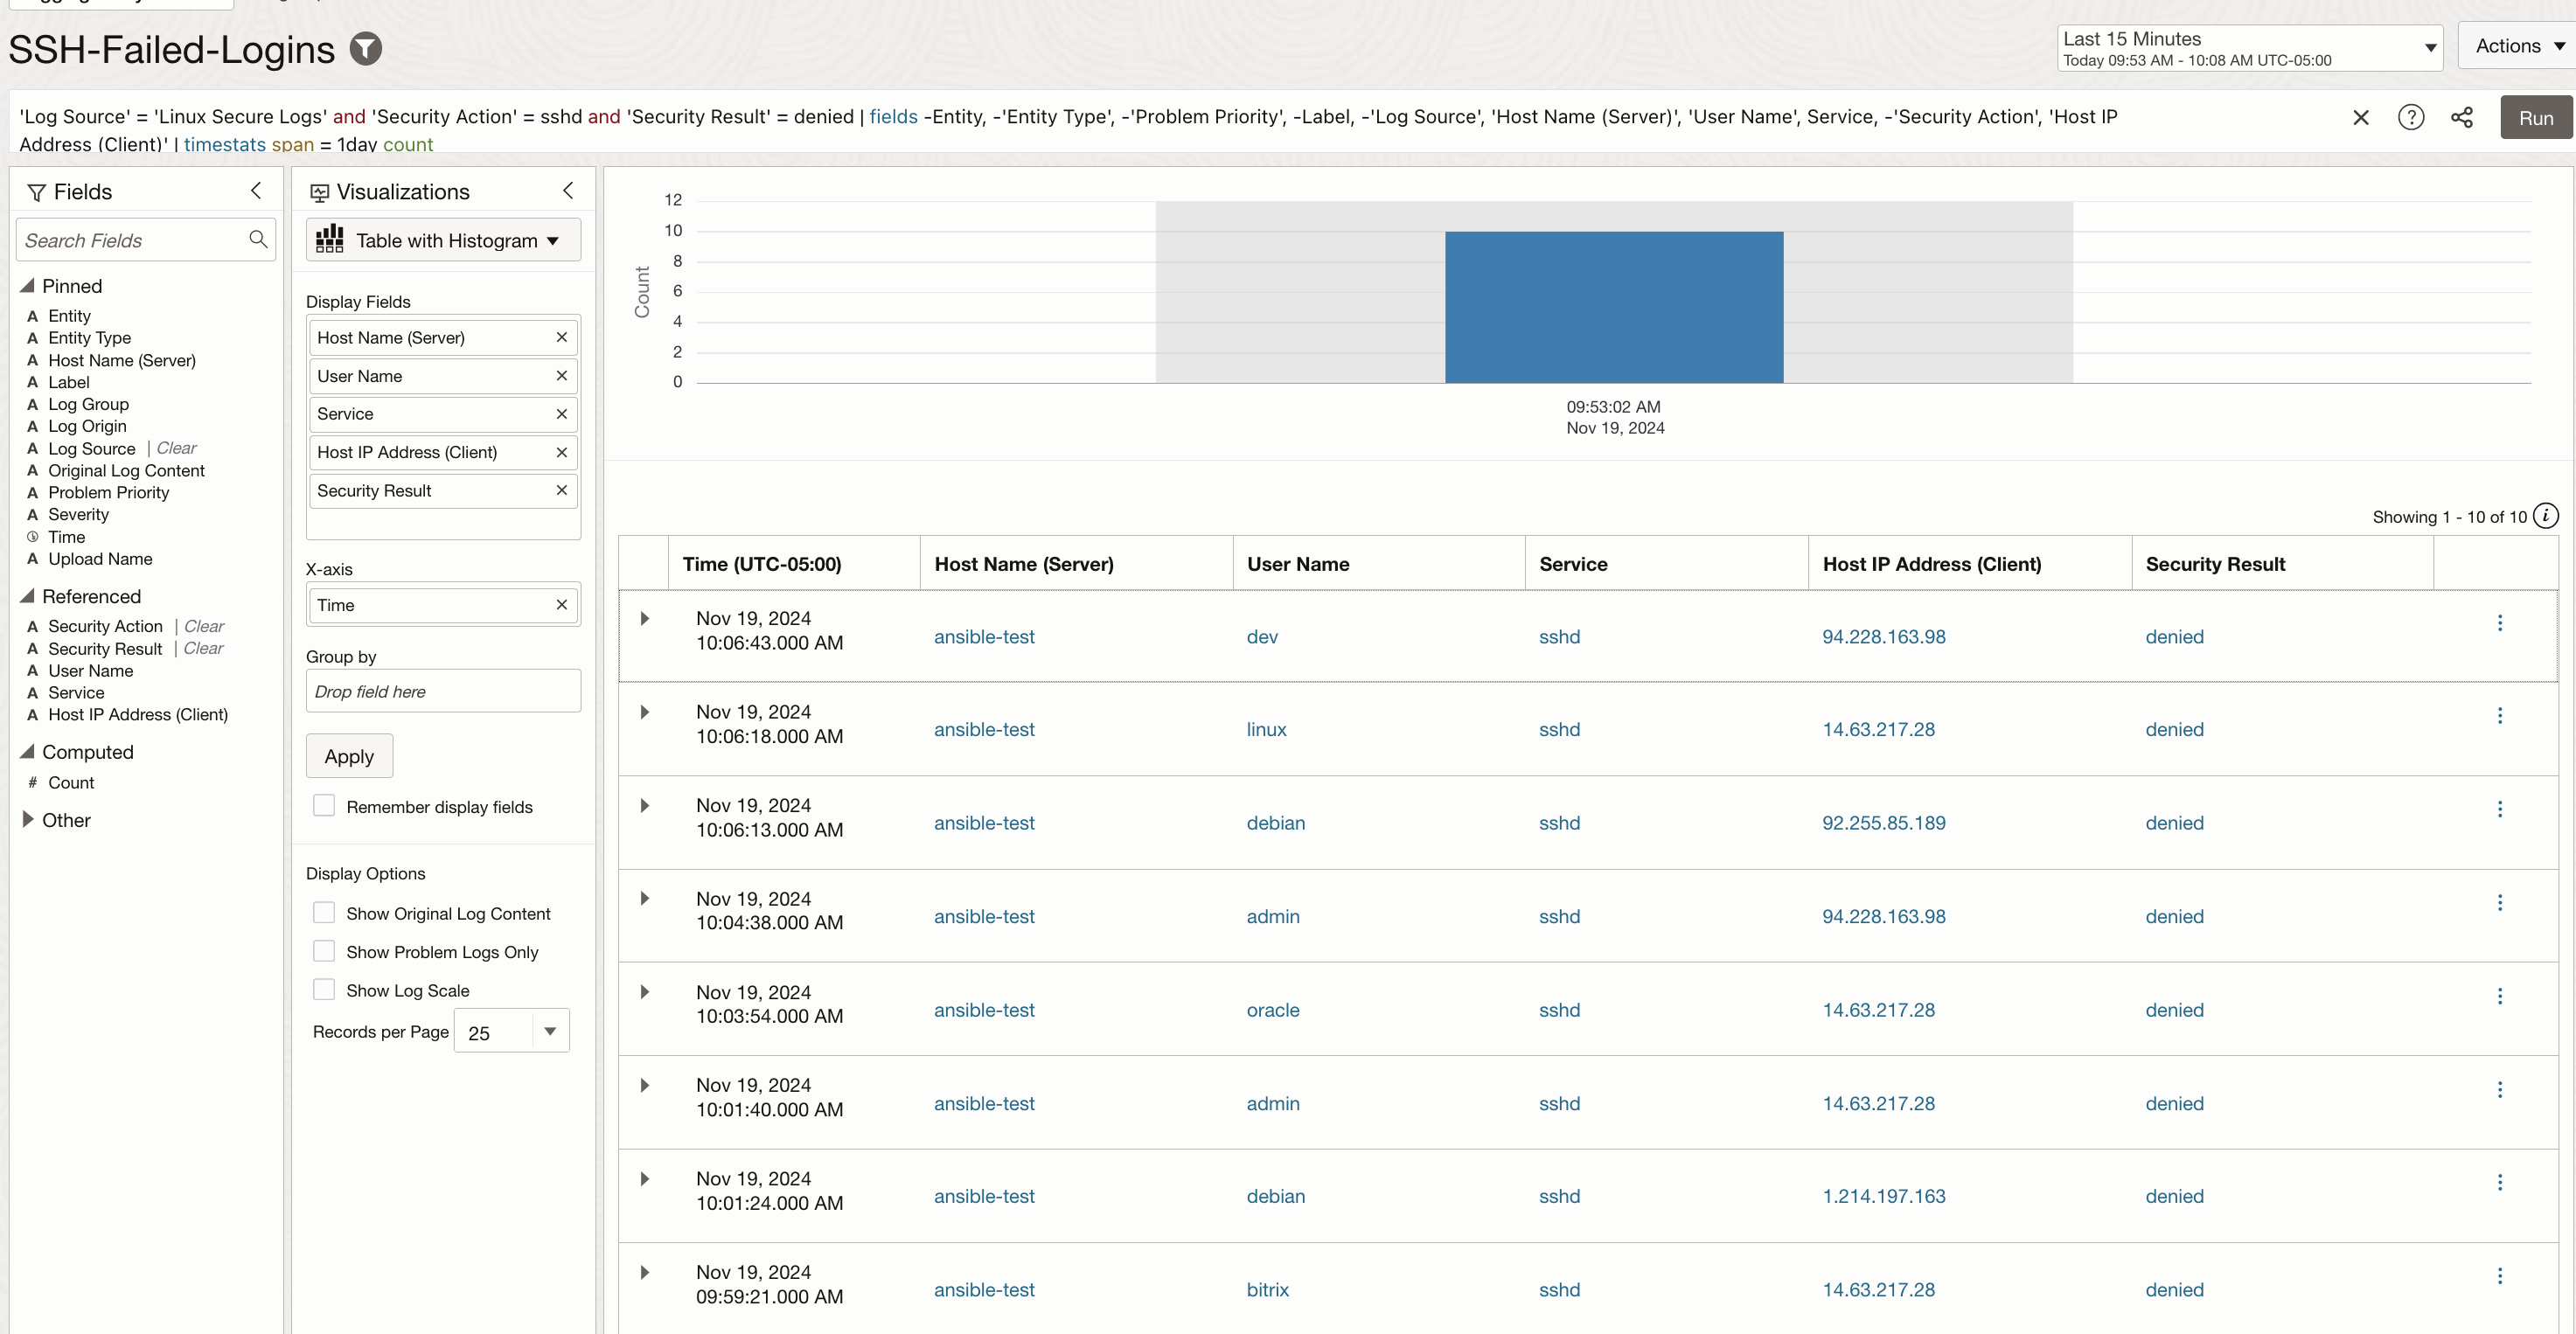
2. Failed login attempts : Similarly, the secure logs data can be used to detect the failed logins. The query in the image below looks for failed ssh login attempts and present the results in tabular format along with the histogram.
‘Log Source’ = ‘Linux Secure Logs’ and ‘Security Action’ = sshd and ‘Security Result’ = denied | fields -Entity, -‘Entity Type’, -‘Problem Priority’, -Label, -‘Log Source’, ‘Host Name (Server)’, ‘User Name’, Service, -‘Security Action’, ‘Host IP Address (Client)’ | timestats span = 1day count
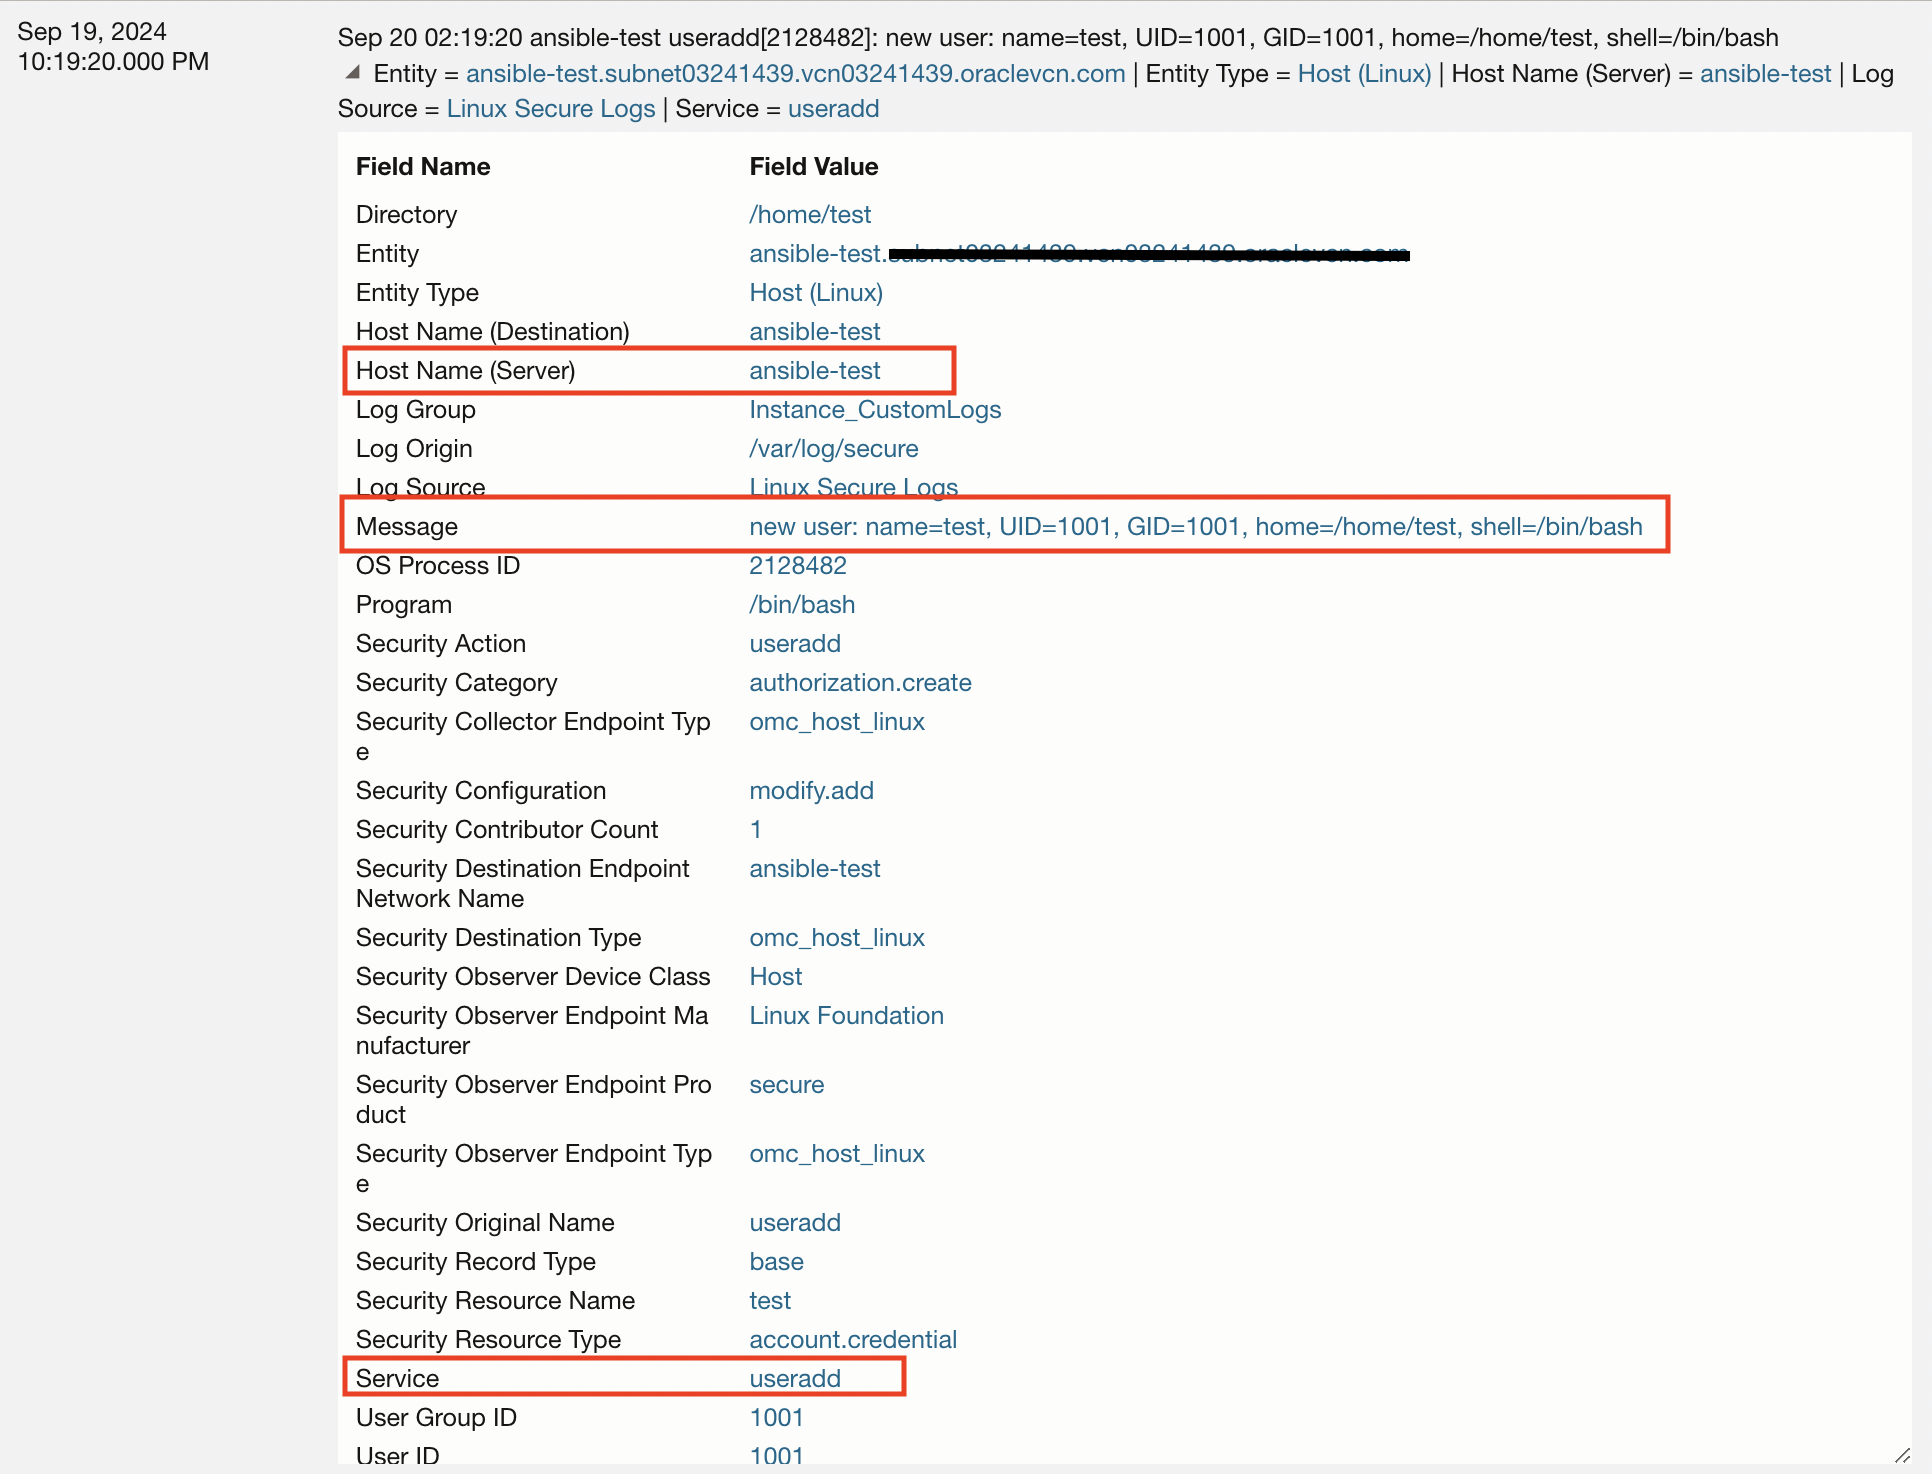
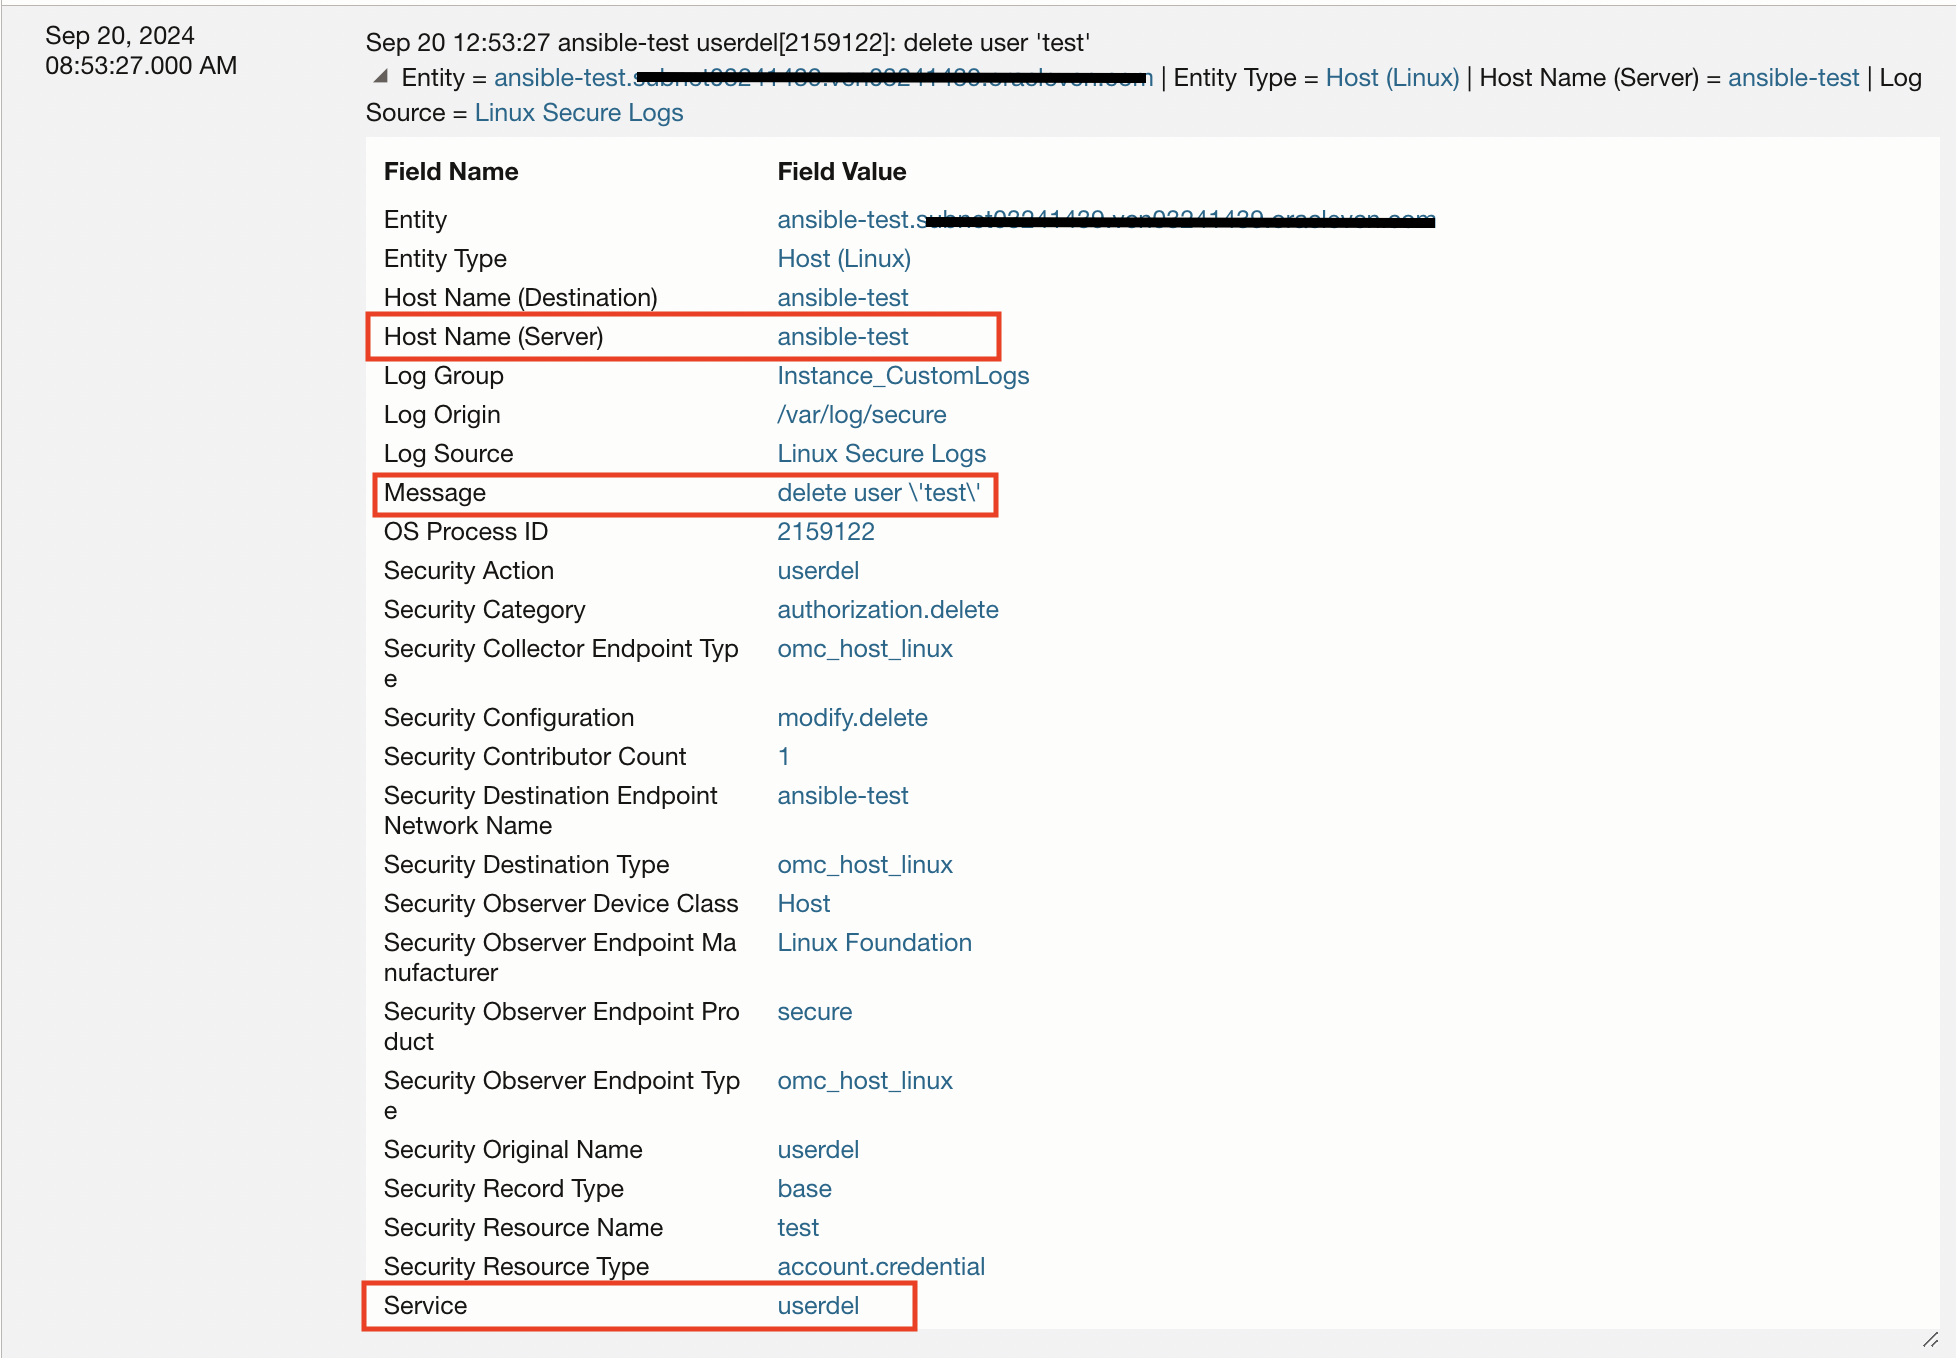
3. User Creation/Deletion: Tracking user creation and deletion on a Linux server is essential to bolster security, maintain compliance, and ensure operational continuity. This information can be obtained from secure logs as well.
4. Sudo Command Usage: Tracking the usage of sudo commands on a Linux server is essential for maintaining security, accountability, and operational integrity. The sudo command grants elevated privileges, allowing users to execute critical or potentially destructive actions. Monitoring its usage ensures that privileged commands are used appropriately and only by authorized personnel, minimizing the risk of accidental misconfigurations or malicious activity. This proactive approach enhances overall system security and facilitates troubleshooting in case of incidents.
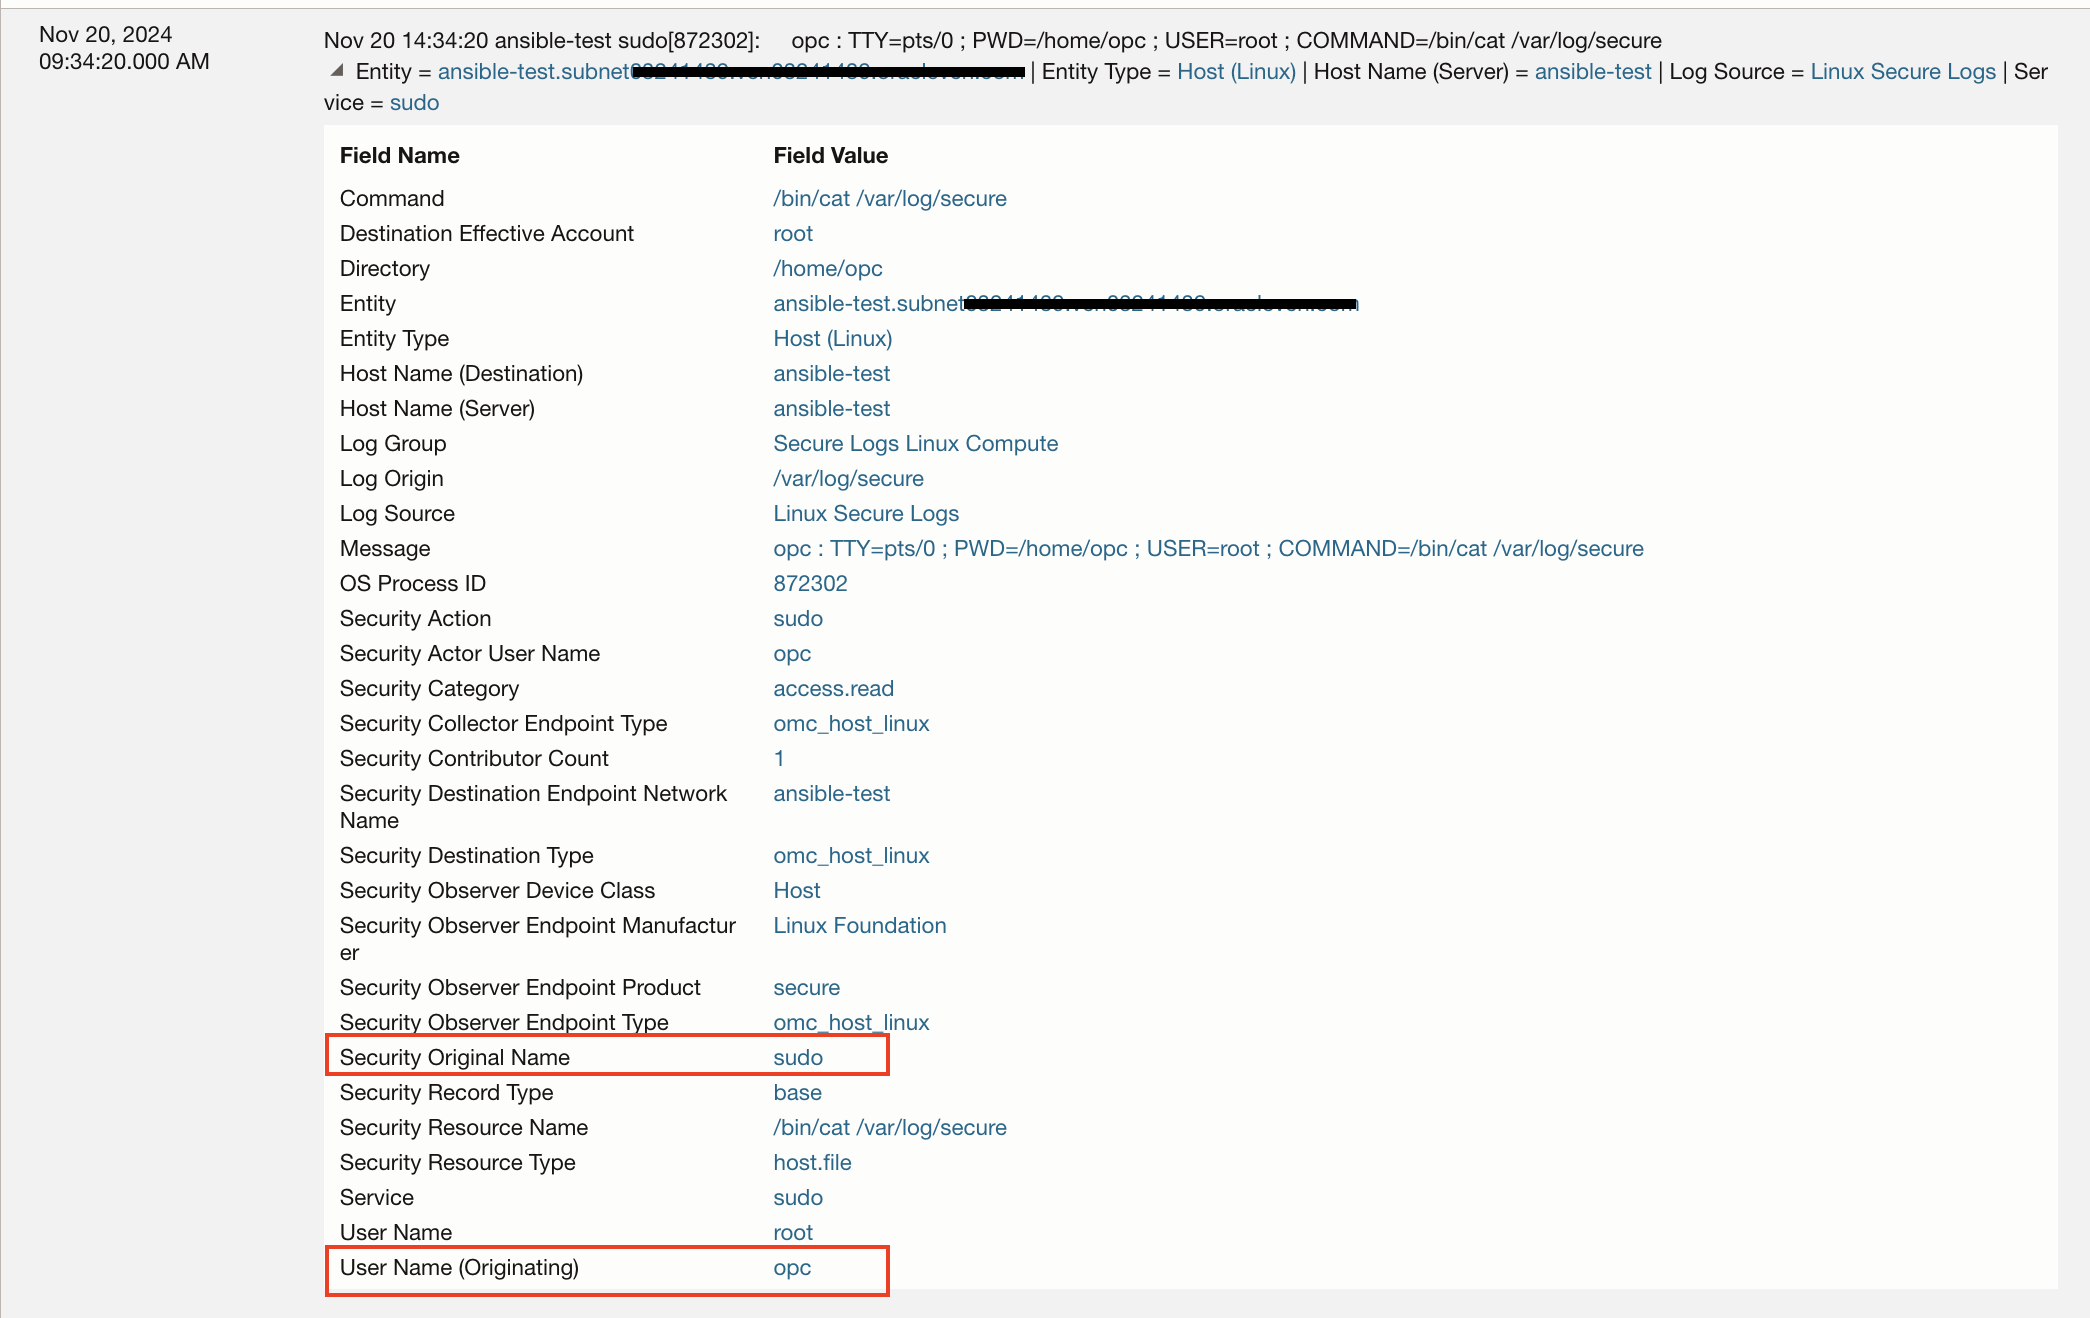
For example: some important actions such as Iptables commands that are used to modify firewall rules can be tracked by monitoring sudo usage.
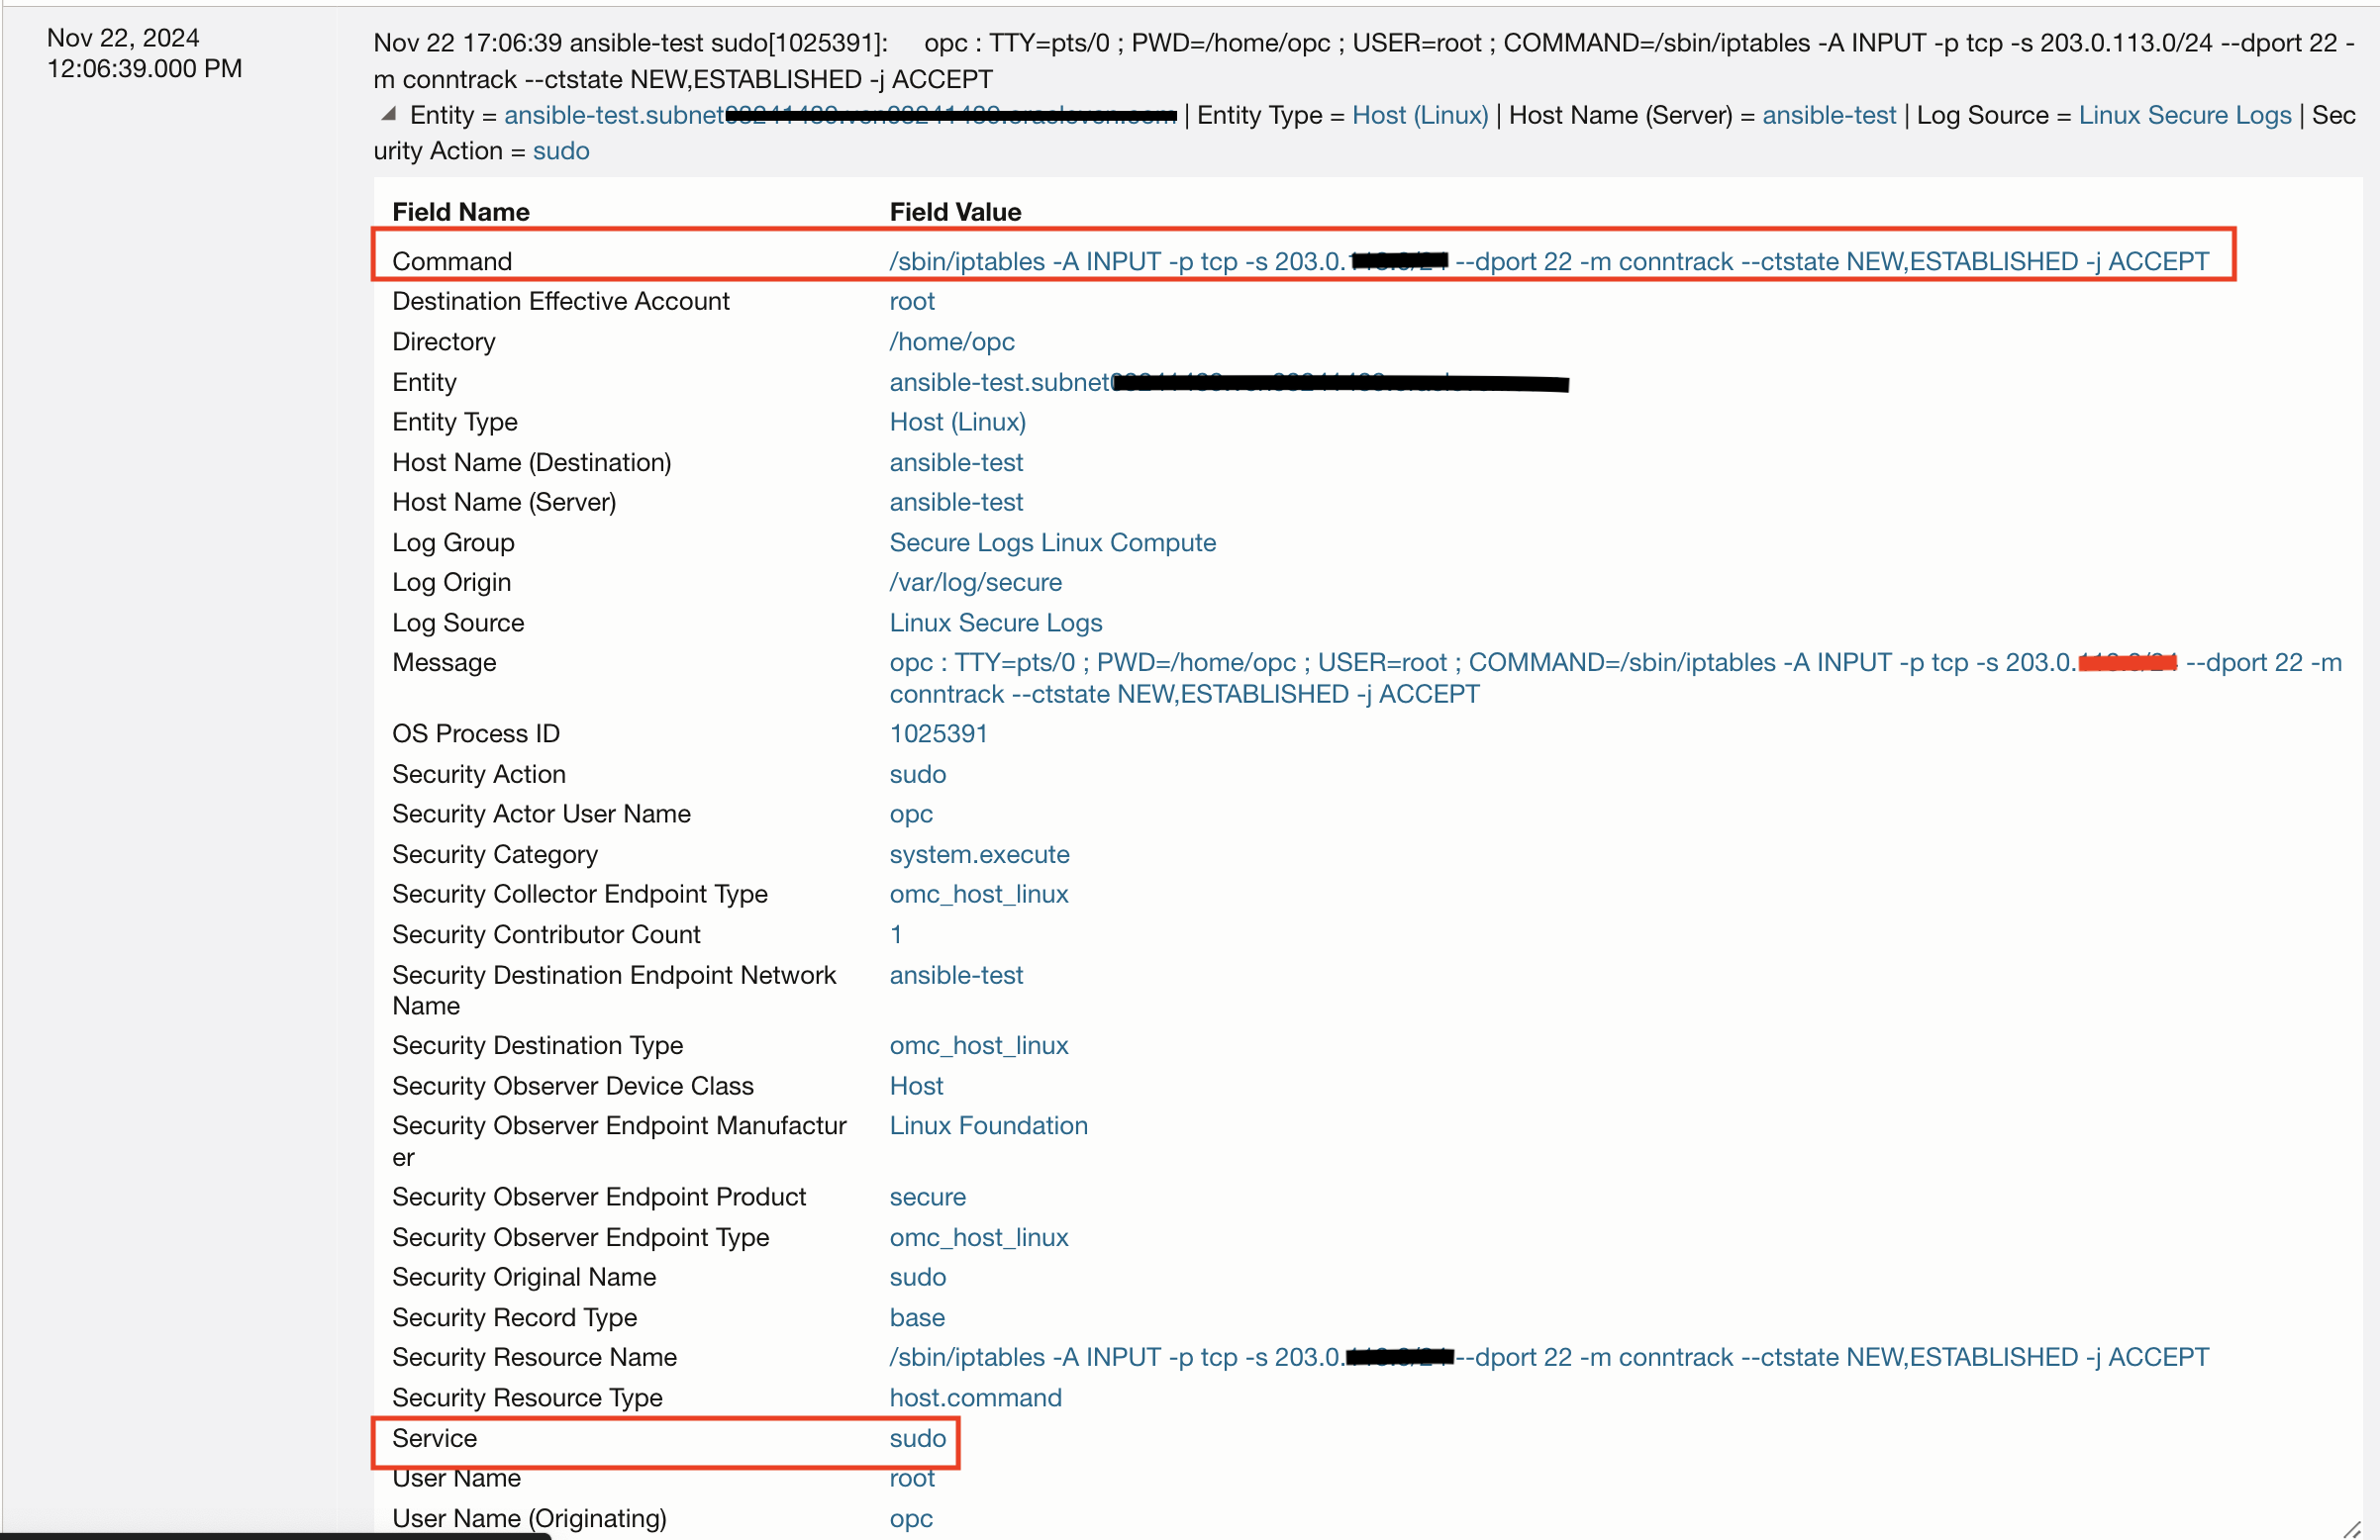
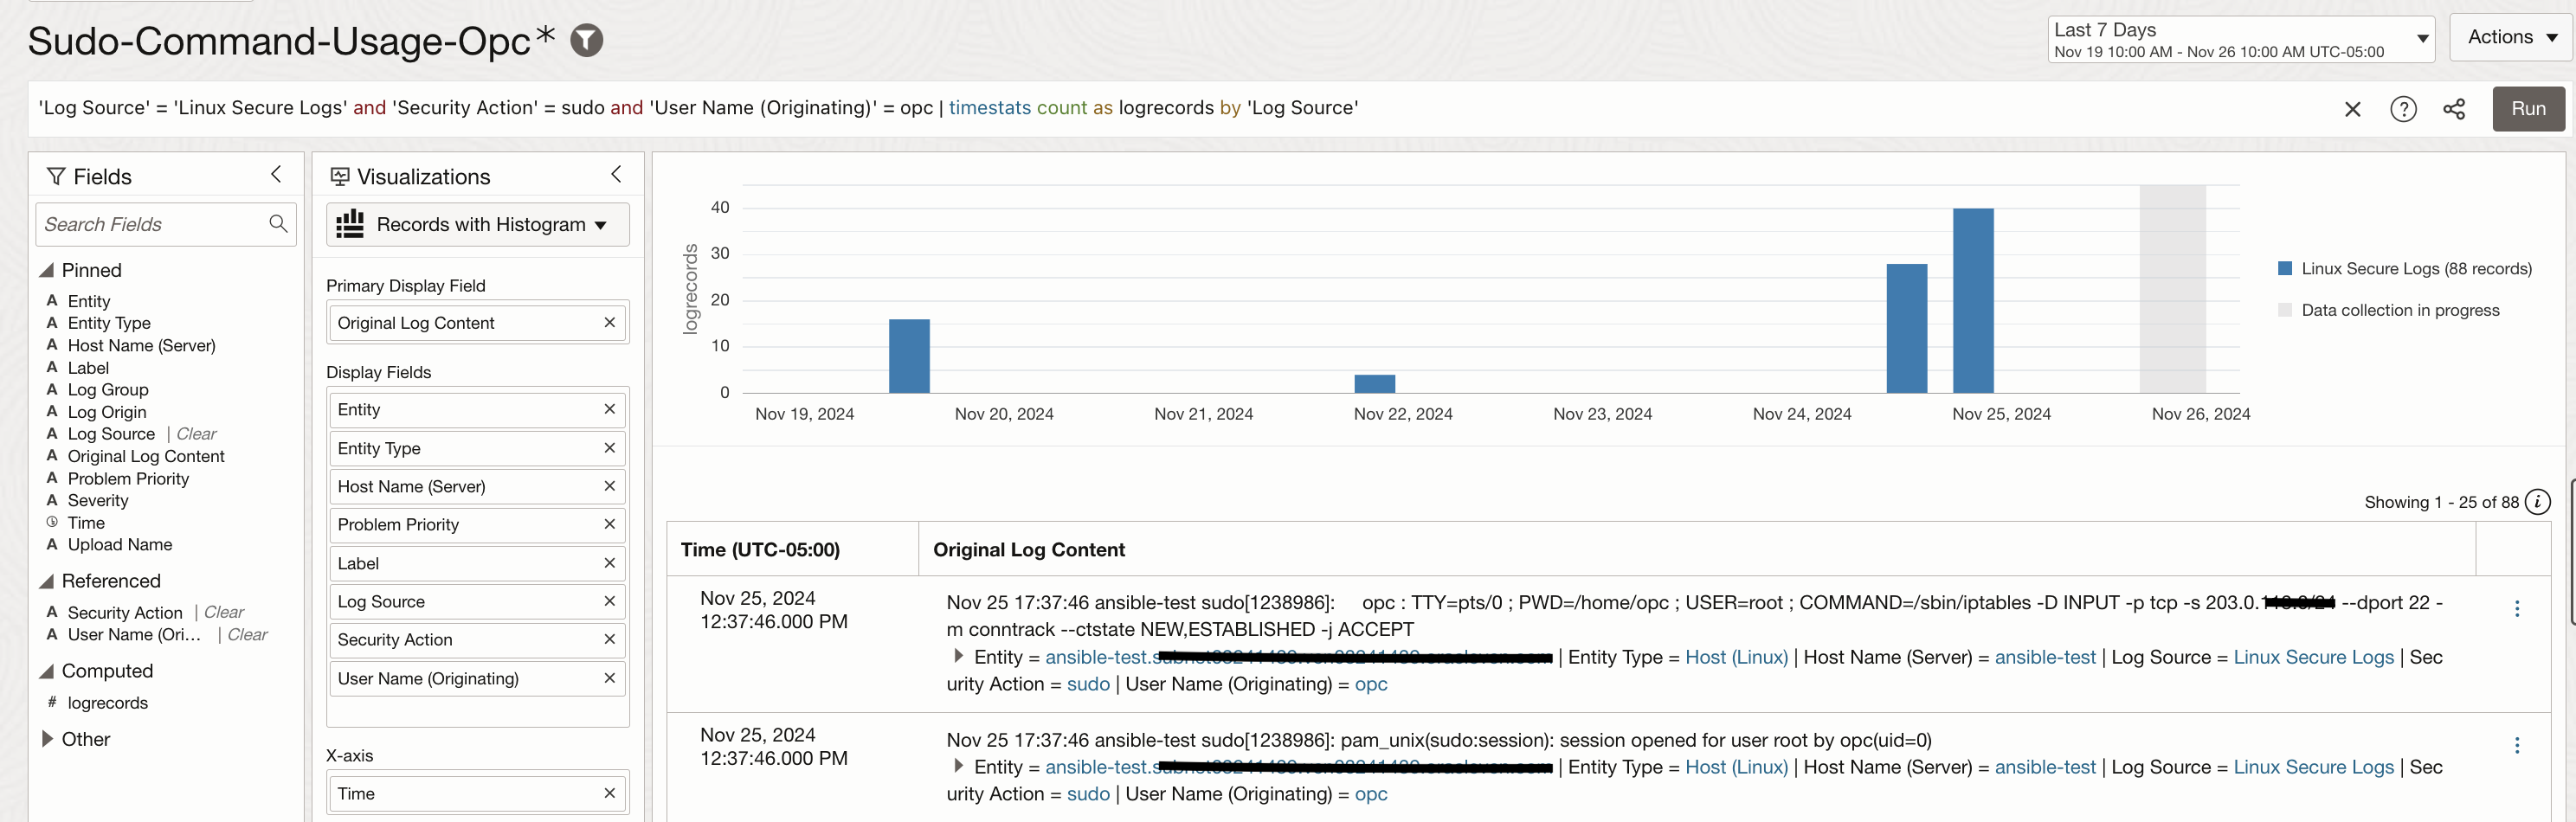
A widget can be created to record sudo command usage for a specific user such as opc.
‘Log Source’ = ‘Linux Secure Logs’ and ‘Security Action’ = sudo and ‘User Name (Originating)’ = opc | timestats count(‘Security Action’) as ‘Sudo Command Usage’
Acting on Log Insights
Logging Analytics enable you to take actions on the collected log data such as send notifications or create a dashboard by adding custom widgets. You can create Detection Rule on the saved search to capture the log activity and send alerts through OCI Monitoring & Notifications service.
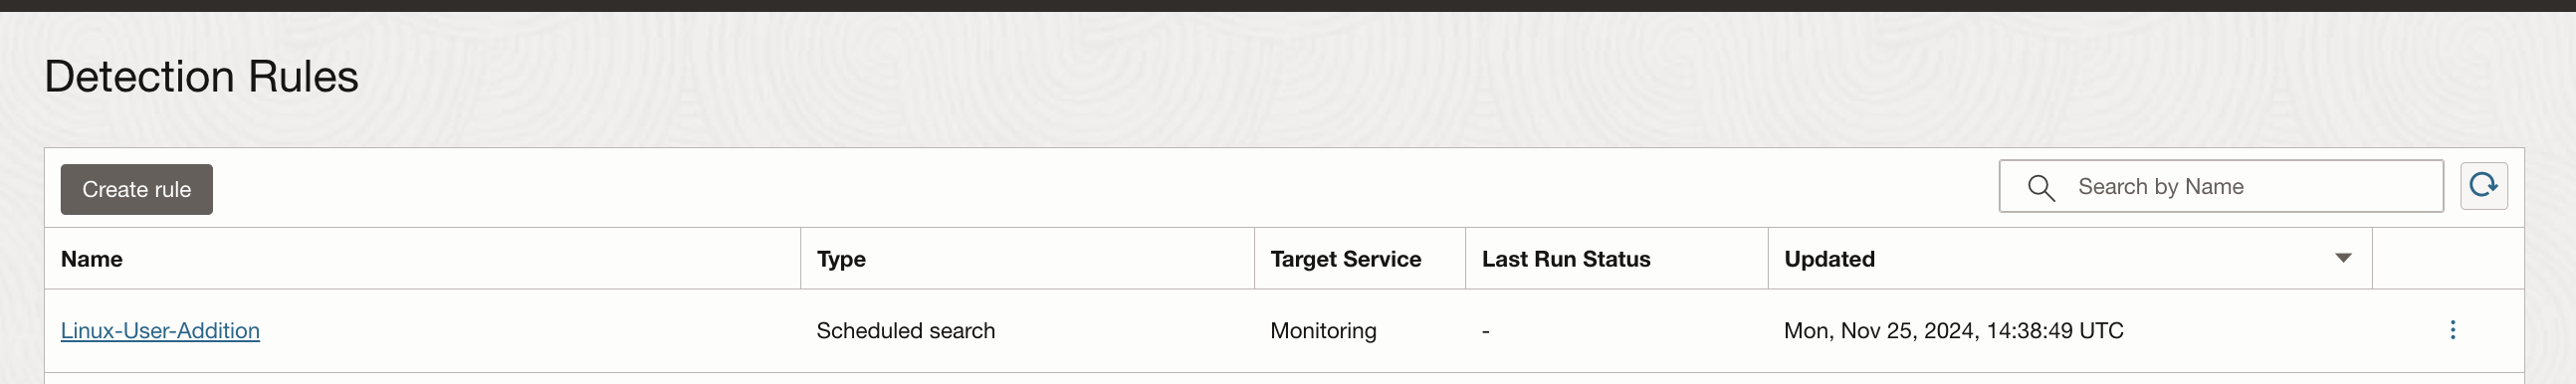
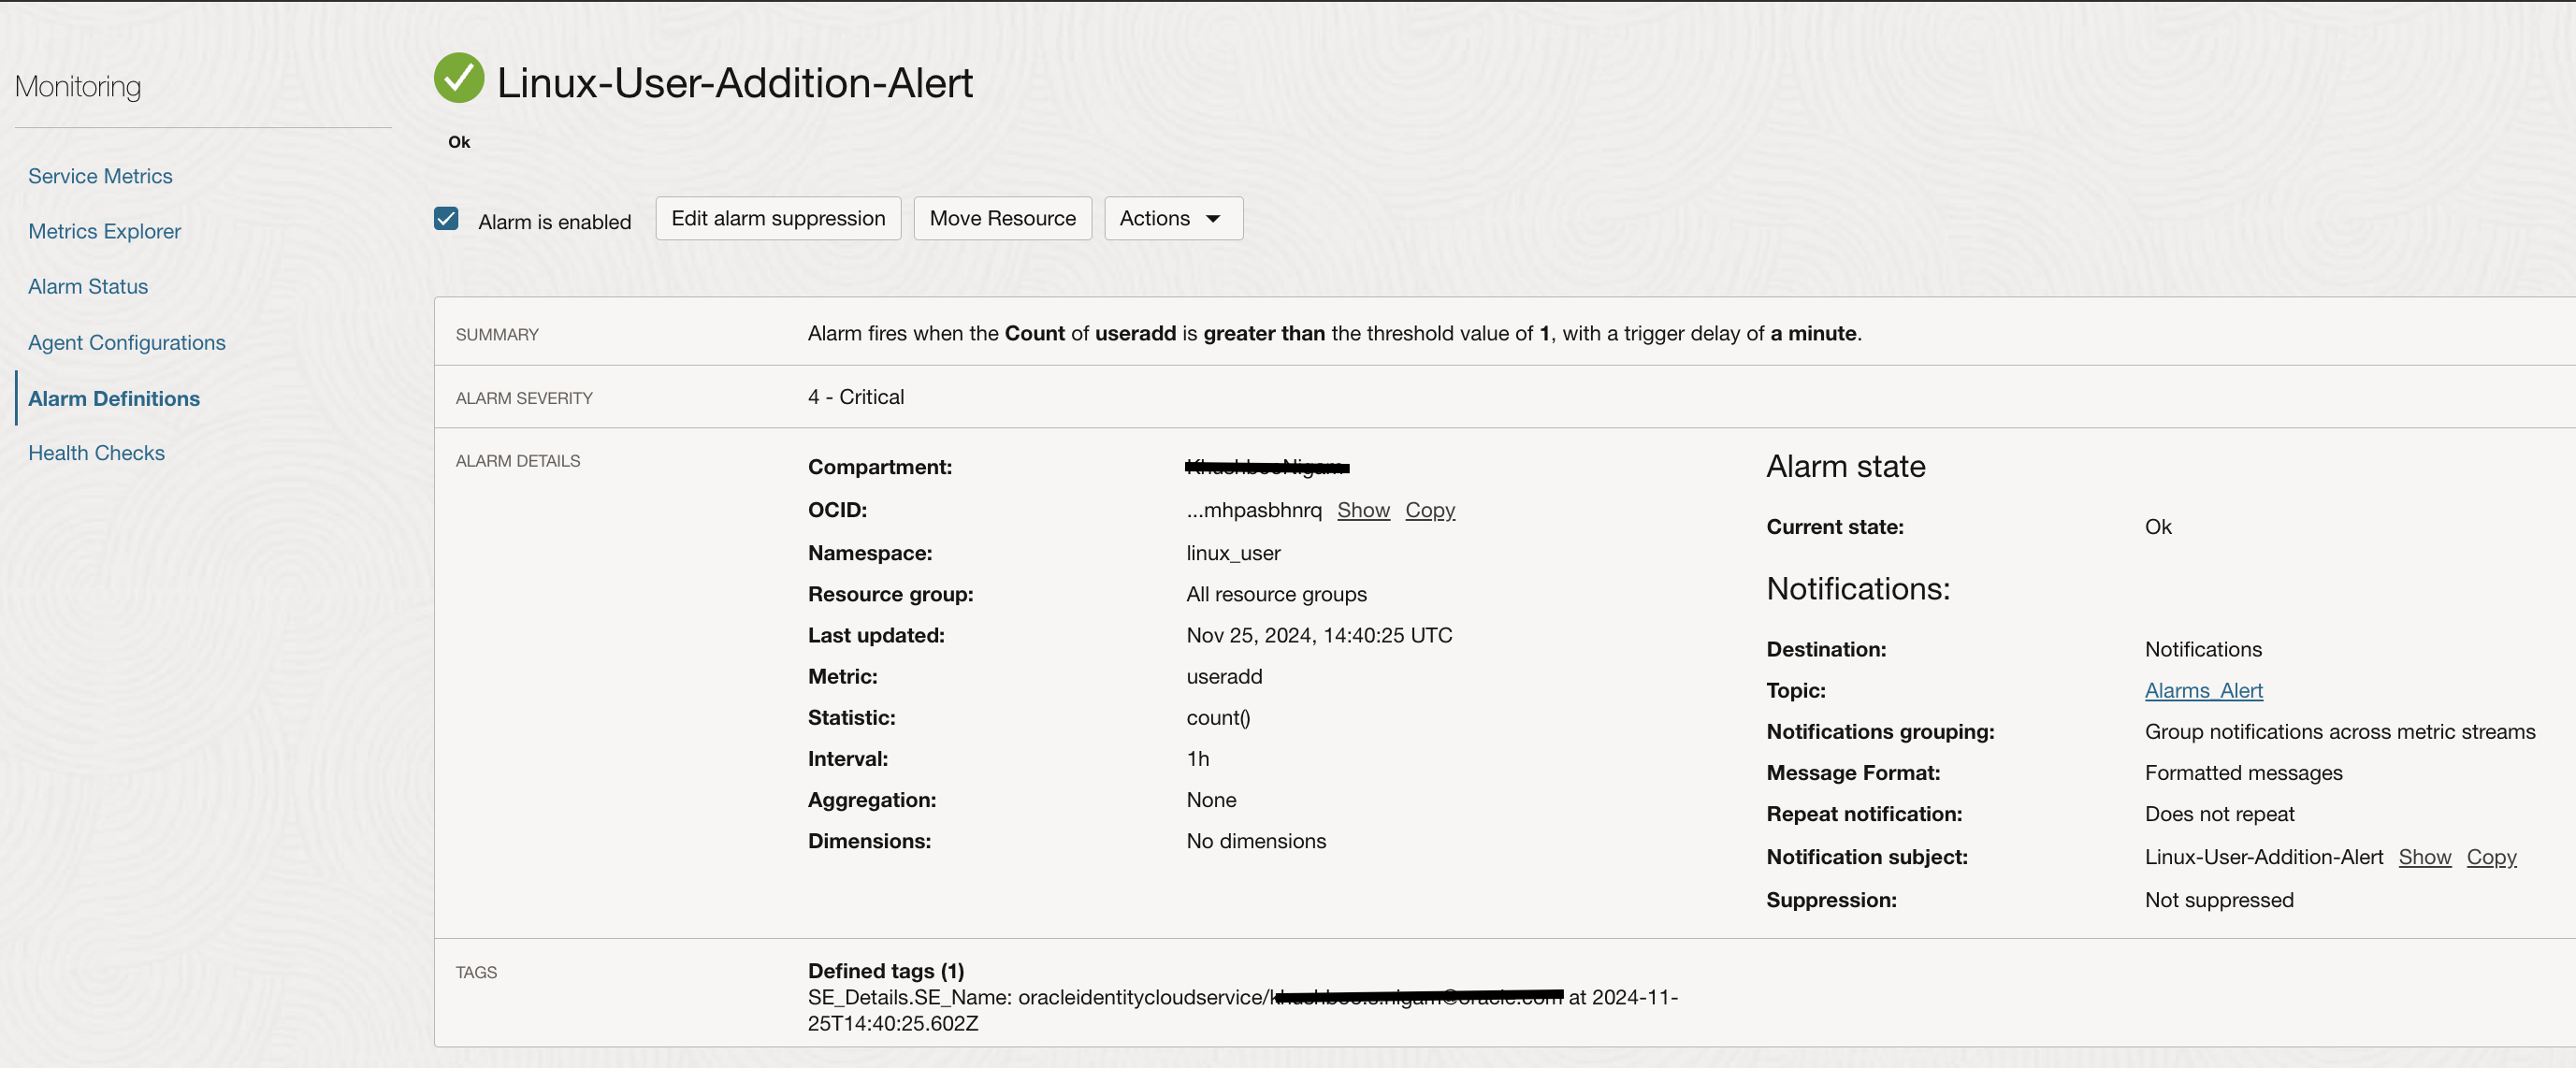
Once a user is added to the linux instance, the detection rule will execute based on the defined time, capture this activity and post it as a metric in the OCI Monitoring service. These results can be seen at the Detection Rule page.
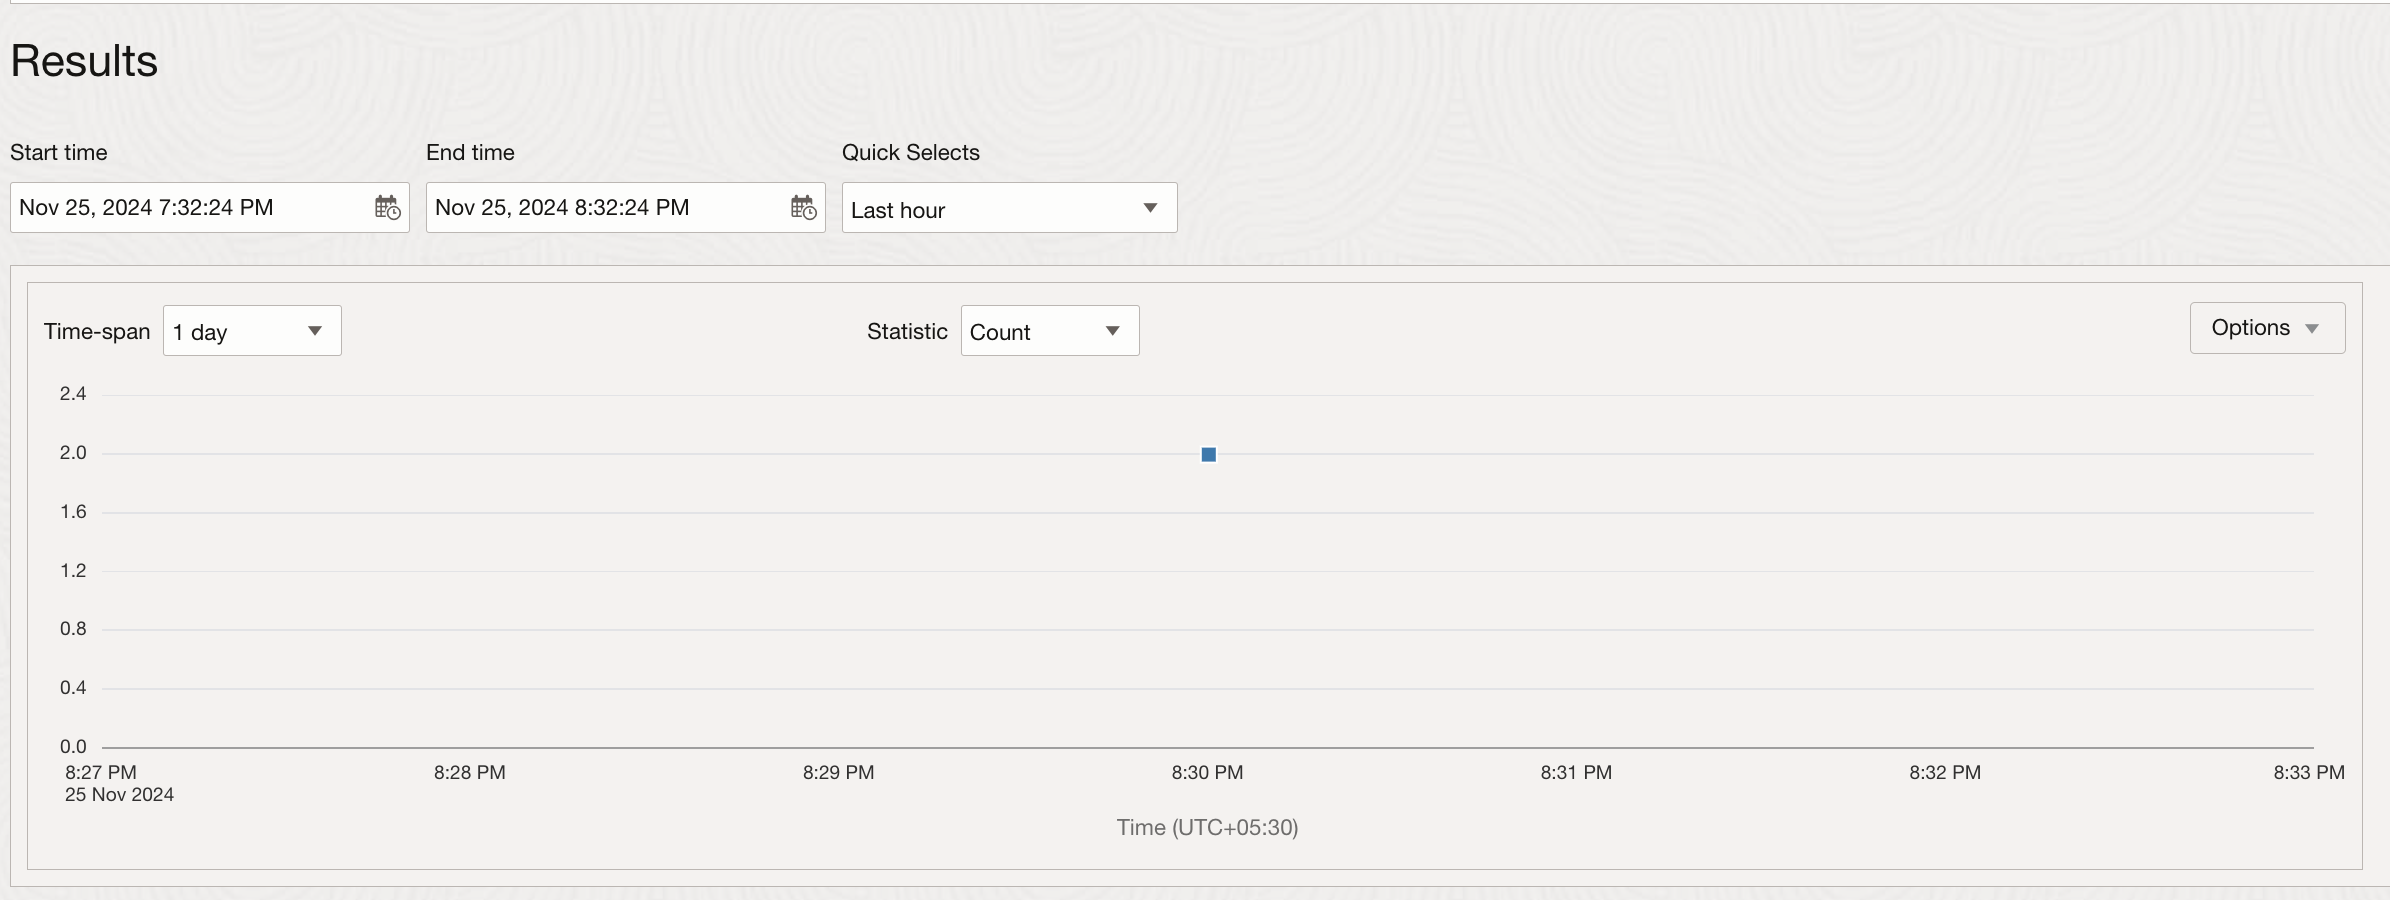
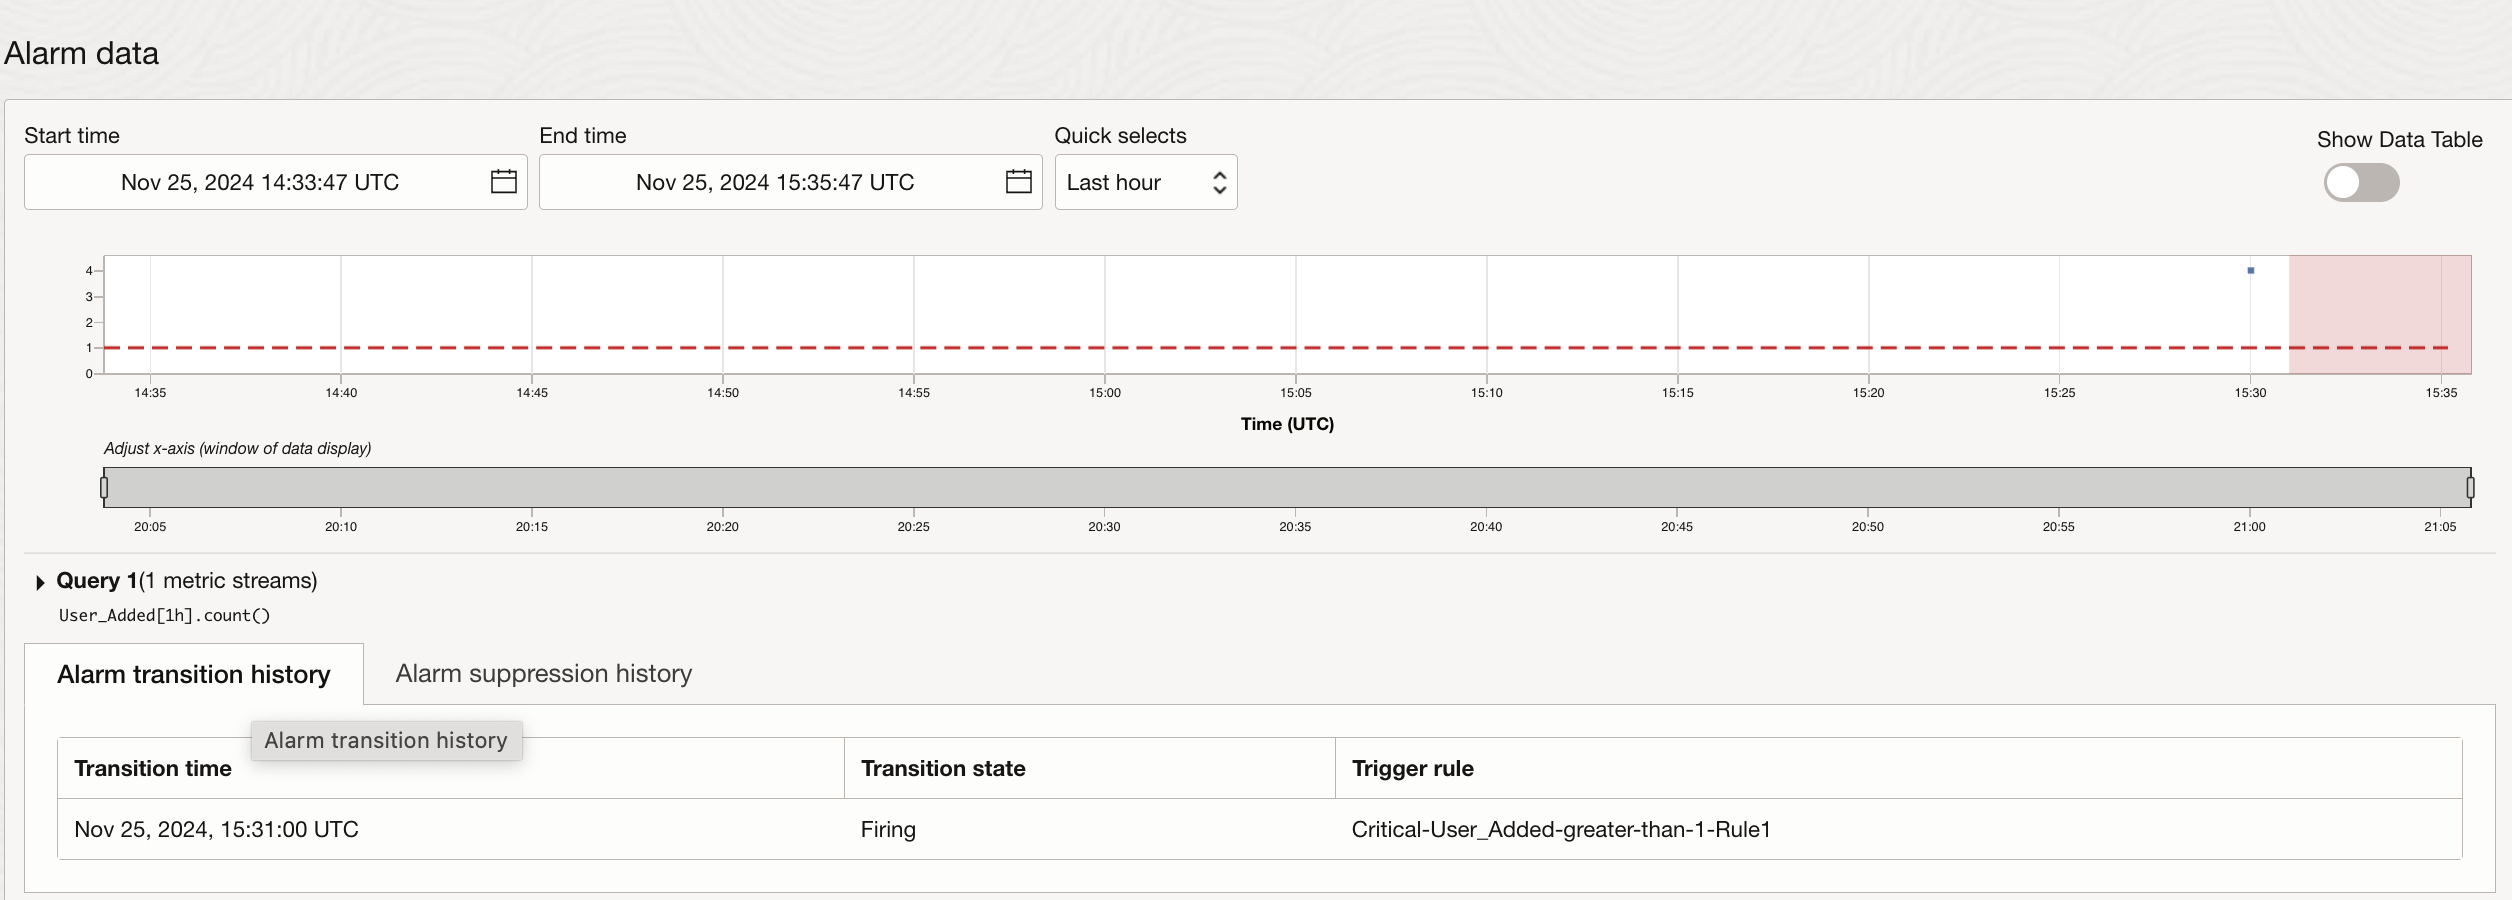
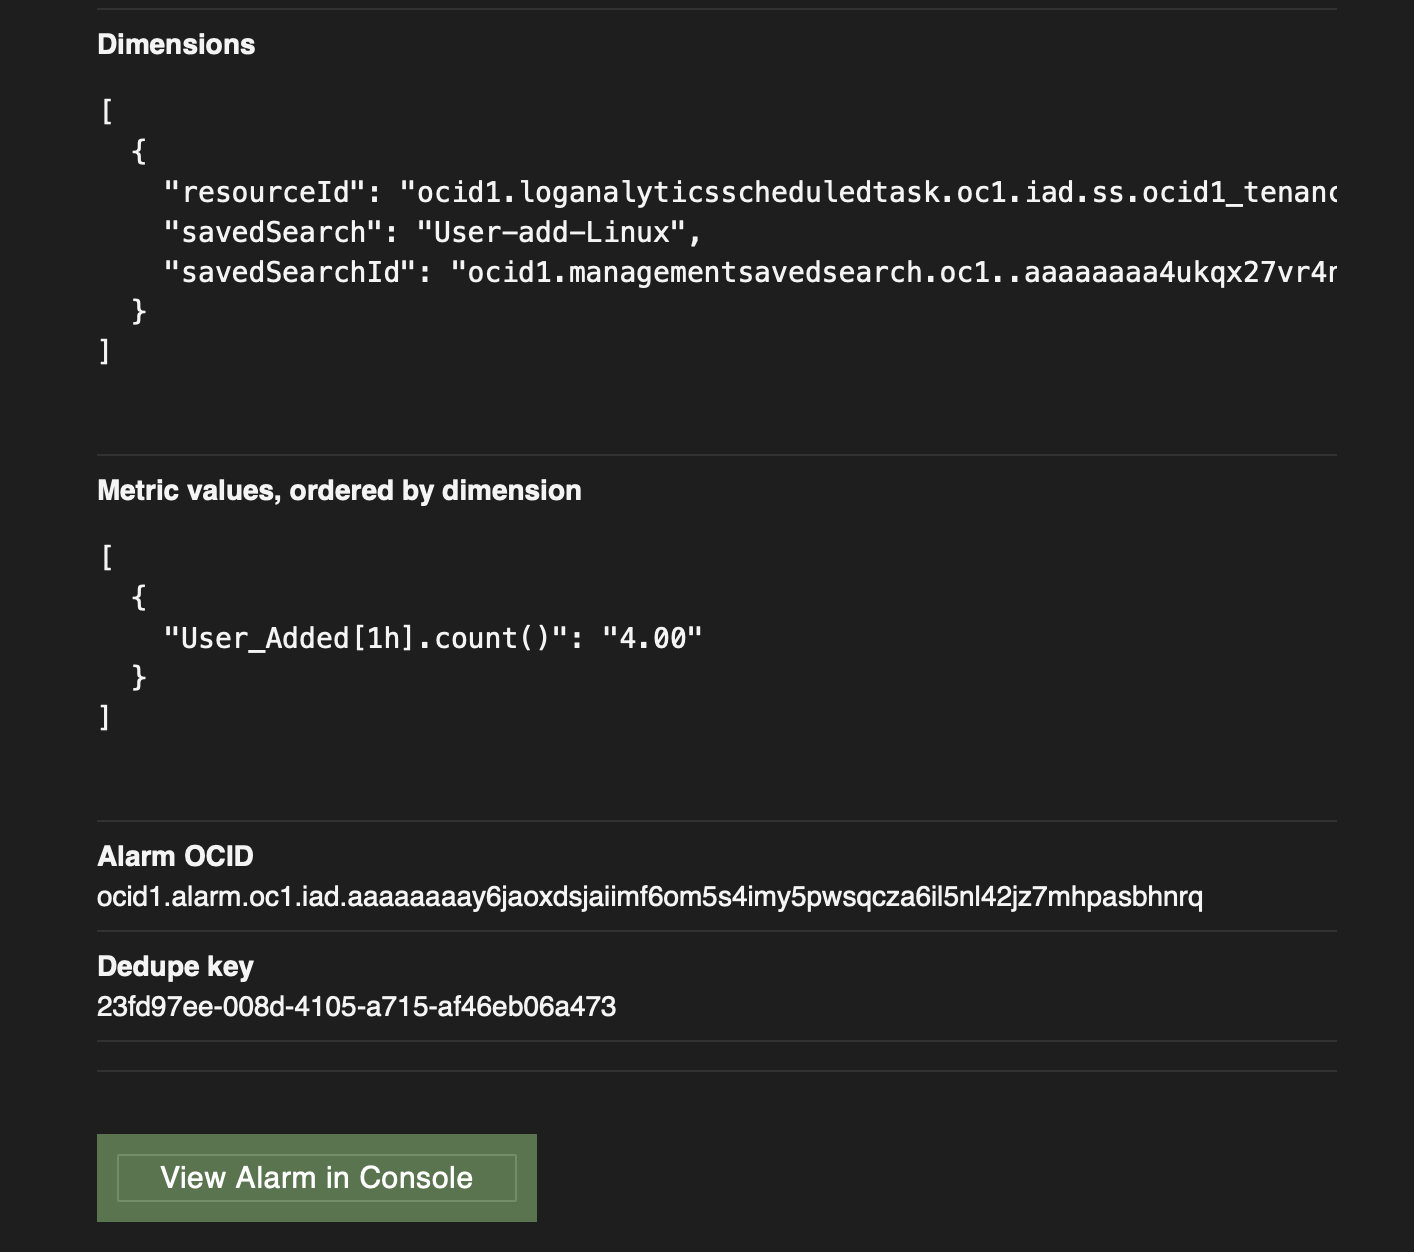
The same data is reflected at the Alarms page as well as this puts the Alarm in firing state. Because of which notifications on your choice of subscription channel are triggered.
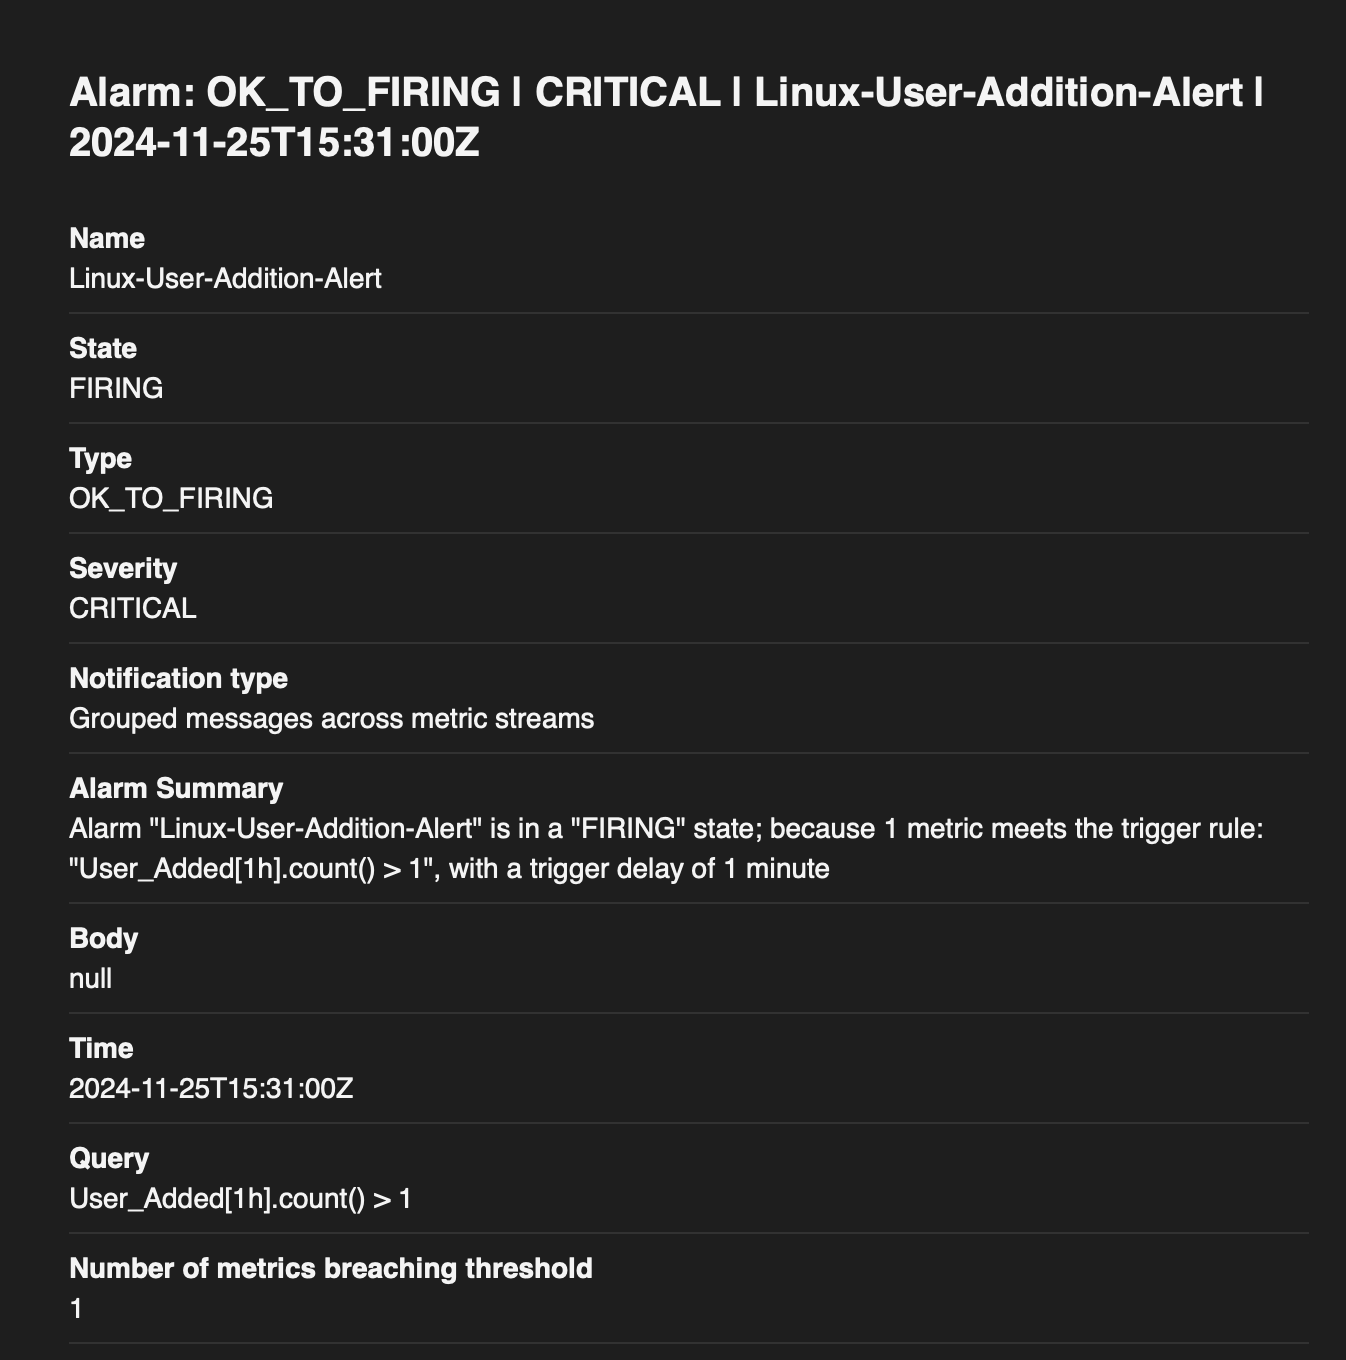
Here is a sample email notification received when the Alarm is triggered.
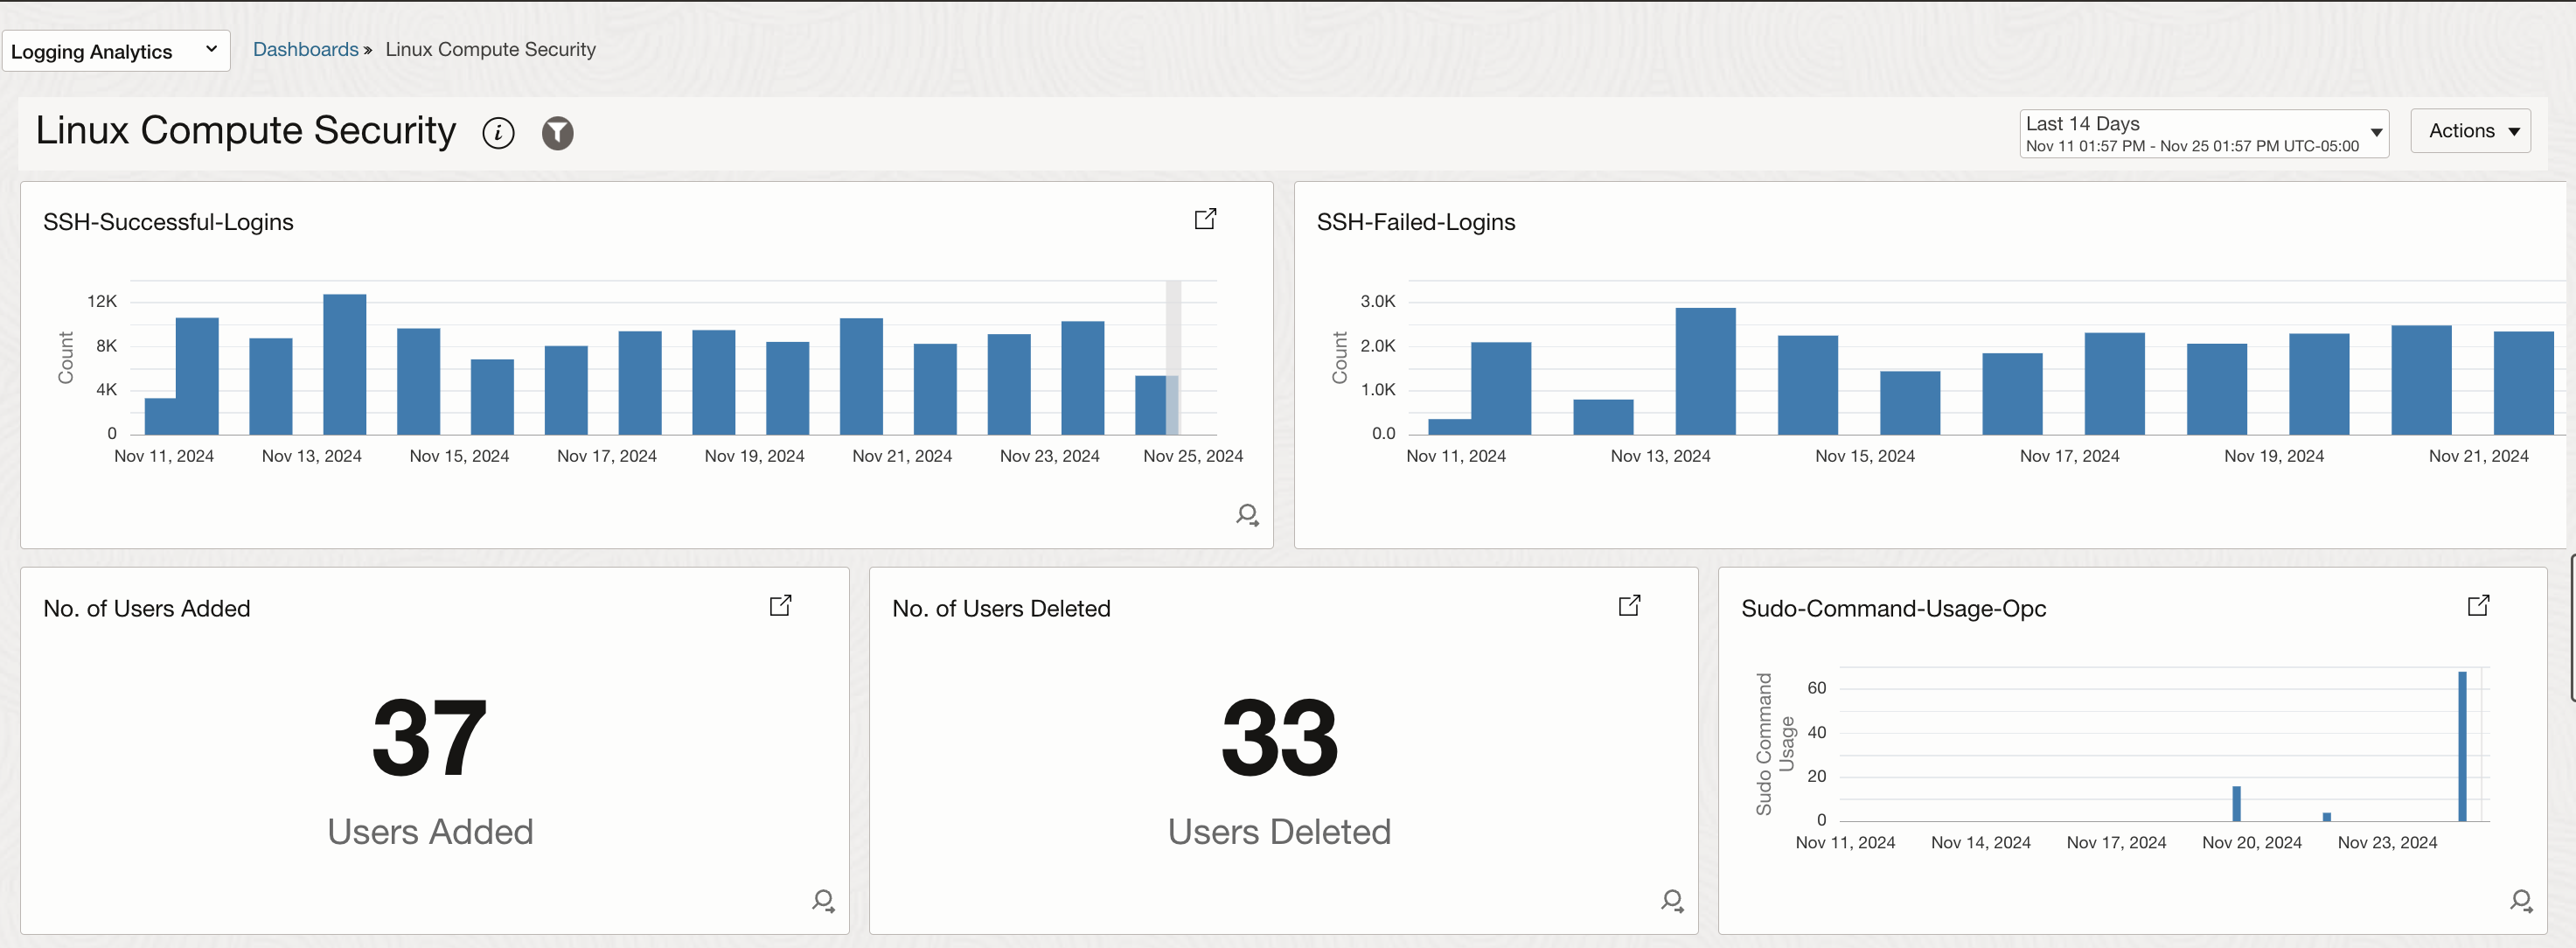
Apart from sending Notifications, the log search widgets can be added to a dashboard as well. Here is a sample dashboard with the widgets discussed above.
Conclusion
By leveraging tools like OCI Logging Analytics, you can efficiently collect, analyze, and act on critical log data to enhance the security posture of your environment. Understanding and implementing secure logs—particularly those related to authentication and user activity—empowers you to detect potential threats early, respond swiftly, and maintain a strong security foundation. By following the best practices outlined in this blog, you can ensure that your OCI compute instances remain secure and that your log data is both actionable and valuable in safeguarding your infrastructure.