Oracle Cloud Infrastructure (OCI) offers robust operations and monitoring capabilities that enable you to maintain high availability, performance, and security for your cloud resources. One of the most powerful tools in OCI’s monitoring suite is the Monitoring Query Language (MQL). Crafting effective MQL queries can significantly enhance your ability to track and respond to system metrics and events. This blog post will cover best practices for using MQL to optimize your OCI monitoring.
Monitoring Service
The Monitoring service uses metrics to monitor resources and alarms to notify you when these metrics meet alarm-specified triggers.
Metrics are emitted to the Monitoring service as raw data points, or timestamp-value pairs, along with dimensions and metadata.
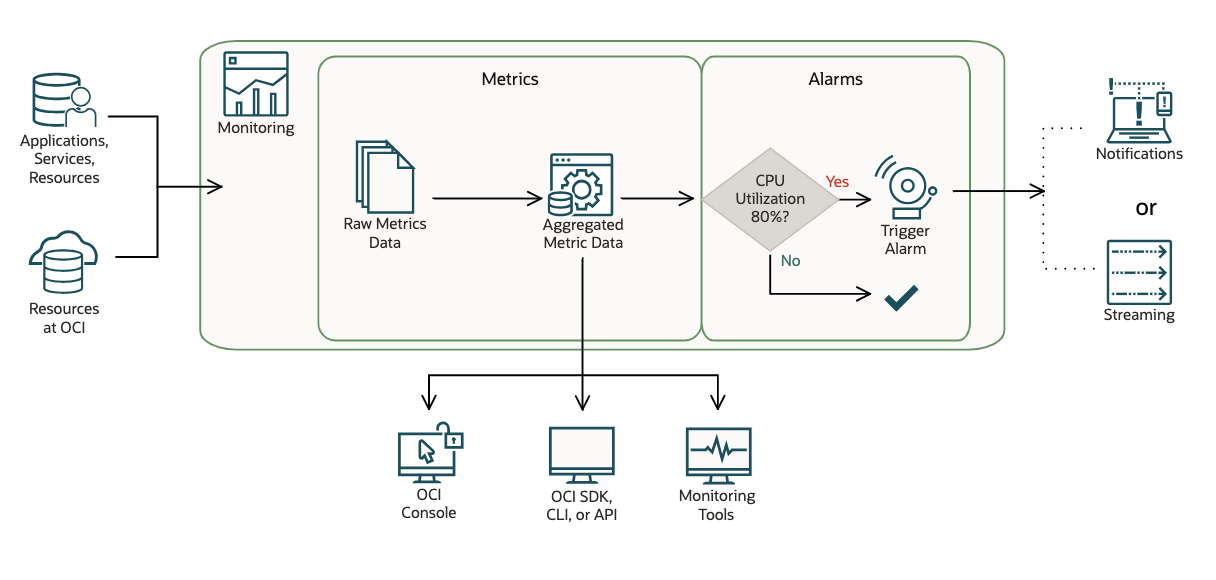
Metrics come from various sources:
- Service metrics automatically posted by Oracle Cloud Infrastructure resources .
- For example, the Compute service posts metrics for monitoring-enabled compute instances through the oci_computeagent namespace. One such metric is CPUUtilization.
- Data sent to new or existing metrics using Connector Hub (with Monitoring as the target service for a connector).
- For example, capture and count the detected string from the application log and aggregate and send the occurrences to Monitoring service.
- Custom metrics published using the Monitoring API.
- For example, you can use OCI CLI or SDK to capture/collect and post metrics to Monitoring service.
- Infrastructure and Application Stack Monitoring Metrics from OCI Stack Monitoring
- Database Monitoring Metrics from Database Management Service
- Application Performance Monitoring Metrics from Application Performance Monitoring
- Capacity Planning and SQL Performance Management Metrics from Ops Insights
For more details, see Supported Services and Viewing Default Metric Charts.
Understand Monitoring Query Language (MQL) and Alarm Evaluations
A Monitoring Metric is a measurement data point related to health, capacity, or performance of a resource. You can collect metrics from resources, services, and applications and send metrics to the Monitoring service. By querying Monitoring for this data, you can understand how well the systems and processes are working to achieve the service levels you commit to your customers. For example:
- Application uptime and downtime
- Availability and latency
- Completed transactions
- Failed and successful operations
- Key performance indicators (KPIs), such as sales and engagement quantifiers
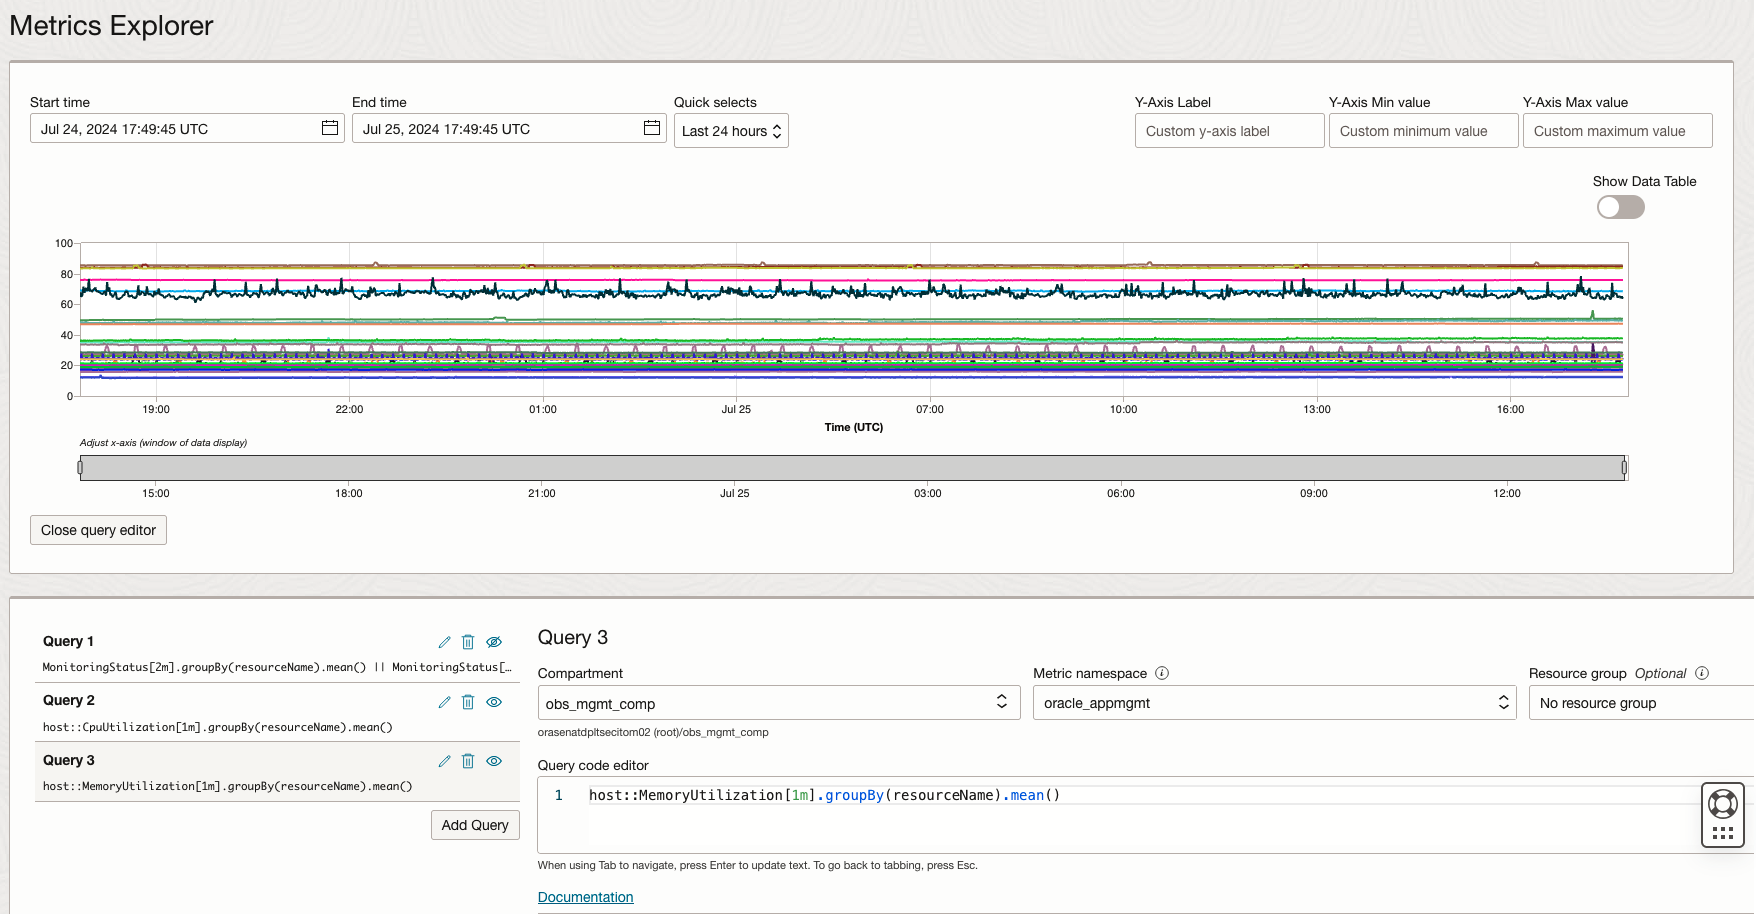
Even Monitoring service provides us the intuitive UI to query OCI Monitoring metrics across different metrics namespaces, resource groups and aggregate the data by selecting different interval and statistics. But from time to time, you will discover the UI limitations for more complex monitoring use cases. Monitoring Query Language (MQL) is here to rescue!
MQL is a flexible and powerful language designed for querying OCI Monitoring metrics. It allows you to perform complex aggregations, transformations, and filtering of metric data. Understanding how to construct effective MQL queries is essential for gaining actionable insights and creating effective alarms from the cloud resources monitoring data.
OCI Alarms uses Monitoring Query Language (MQL) for expressing the metrics and the condition that must be evaluated. A alarm query must specify a metric, metric resolution, statistic, interval, and a trigger rule (threshold or absence). It’s crucial to be familiar with MQL to create effective alarm definition for cloud operation readiness.
Facts about Monitoring Alarms
- Monitoring evaluates alarms once per minute to find alarm status.
- When the alarm splits notifications, Monitoring evaluates each tracked metric stream. If the evaluation of that metric stream indicates a new FIRING status or other qualifying event, then Monitoring sends an alarm message.
- Monitoring tracks metric streams per alarm for qualifying events.
- Alert will be sent when evaluating the condition for every metric stream when splits messages by Metric Stream is enabled
- Metrics are aggregated with 1 minute interval by default.
- Supported values for interval depends on the specified time range in the alarm data quick select. One hour time range supports all interval values whereas 90 days time range only supports interval value between 1 hour and 1 day.
- By default, metric queries’ resolution is the same as the query interval. Resolution can’t be selected for alarm queries. The only valid value of the resolution for an alarm query request is 1 minute.
- Alarm history entries store past 90 days of the metrics.
- Monitoring tracks metric streams per alarm for qualifying events, but messages are subject to the destination service limits.
The following is JSON format of the alarm definition which measures the 90th percentile of the metric CpuUtilization.
{
  "compartmentId": "ocid1.compartment.oc1..exampleuniqueID",
  "destinations": ["ocid1.onstopic.exampleuniqueID"],
  "displayName": "High CPU Utilization",
  "id": "ocid1.alarm.oc1..exampleuniqueID",
  "lifecycleState": "ACTIVE",
  "metricCompartmentId": "ocid1.compartment.oc1..exampleuniqueID",
  "namespace": "oci_computeagent",
  "pendingDuration": "PT3M",
  "query": "CpuUtilization[1m]{availabilityDomain = \"cumS:PHX-AD-1\"}.groupBy(availabilityDomain).percentile(0.9) > 85",
  "repeatNotificationDuration": "PT2H",
  "severity": "WARNING",
  "isEnabled": true,
  "timeCreated": "2024-07-01T01:02:29.600Z",
  "timeUpdated": "2024-07-03T01:02:29.600Z"
}
MQL Alarm Examples
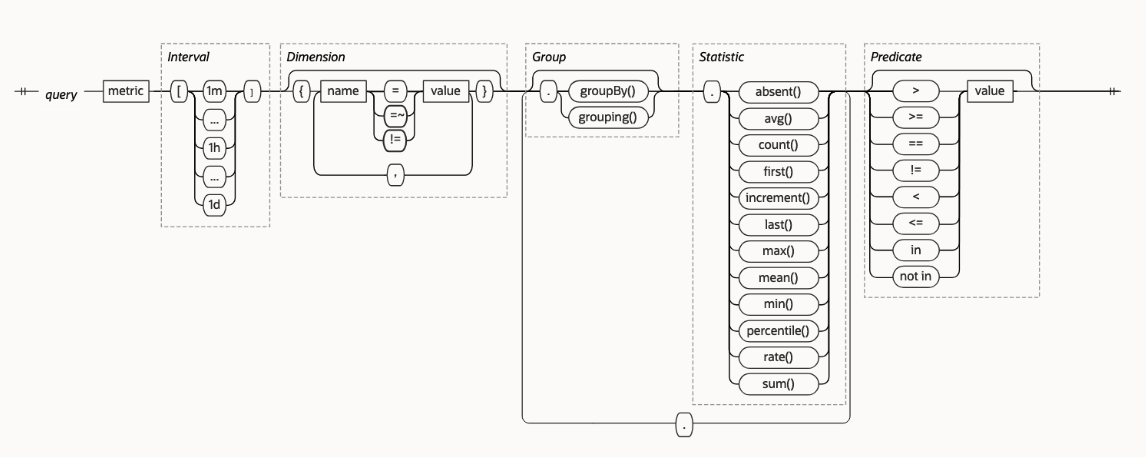
MQL syntax governs expressions for querying metrics that are published to the Monitoring service. MQL expressions. Define alarm queries. MQL acts on aggregated data.
Host Monitoring
Host Availability Monitoring
- Description: Critical alarm for any host in a compartment missing MonitoringStatus metric or MonitoringStatus metric is 0 for past 7 minutes.
- Resource Type: Host
- Metric Namespace: oracle_appmgmt
- Resource Group: host
- Trigger delay minutes: 5 mins
- Notification grouping: Split notifications per metric stream
- Trigger rule severity: Critical
-
MonitoringStatus[2m].groupBy(resourceName).mean() == 0 || MonitoringStatus[2m].groupBy(resourceName).absent() == 1
High CPU Utilization Monitoring
- Description: Warning alarm for any host in a compartment reporting over 80% CPU utilization for past 5 minutes. Critical alarm for any host in a compartment reporting over 90% CPU utilization for past 5 minutes.
- Resource Type: Host
- Metric Namespace: oracle_appmgmt
- Resource Group: host
- Trigger delay minutes: 2 mins
- Notification grouping: Split notifications per metric stream
- Trigger Rule 1 severity: Warning
-
CpuUtilization[3m].groupBy(resourceName).mean() > 80
- Trigger Rule 2 severity: Critical
-
CpuUtilization[3m].groupBy(resourceName).mean() > 90
Filesystem Utilization Monitoring
- Description:
- Warning alarm for any filesystem on any host in a compartment reporting over 80% memory utilization for past 15 minutes.
- Critical alarm for any filesystem on any host in a compartment reporting over 90% memory utilization for past 15 minutes.
- Resource Type: Host
- Metric Namespace: oracle_appmgmt
- Resource Group: host
- Trigger delay minutes: 5 mins
- Notification grouping: Split notifications per metric stream
- Trigger Rule 1 severity: Warning
-
host::FilesystemUtilization[10m]{osType = "Linux"}.groupBy(fileSystemName, resourceName).mean() > 80 - Trigger Rule 2 severity: Critical
-
host::FilesystemUtilization[10m]{osType = "Linux"}.groupBy(fileSystemName, resourceName).mean() > 90
Oracle WebLogic Server
WebLogic Server Down
- Description: Critical alarm for any WebLogic Server in a compartment missing MonitoringStatus metric or MonitoringStatus metric is 0 for past 7 minutes.
- Resource Type: OracleWeblogic Server
- Metric Namespace: oracle_appmgmt
- Resource Group: weblogic_j2eeserver
- Trigger delay minutes: 5 mins
- Notification grouping: Split notifications per metric stream
- Trigger rule severity: Critical
-
MonitoringStatus[2m].groupBy(resourceName).mean() == 0 || MonitoringStatus[2m].groupBy(resourceName).absent() == 1
WebLogic Work Manager Stuck Threads
- Description: Warning alarm for any WebLogic Server in a compartment reporting more than 10 work manager stuck thread for past 5 minutes. Critical alarm for any WebLogic Server in a compartment reporting more than 15 work manager stuck thread for past 5 minutes.
- Resource Type: OracleWeblogic Server
- Metric Namespace: oracle_appmgmt
- Resource Group: weblogic_j2eeserver
- Trigger delay minutes: 5 mins
- Notification grouping: Split notifications per metric stream
- Trigger Rule 1 severity: Warning
-
WorkManagerStuckThreads[5m].groupBy(resourceName).sum() >= 10
- Trigger Rule 2 severity: Critical
-
WorkManagerStuckThreads[5m].groupBy(resourceName).sum() >= 15
ApacheHTTP server
Apache HTTP Server High Web Request Processing Time
- Description: Warning alarm for any Apache HTTP Server in a given compartment reporting over 1500ms mean web request processing time for past 1-5 minutes. Critical alarm for any Apache HTTP Server in a given compartment reporting over 3000ms mean web request processing time for past 1-5 minutes.
- Resource Type: Apache HTTP
- Metric Namespace: oracle_appmgmt
- Resource Group: apache_http_server
- Trigger delay minutes: 5 mins
- Notification grouping: Split notifications per metric stream
- Trigger Rule 1 severity: Warning
-
WebRequestProcessingTime[5m].groupBy(resourceName).mean() >= 1500
- Trigger Rule 2 severity: Critical
-
WorkManagerStuckThreads[5m].groupBy(resourceName).mean () >= 3000
Oracle Database
Database Management Service provide recommended alarms template for Oracle Database Monitoring. From Database Management service, select Database name under Oracle Database, select Alarm definitions, create recommended alarms.
Tablespace space Utilization Monitoring
- Description: Warning and Critical alarm rule conditions for permanent tablespaces whose utilization is greater than 75% or 85% over the past 10 minutes.
- Resource Type: Database
- Metric Namespace: oracle_oci_database
- Resource Group: N/A
- Trigger delay minutes: 5 mins
- Notification grouping: Split notifications per metric stream
- Trigger Rule 1 severity: Warning
-
StorageUtilizationByTablespace[5m].groupBy(resourceName).mean() > 75
- Trigger Rule 2 severity: Critical
-
StorageUtilizationByTablespace[5m].groupBy(resourceName).mean() > 80
ProcessLimitUtilization Monitoring
- Description: Warning and Critical alarm rule conditions to trigger an alarm when the process utilization (%) is greater than 90% or 95% over the past 5 minutes.
- Resource Type: Database
- Metric Namespace: oracle_oci_database
- Resource Group: N/A
- Trigger delay minutes: 3 mins
- Notification grouping: Split notifications per metric stream
- Trigger Rule 1 severity: Warning
-
ProcessLimitUtilization[2m].groupBy(deploymentType, resourceName).mean() > 90
- Trigger Rule 2 severity: Critical
-
ProcessLimitUtilization[2m].groupBy(deploymentType, resourceName).mean() > 95
E-Business Suite
EBS Concurrent Processing Requests Error Rate
- Resource Type: EBS Concurrent Processing
- Metric Namespace: oracle_appmgmt
- Resource Group: oracle_ebs_conc_mgmt_service
- Trigger delay minutes: 2 mins
- Notification grouping: Split notifications per metric stream
- Trigger Rule 1 severity: Warning
-
CompletedConcurrentRequests[15m]{State = "Errored"}.mean() > 0.001
Best Practices and Tips for MQL Alarms
- We recommend using the O&M advanced services metric namespaces as much as possible because it covers wider range of metrics.
- oracle_appmgmt: Application Performance Monitoring and Stack Monitoring
- oracle_oci_database: Database Management Service
- oracle_oci_database_cluster: Database Management Service for cluster
- oracle_apm_rum: APM for Real User Monitoring
- oracle_apm_synthetics: APM for Synthetic Monitoring
- oci_operations_insights: Ops Insights
- Combining both Threshold Alarm and Absence Alarm by joining metrics to deliver comprehensive technology stack alerting coverage
- Eg. Combining both host monitoring status and weblogic server monitoring status
-
host::MonitoringStatus[1m]{agentHostName = "atfmw-soa-0.oraclevcn.com"}.groupBy(resourceName).mean() || weblogic_j2eeserver::MonitoringStatus[1m]{agentHostName = "atfmw-soa-0.oraclevcn.com"}.groupBy(resourceName).mean() || oracle_soainfra::MonitoringStatus[1m]{agentHostName = "atfmw-soa-0.oraclevcn.com"}.groupBy(resourceName).mean() || oracle_servicebus::MonitoringStatus[1m]{agentHostName = "atfmw-soa-0.oraclevcn.com"}.groupBy(resourceName).mean()
-
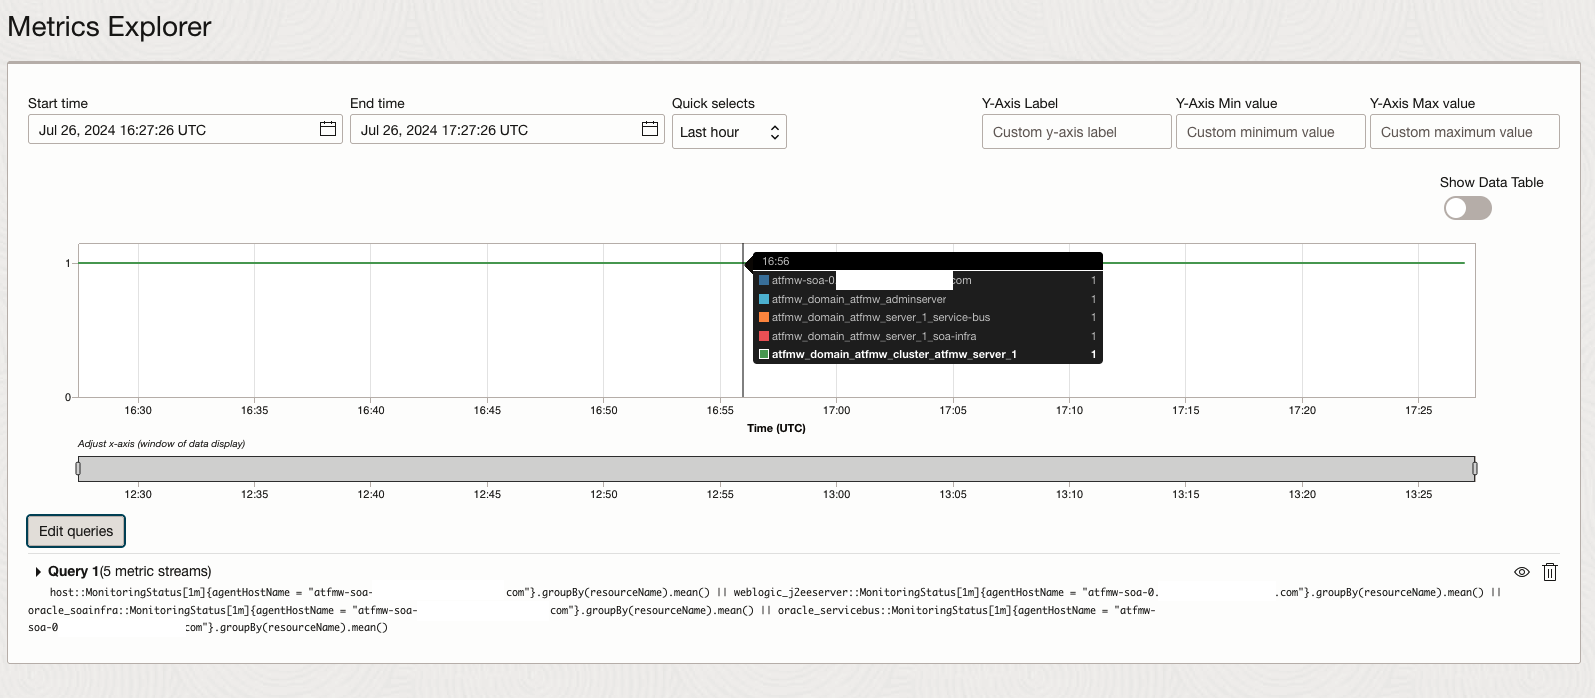
Figure 4. Advanced MQL Monitoring Alarm for multi-stack monitoring - We recommend always using groupBy in the query of absence alarm. Using groupBy prevents irrelevant alarm triggers when OCI introduces new dimensions. A new dimension creates an initially empty metric stream. Without groupBy, the alarm monitors all metric streams.
- For example, consider the query CpuUtilization[1m].absent(). If OCI Compute adds a dimension to CpuUtilization, then the alarm is triggered, regardless of the presence of other metric streams.
- Test and validate the metrics for monitoring requirement
- Use trigger delay minutes to reduce the false alarms, we recommend to set trigger delay minutes to 3-5 minutes to decrease the possibility of false notifications.
-
host::FilesystemUtilization[10m]{osType = "Linux"}.groupBy(fileSystemName, resourceName).mean() > 80
-
- Use Nesting Queries in MQL Alarm
- Example 1: Sum of Hosts with CPU utilization Greater than 80 Percent
-
(CpuUtilization[1m].max() > 80).grouping().sum()
-
- Example 2: Sum of Availability Domains with a Success Rate Lower than 0.99
-
(SuccessRate[1m].groupBy(availabilityDomain).mean() < 0.99).grouping().sum()
-
- Example 3: Count of Hosts with Up Time Greater than Zero
-
(metric[1h].groupBy(host).min() > 0).grouping().count()
-
- Example 1: Sum of Hosts with CPU utilization Greater than 80 Percent
- Utilize metric stream split
- Understand the internal REST period. The internal reset period determines when an alarm stops checking for an absent metric that triggered the Firing state in the previous evaluation. The length of the internal reset period is globally configured at 10 minutes, which causes the alarm history to show a 10-minute difference.
- The maximum number of messages per alarm evaluation depends on the alarm destination. 60 max alarm messages per evaluation is supported for Notifications topic, whereas 100,000 max alarm messages per evaluation is supported for Streaming service.
- If you expect more than 60 messages per minute, specify streaming as the alarm destination.
Conclusion
Creating effective MQL queries is a critical skill for optimizing your OCI operations and monitoring strategy. By following these best practices, you can harness the full power of MQL to gain deep insights into your cloud infrastructure, ensuring high performance, availability, and security. Start with clear objectives, familiarize yourself with the available metrics, and iterate on your queries to refine and perfect your monitoring and alerting capabilities.
Reference
- Monitoring Metrics Supported Services
- Publishing Custom Metrics
- Selecting a Nondefault Resolution for a Query
- Setting up Alarms for Stack Monitoring
- Overview of Monitoring
- MQL Reference
- Managing Alarms