The Oracle Cloud Infrastructure (OCI) DevOps service is an end-to-end, continuous integration and continuous delivery (CI/CD) platform for developers.
Using this service DevOps engineer can easily build, test, and deploy software and applications on Oracle Cloud. In this blog, we will be exploring how we can leverage the power of Oracle Cloud Infrastructure (OCI) Observability & Management platform services for monitoring and managing our DevOps workflows. Specifically, we’ll delve into OCI Monitoring, Events, Logging, and Logging Analytics, and discuss how these tools help us gain deep insights into our DevOps services’ performance and health.
In today’s fast-paced world, ensuring optimal performance and availability of our DevOps pipelines is crucial. Some key challenges while managing DevOps service could be:
- Pipelines can fail due to errors in build, test, or deployment stages, which may be due to misconfigurations, code issues, or environment problems.
- CI/CD pipelines can experience slowdowns, affecting development velocity and deployment frequency.
- Problems in code repositories, such as merge conflicts, incorrect configurations, or access issues, can disrupt the CI/CD process.
- Security issues in the CI/CD process can expose vulnerabilities, potentially affecting the entire system.
- Failure to notify stakeholders about pipeline issues or deployment statuses can lead to delays in addressing problems.
By utilizing the OCI Observability & Management platform services, we can proactively monitor and manage our infrastructure, enabling us to deliver high-quality applications and services efficiently.
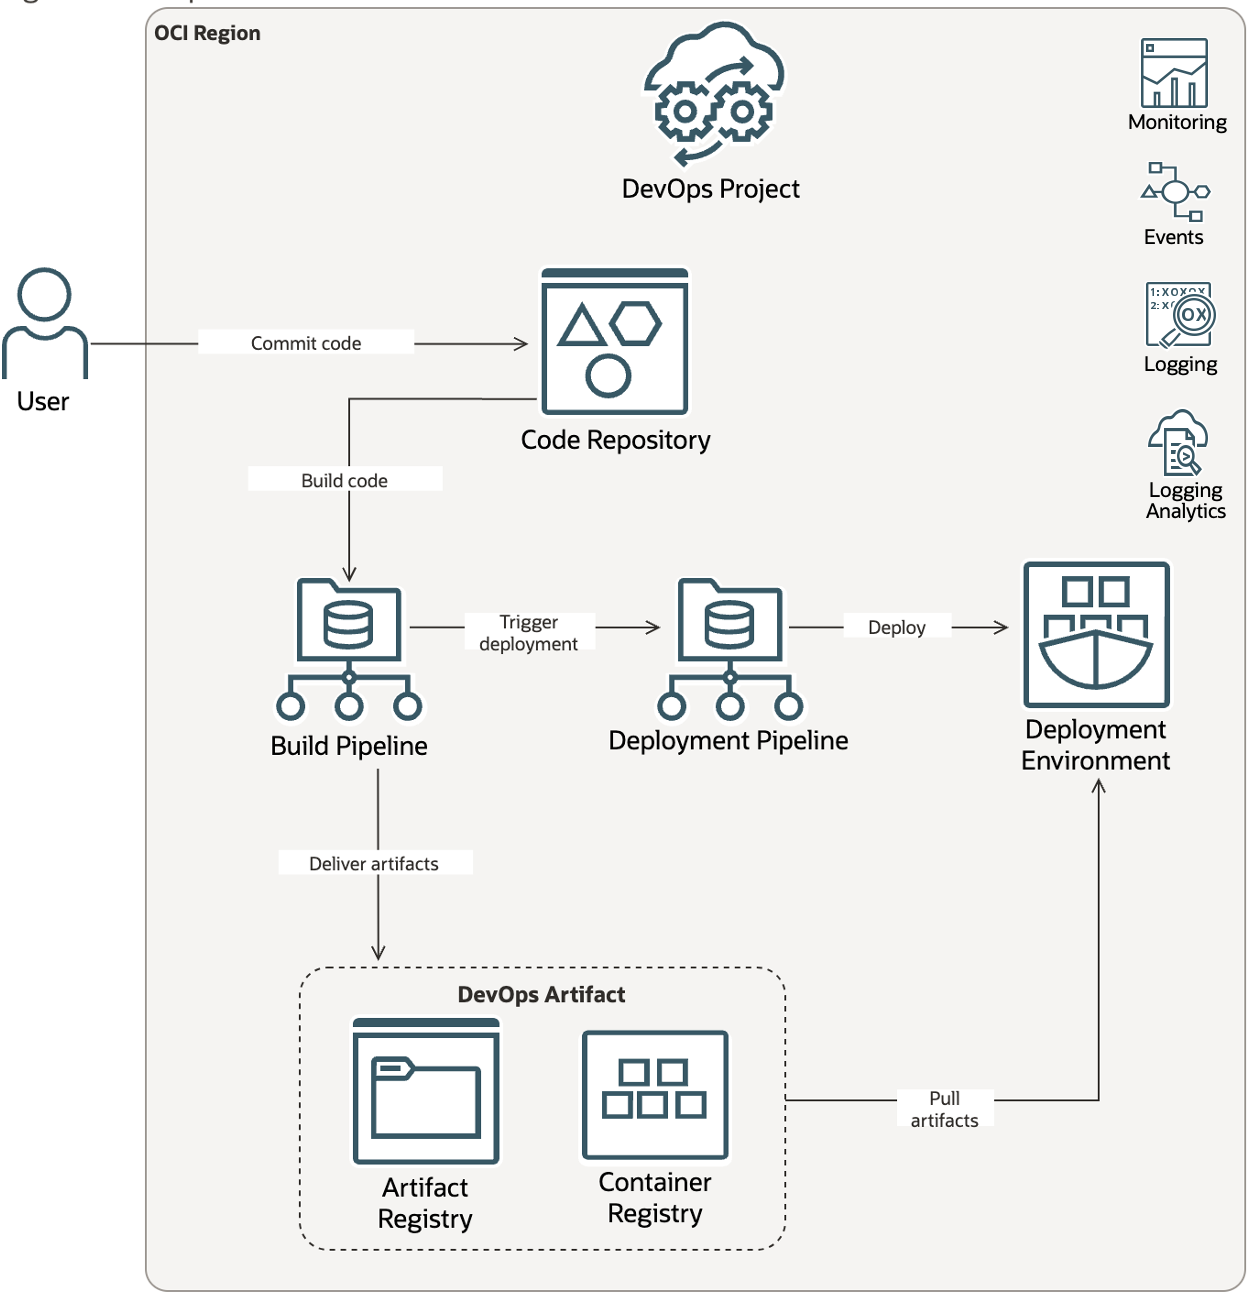
DevOps service has multiple components such as code repositories, build and deployment pipelines, build and deploy stages that require monitoring as shown in the image below. Observability & Management covers different aspects of monitoring performance data of these components gathered through metrics, events and logs.
OCI Monitoring for OCI DevOps Service
Oracle Cloud Infrastructure (OCI) Monitoring Service is a powerful tool that empowers us to keep a close eye on our cloud resources’ performance, health, and availability. It helps you in actively as well as passively monitor your cloud resources using Metrics and Alarms.
Monitoring service captures metrics from DevOps service in 3 different namespace categories:
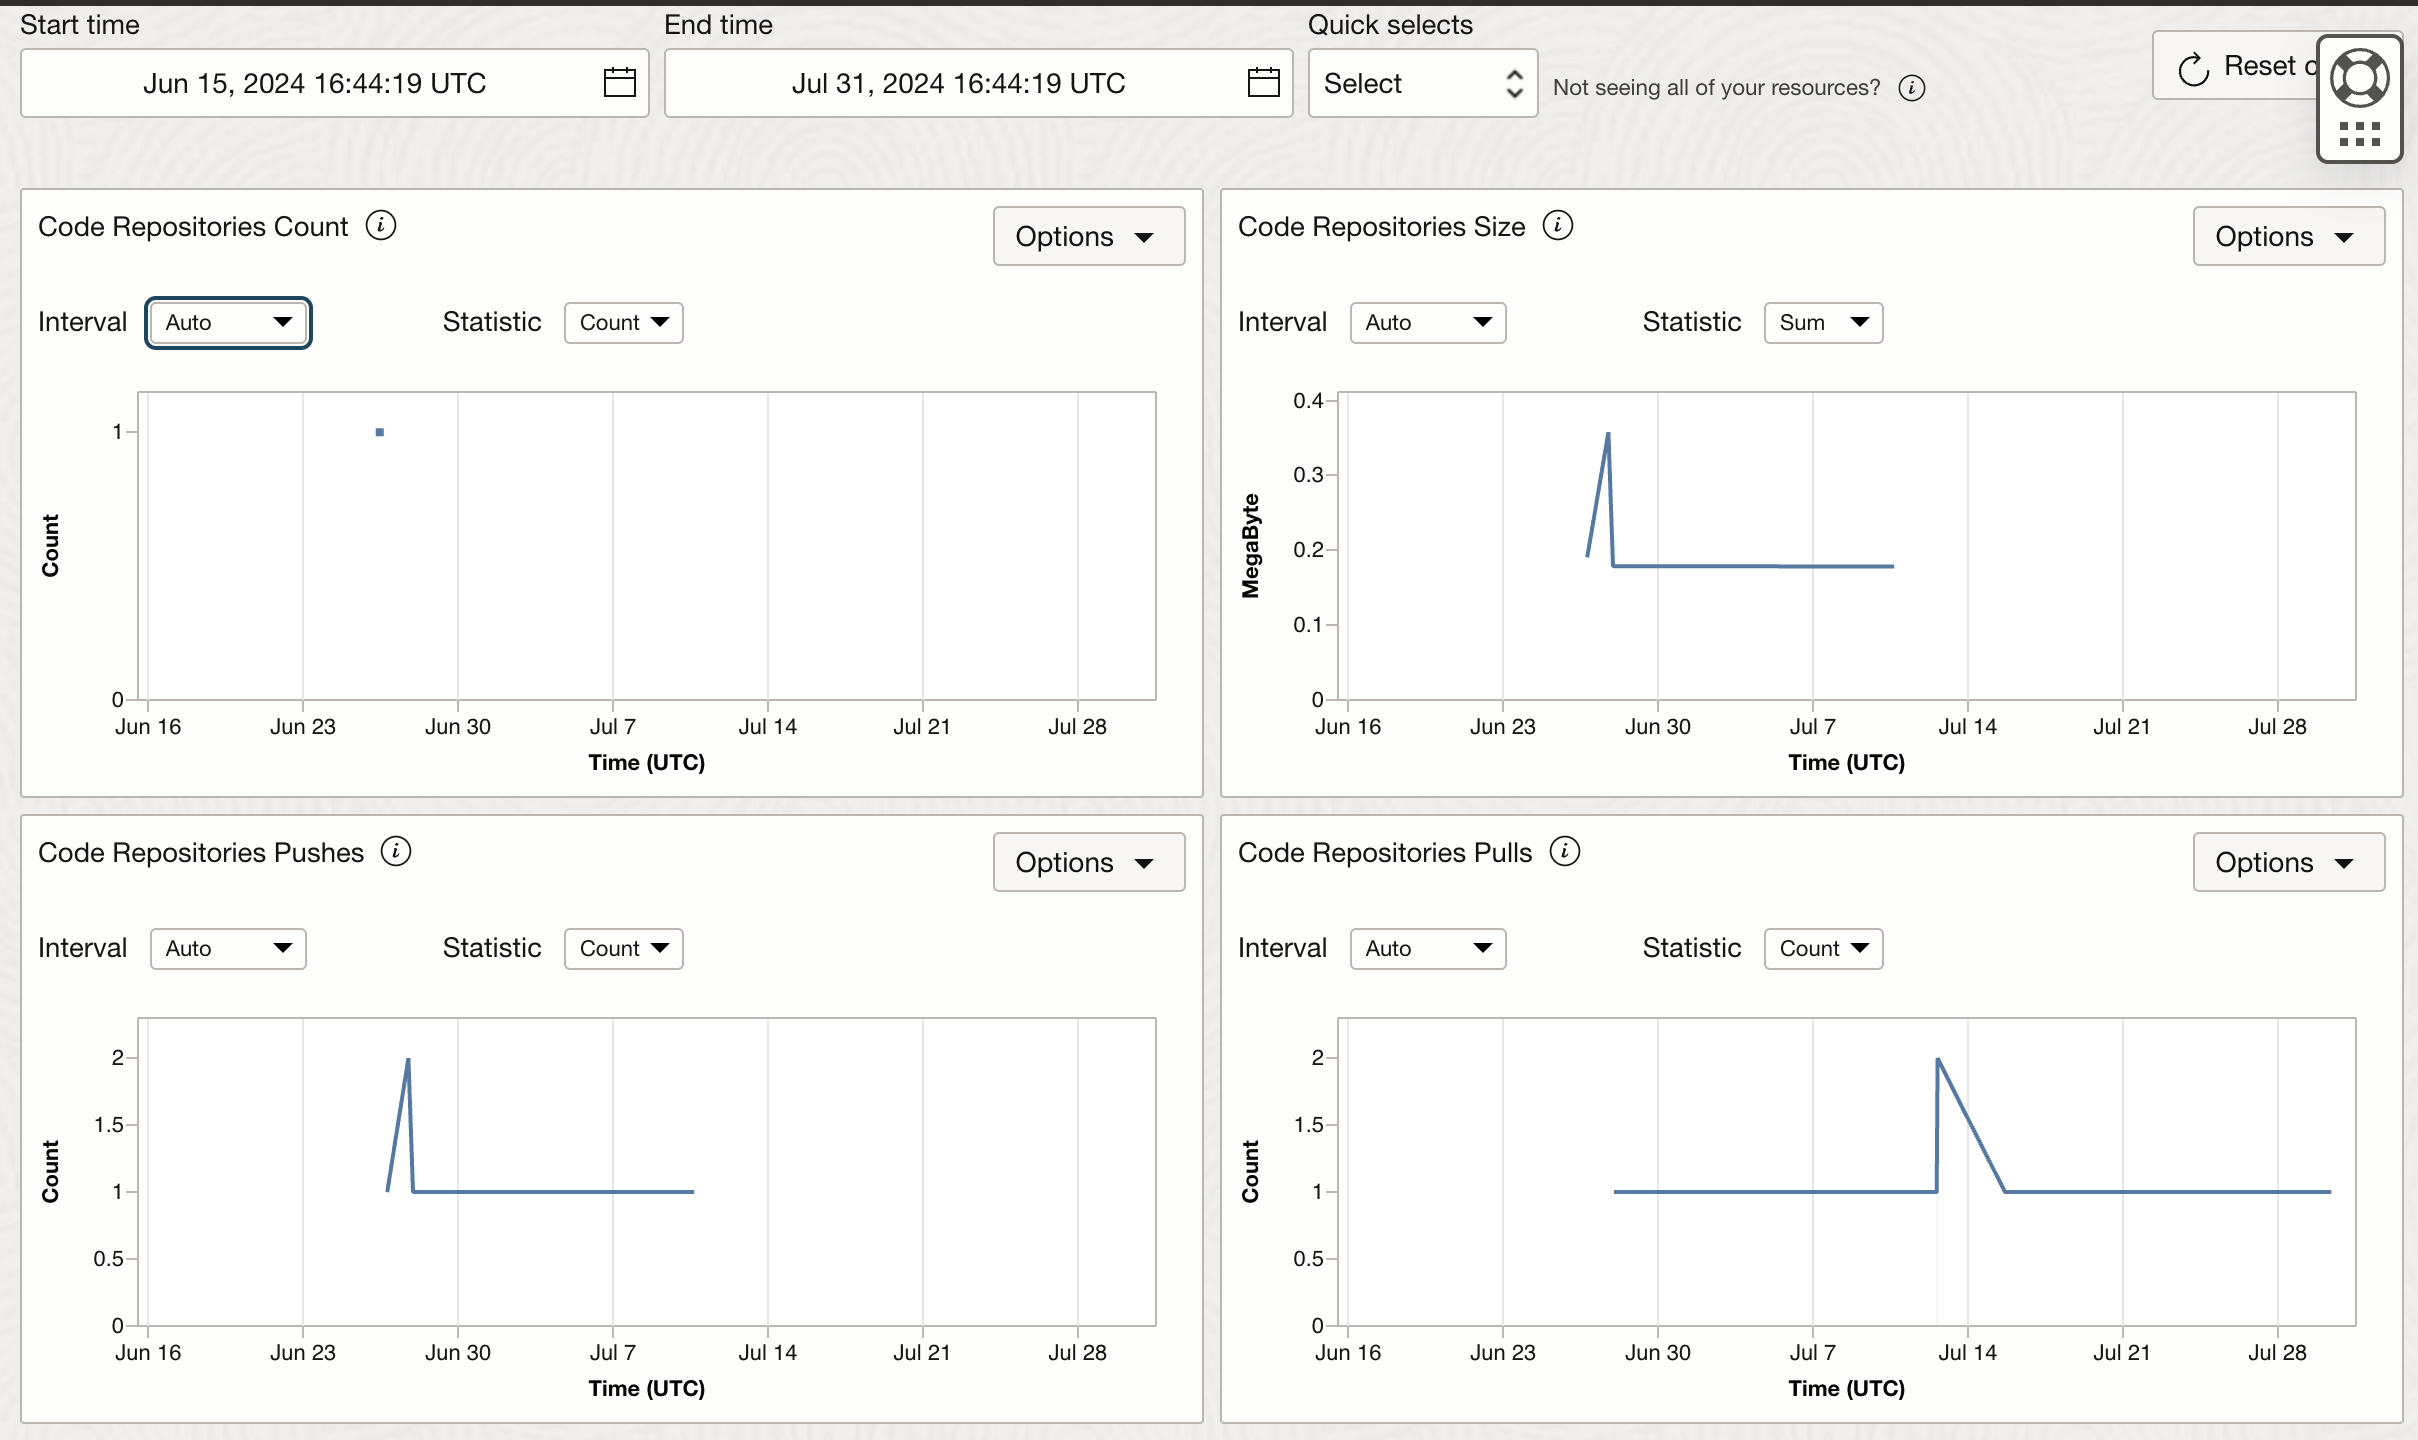
- oci_devops_code_repos (code repositories): This namespace includes metrics related to code repositories in a devops project. You can use the metrics here to discover number of code repos, number of push and pull done on top of these repos and respective sizes of these repos. These metrics can also be filtered to get granular results by using Dimensions such as project name, pull type, repository id and repository name. These dimensions are helpful especially when you have multiple devops projects running and you would want to focus on one of them.
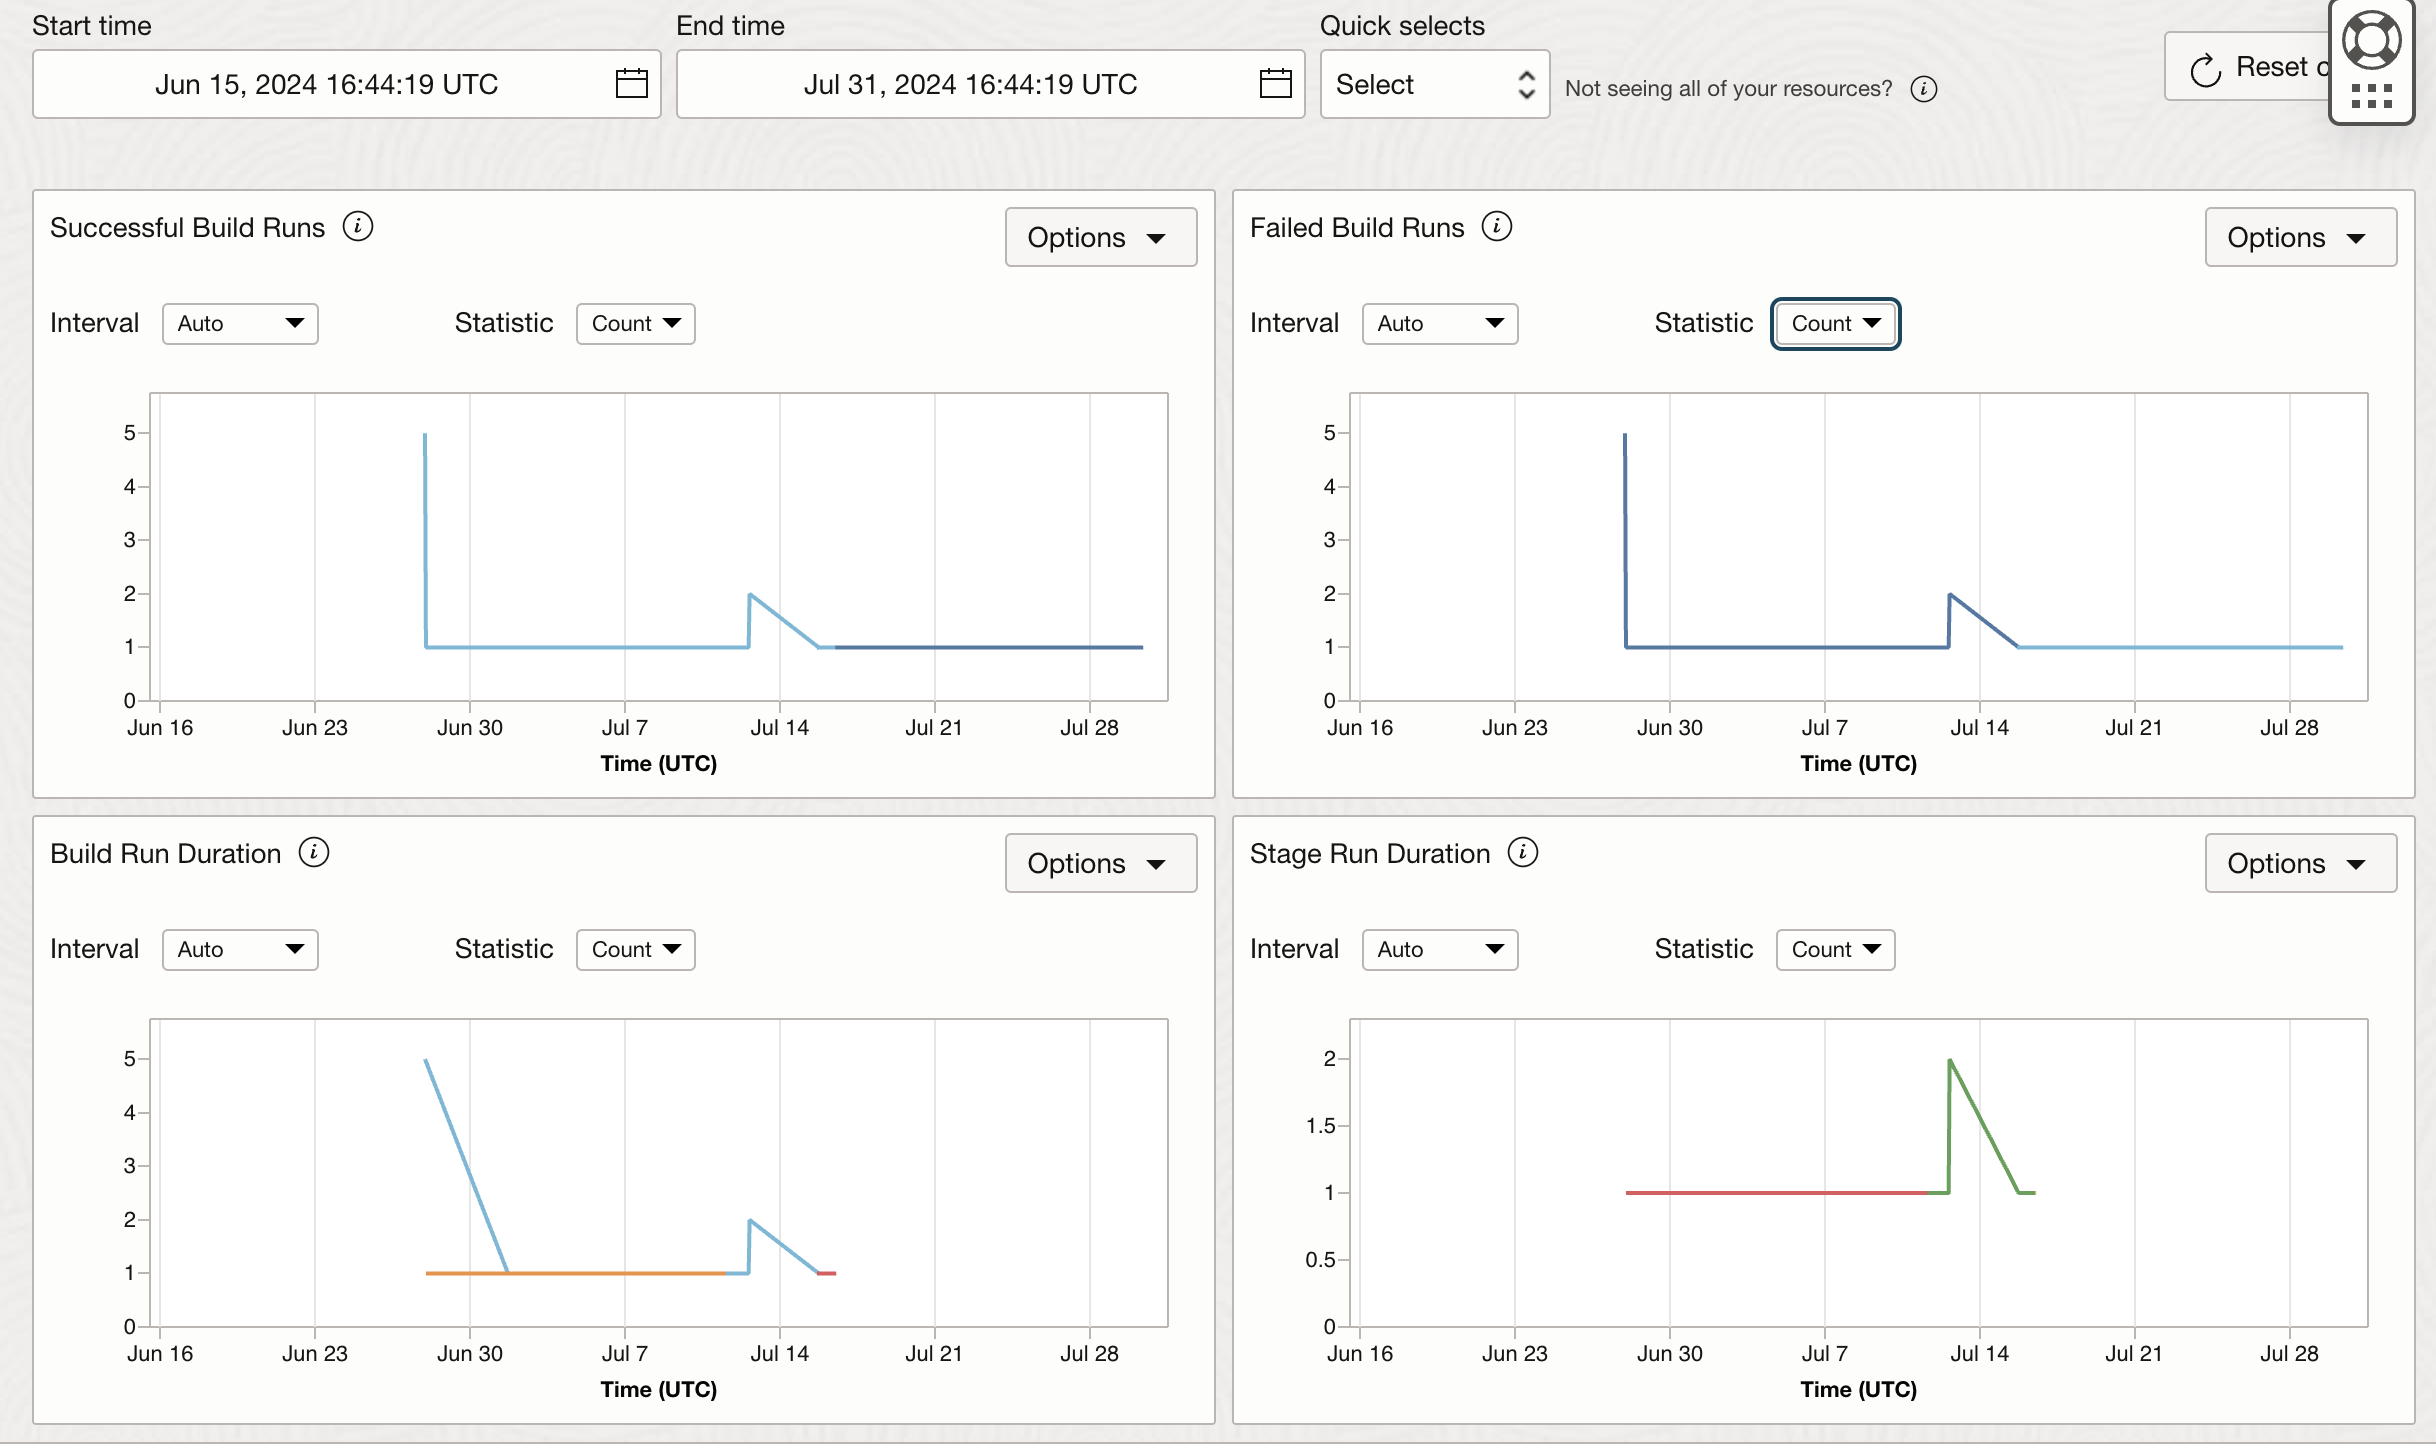
- oci_devops_build (build): This namespace includes metrics related to build pipelines and build runs. You can retrieve important data such as number of successful and failed build runs and duration of a build run as well as stage run. Here you can use dimensions to filter data based build pipeline id, lifecycle state,project id, stage id or type.
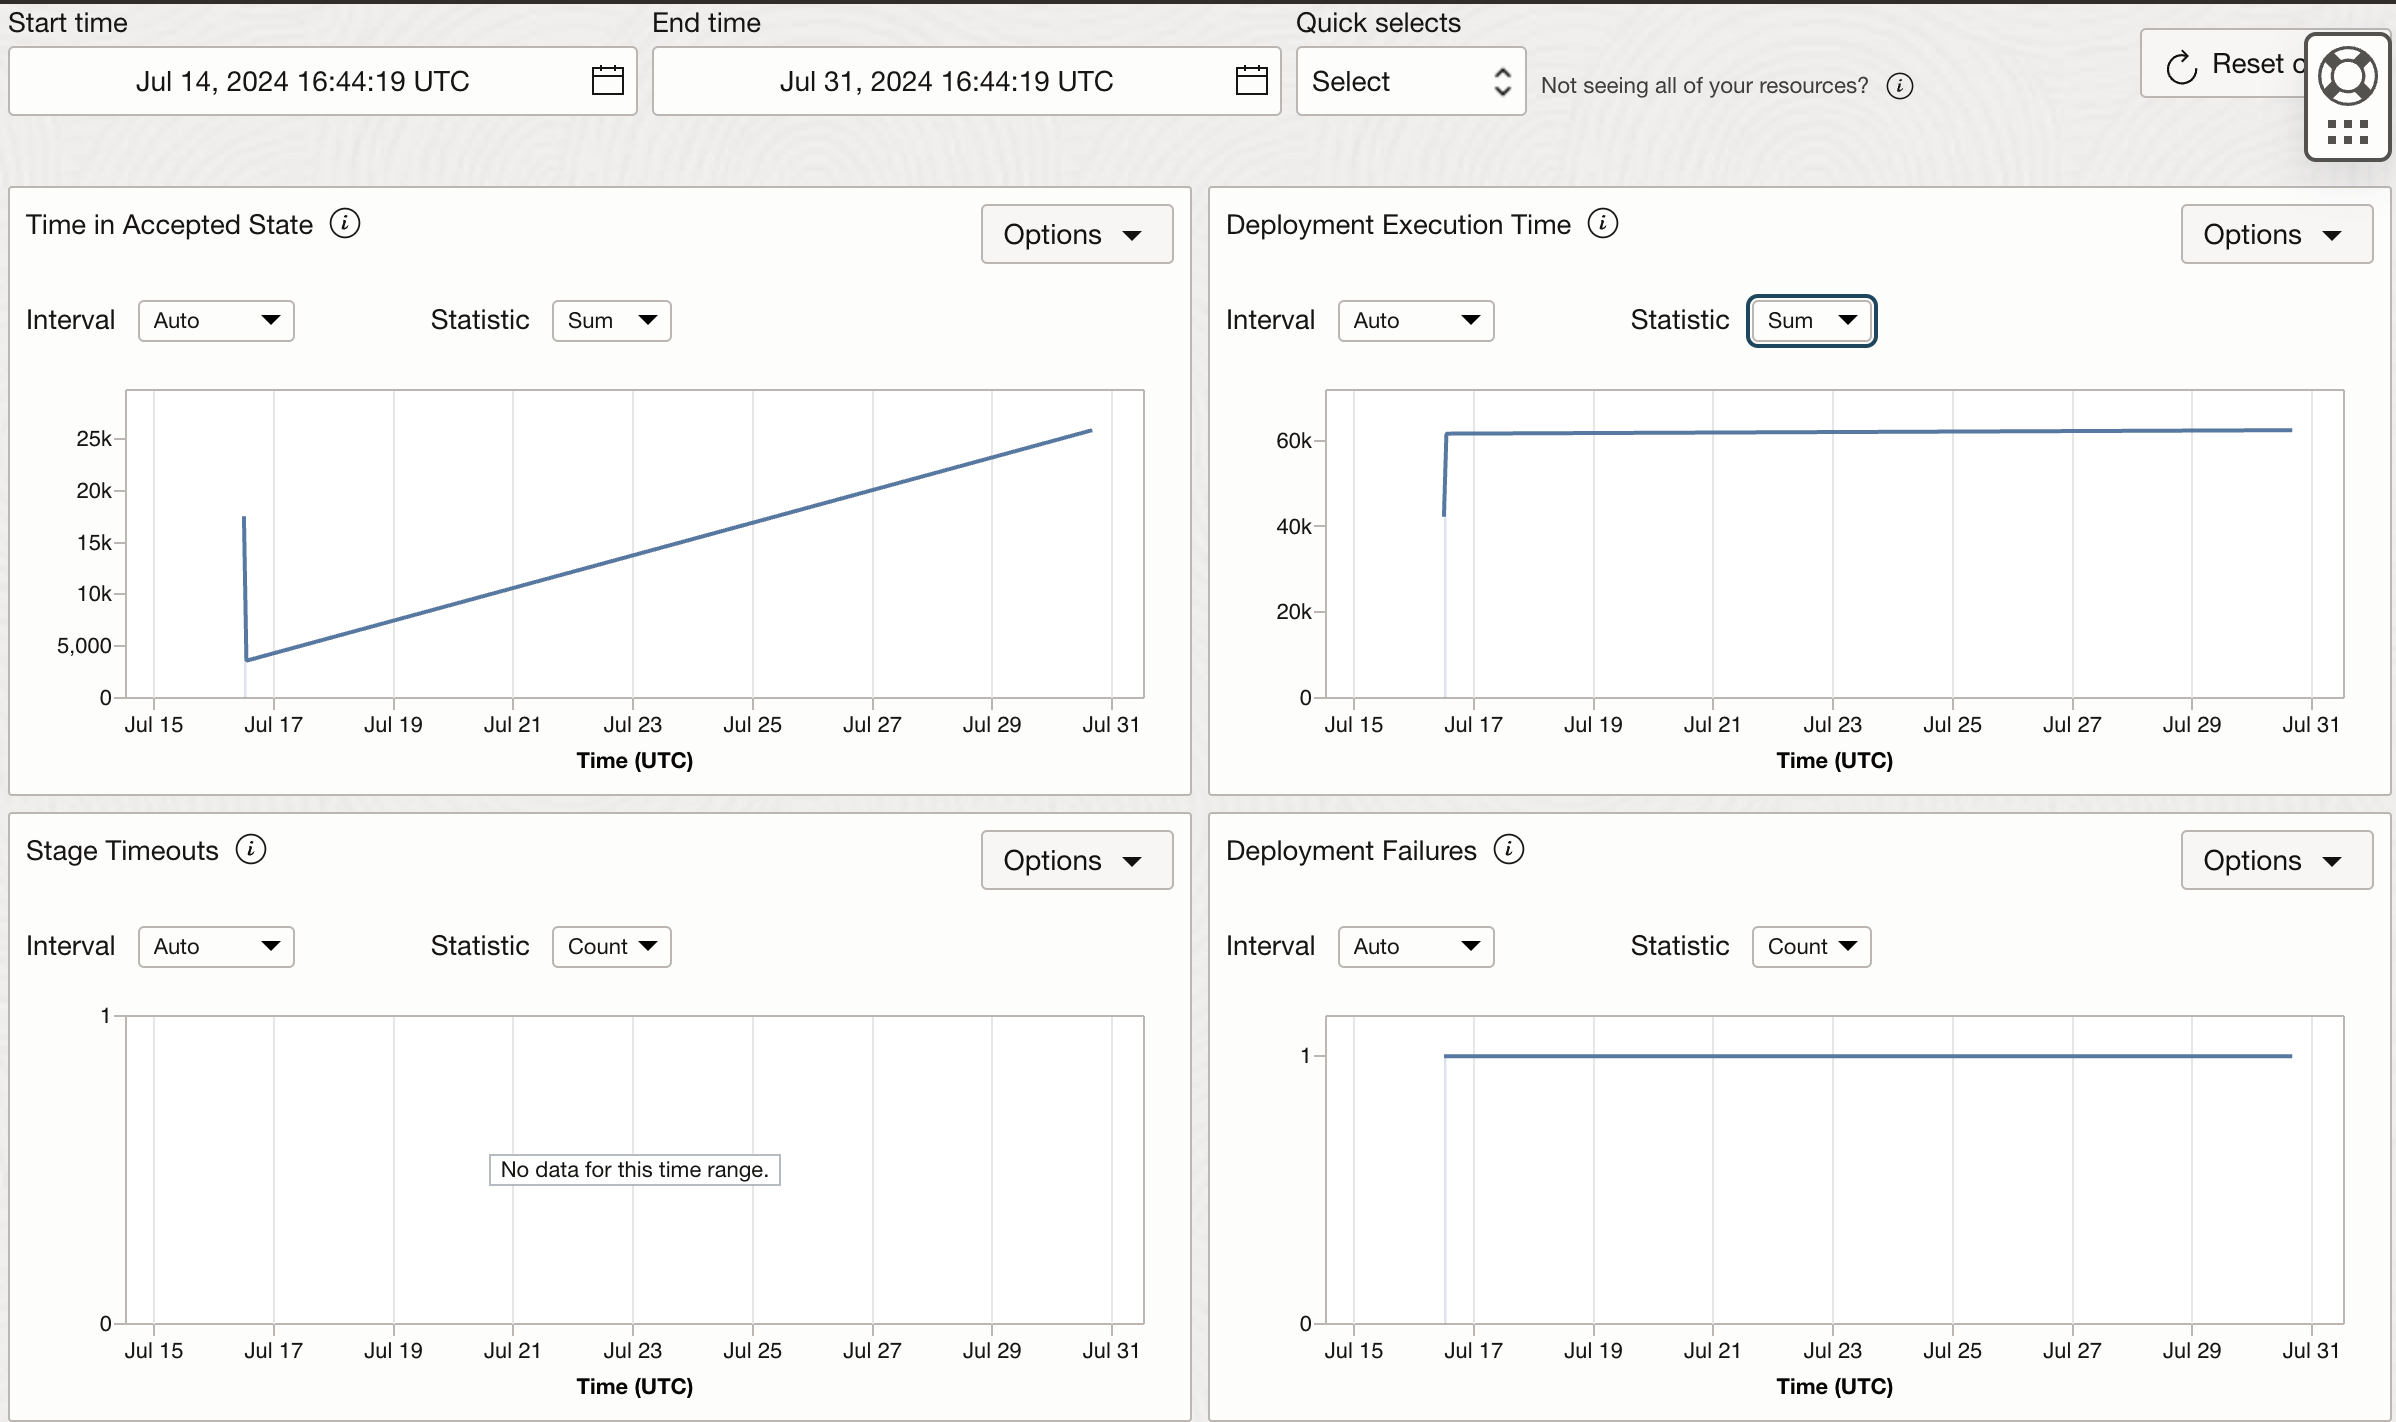
- oci_devops_deploy (deploy): This namespace includes metrics related to deployment pipelines and deployments. You can look at metrics such as number of deployment failures, any stage timeouts and deployment execution time. To filter the results, you can leverage dimensions deployment pipeline id and project id.
The image below shows how the metrics appear in the Monitoring service. In order to access these metrics in the console, navigate to Observability & Management -> Monitoring -> Service Metrics. Choose the compartment where your DevOps project and it’s resources are provisioned and from the Metric namespace list choose any of the above mentioned namespaces that you would like to access.
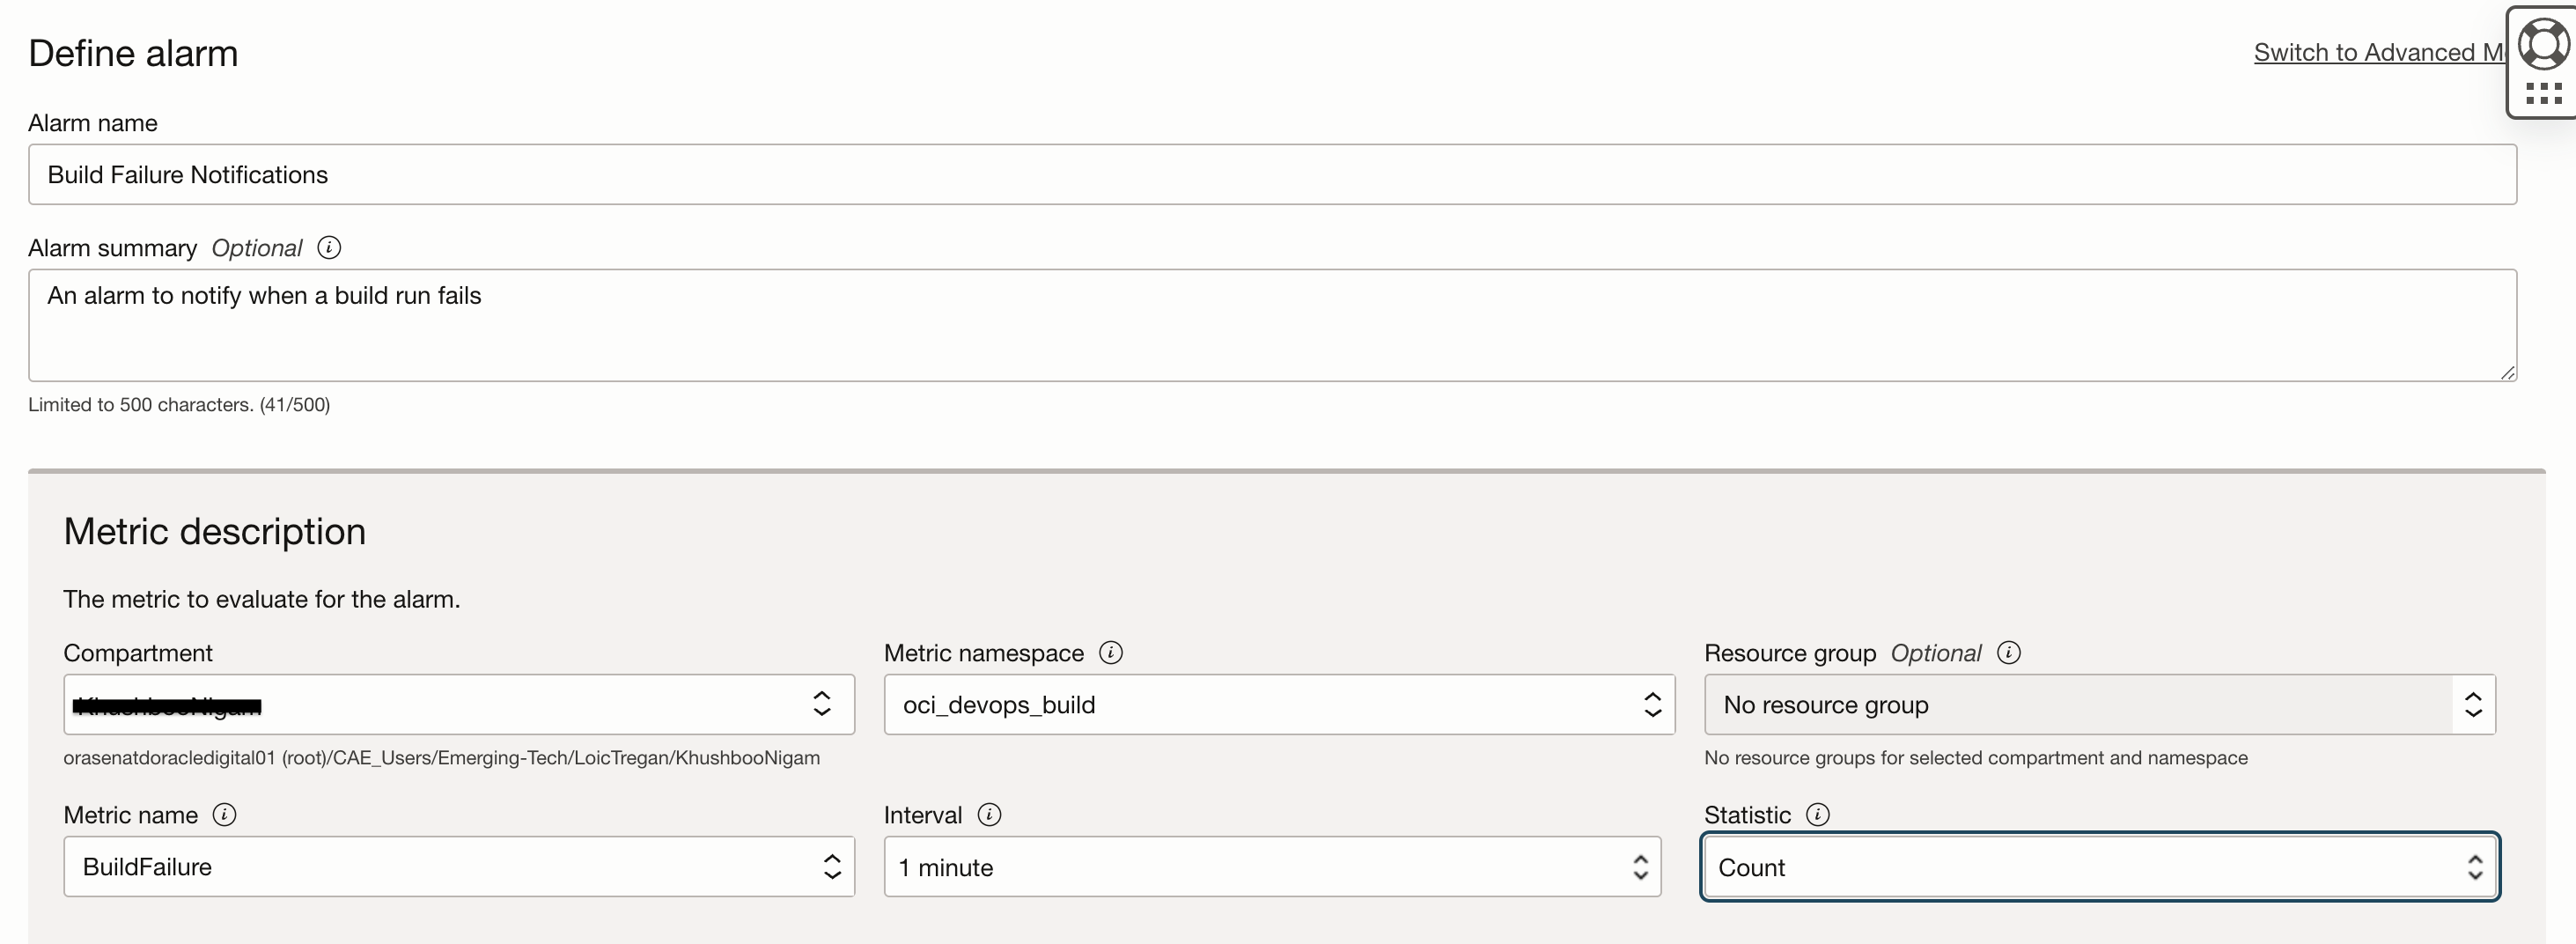
These metrics can also be used to trigger Alarms and send alert notifications on your choice of subscription when a set trigger rule is breached. For example, you can choose to receive alerts over your email id if certain build run has failed. In order to set up this Alarm, navigate to Alarms Definition in the Monitoring service and click on Create Alarm. Provide an appropriate name and summary. Select oci_devops_build as the Metric namespace so that you can select BuildFailure metric.
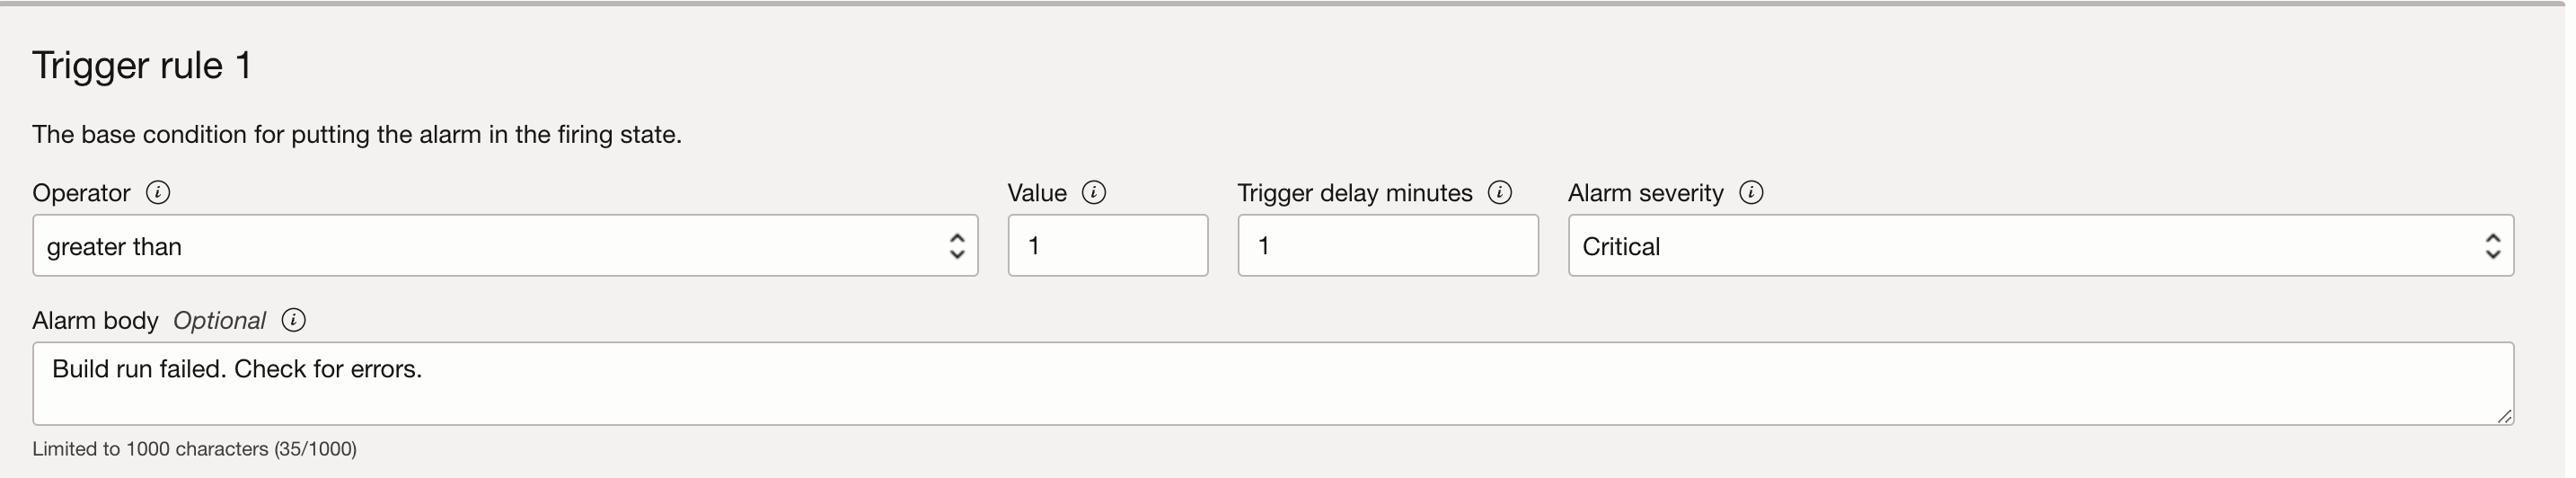
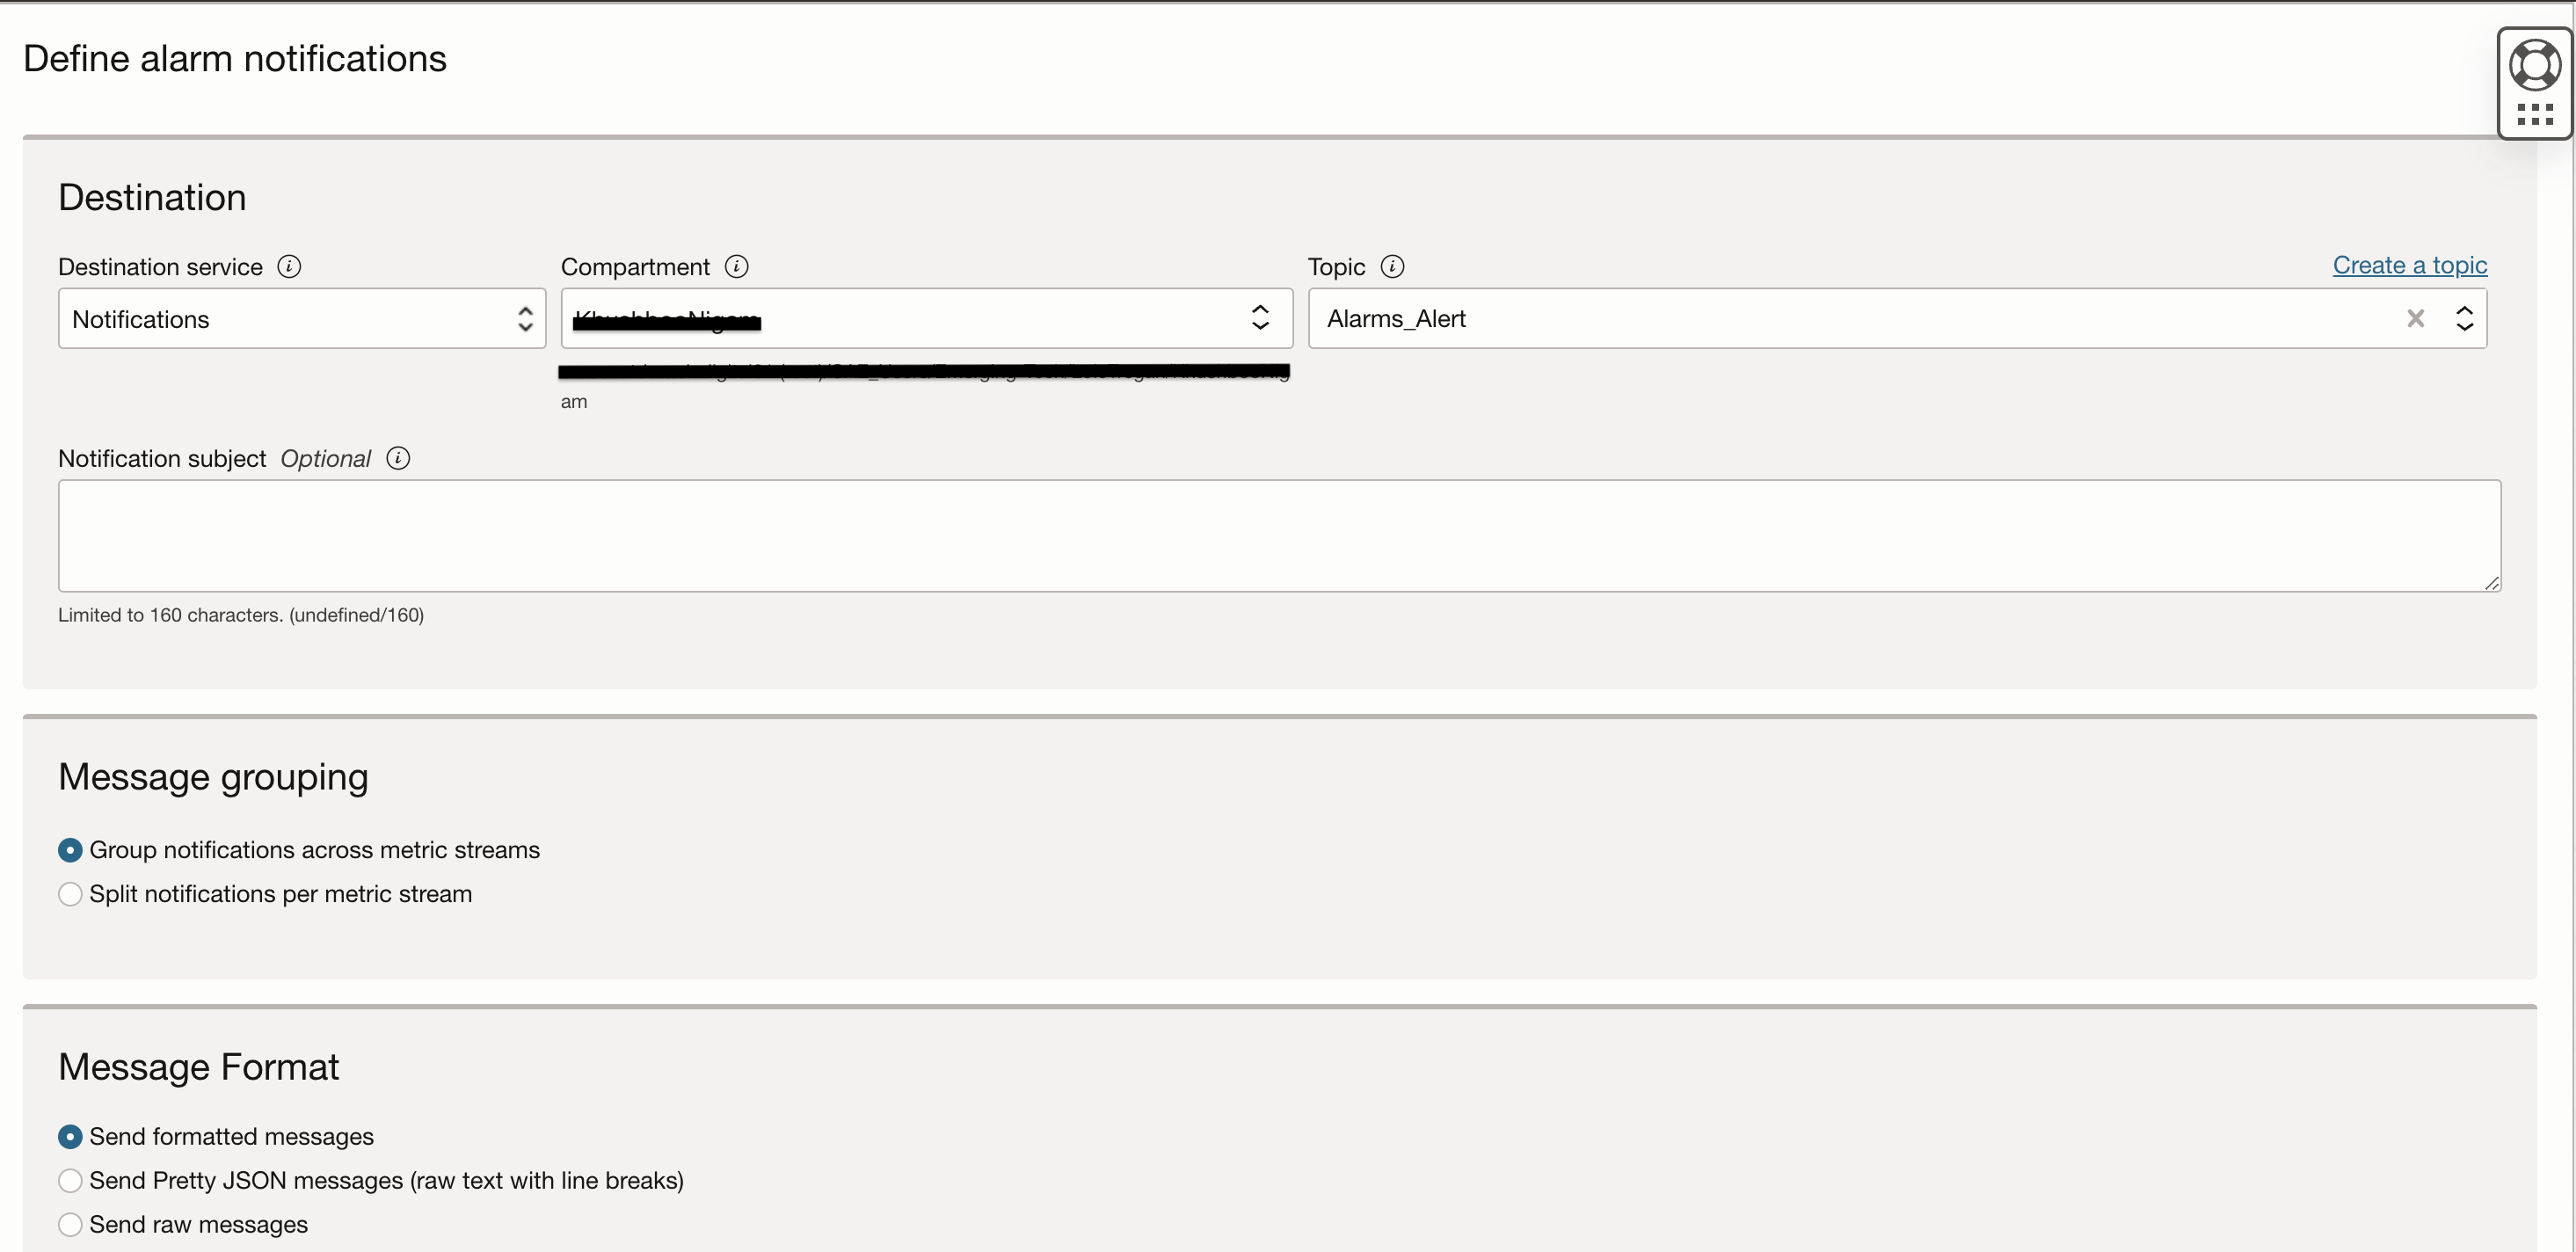
Trigger rule is the condition that puts the alarm in firing state and that further triggers the notifications. Note that notifications can be sent to email, as an SMS, Slack, PagerDuty platform or it can be used to trigger a function as well. You need to set up a Notification Topic separately by navigating to Developer Services -> Application Integration -> Notifications -> Topic. After creating a topic, you can select choice of your subscription. One topic can contain multiple subscriptions of different types.
These metrics can also be accessed at the DevOps project page by navigating to the Metrics section.
OCI Logging for OCI DevOps Service
Oracle Cloud Infrastructure (OCI) offers a robust and integrated logging solution that helps users collect, aggregate, and analyze logs from various OCI services, including DevOps. The OCI Logging service is designed to provide a comprehensive view of your cloud environment’s performance and behavior, making it easier to identify patterns, troubleshoot issues, and optimize your cloud resources.
In this blog section, we will specifically focus on how OCI Logging can help in collecting and analyzing logs from OCI DevOps services. DevOps components such as pipelines and stages are essential to the continuous integration and continuous deployment (CI/CD) process, and their performance directly impacts the efficiency of your development and deployment workflows.
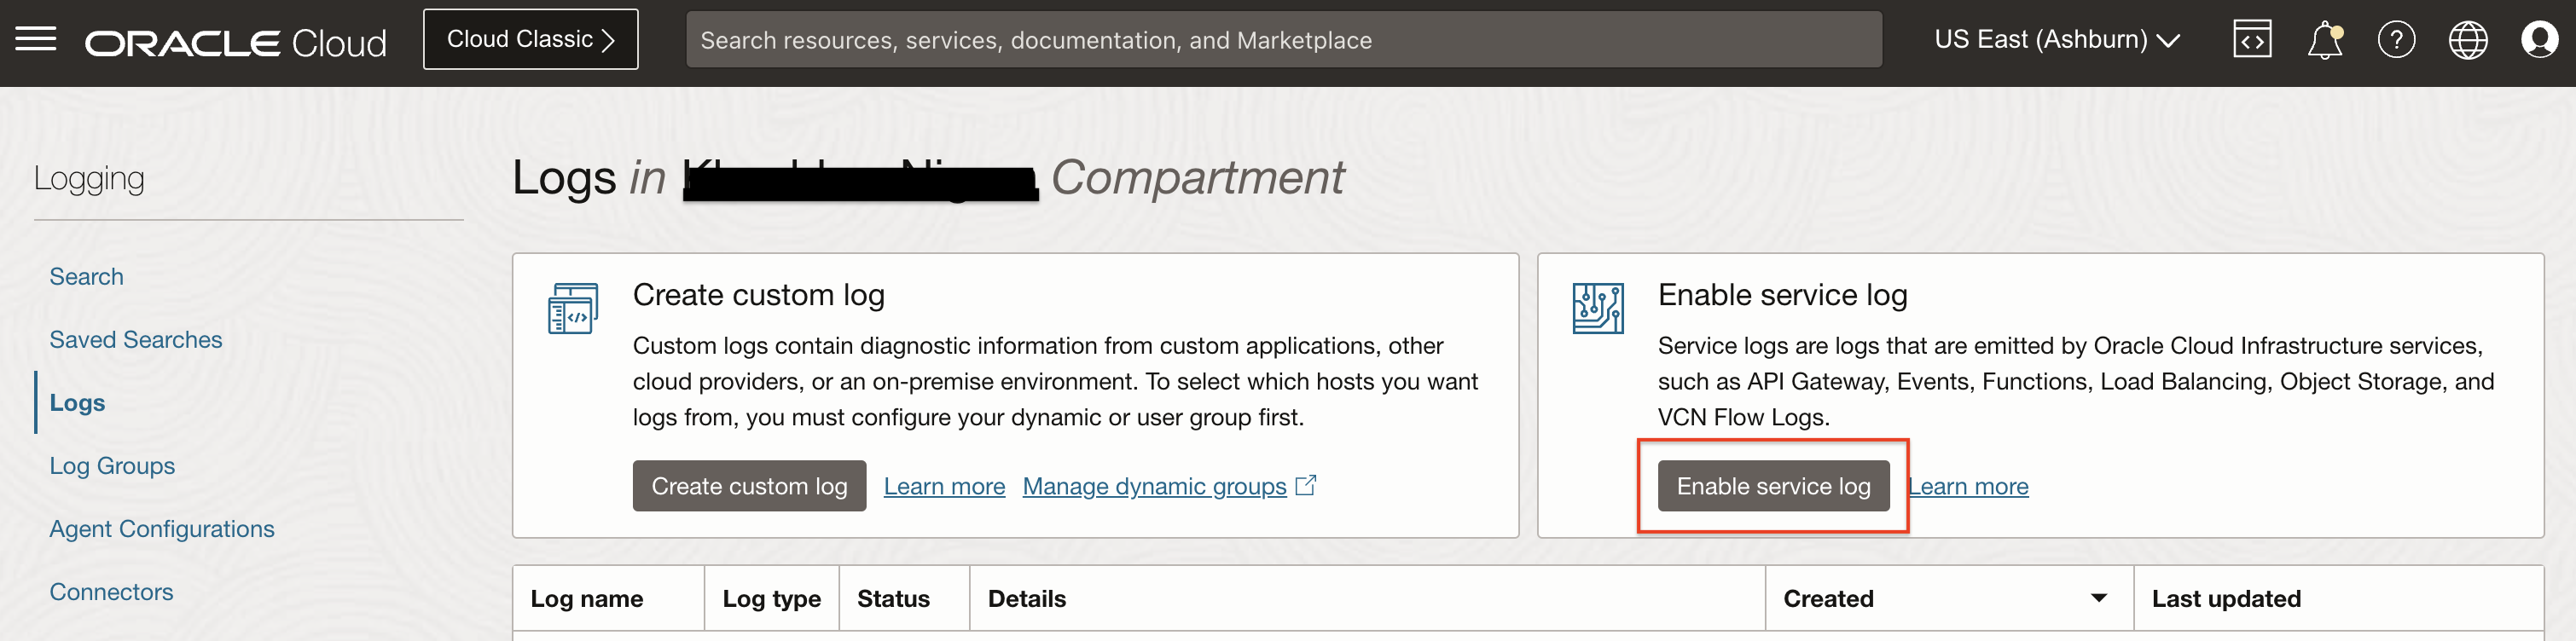
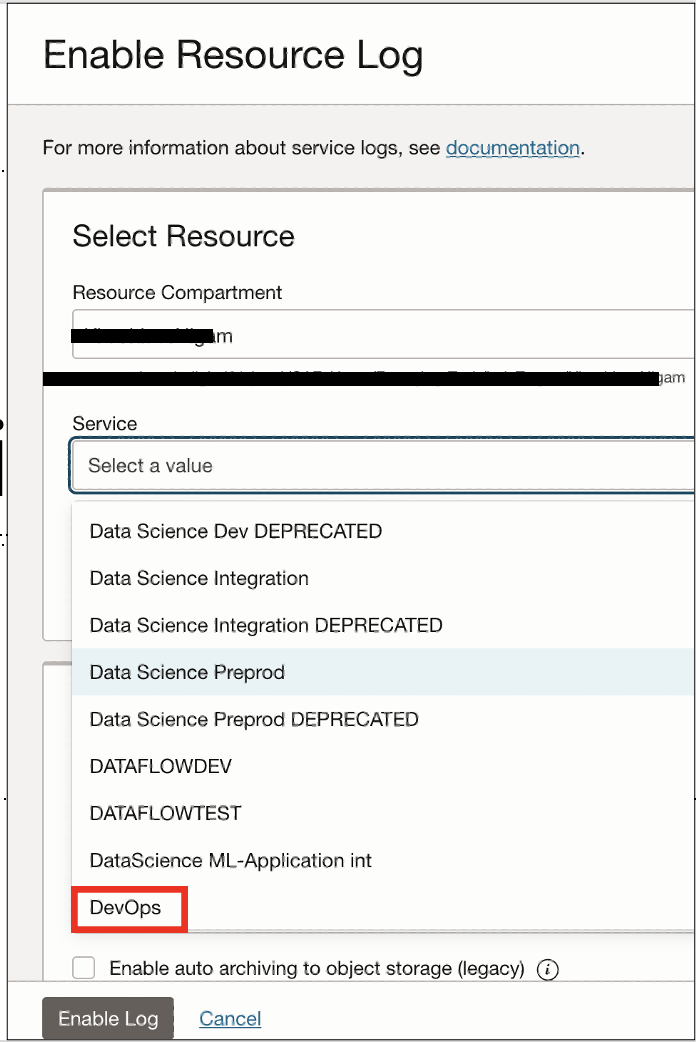
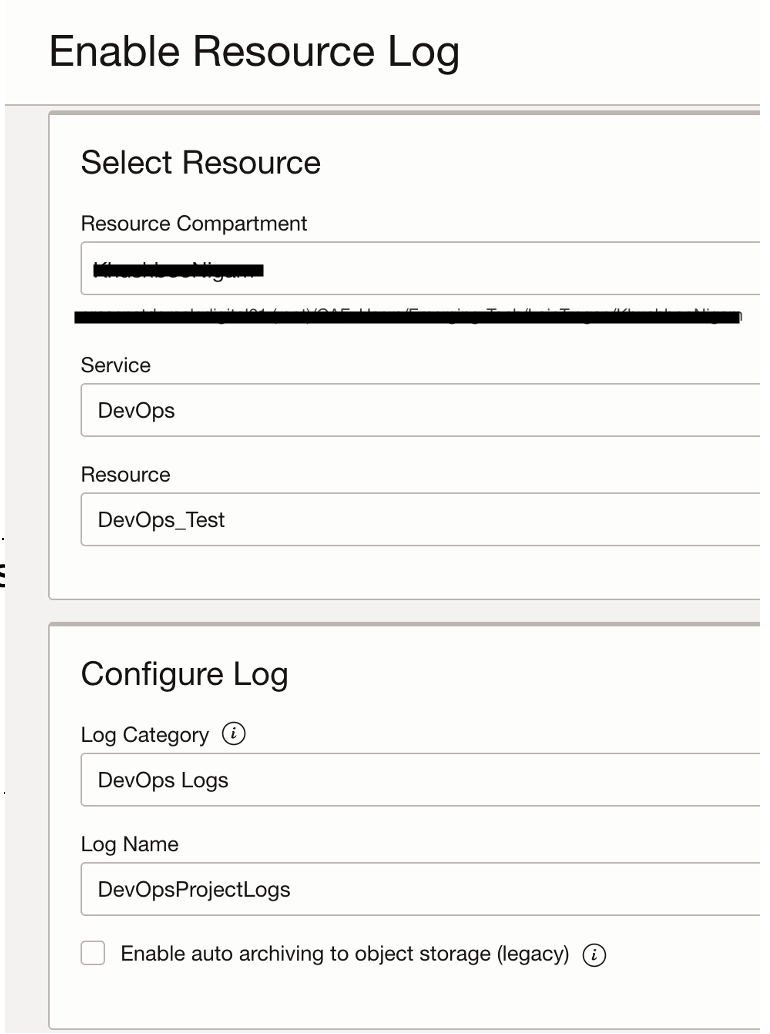
DevOps project offers a “DevOps-all logs” category which covers logs from all devops resources in a project. To enable these logs, navigate to Observability & Management -> Logging -> Service Logs. Click on Enable service Log, select the Compartment with your DevOps project and then select DevOps in the service list. Select the DevOps project in the Resource list on which you would like to enable logs.
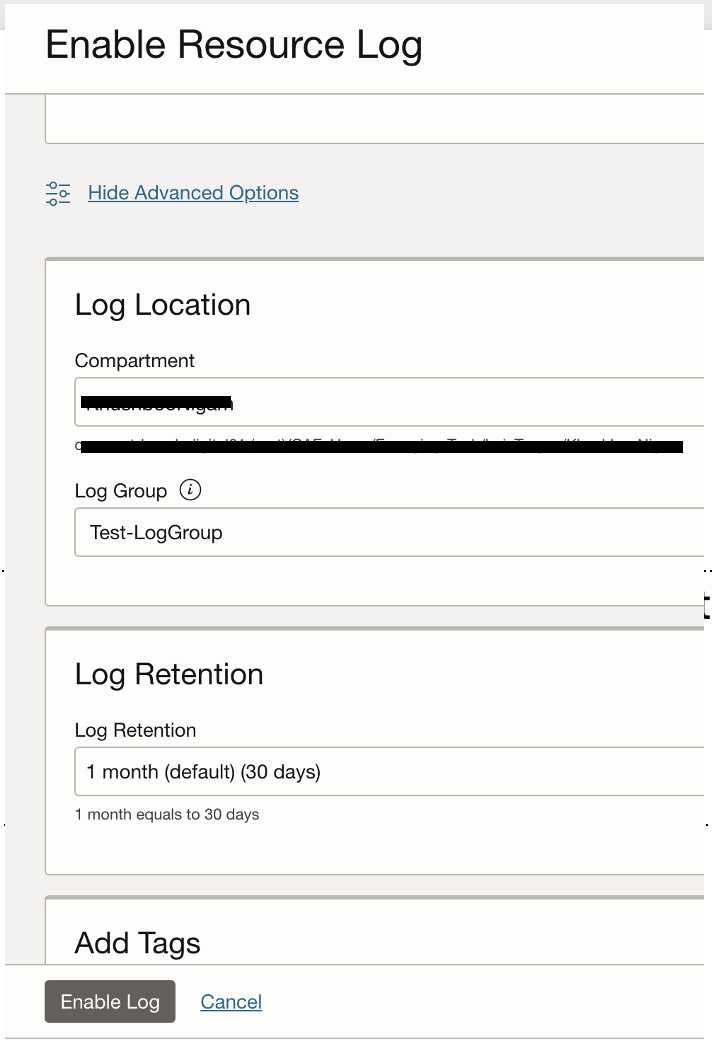
In the Configure Log section, select Log Category as DevOps Logs and provide a Log Name. It is important to note that once you click on Advanced Options, you are required to select Log Location where you choose the Log Group. Log Group are logical containers for your logs and you can limit access to logs by using IAM policies. Also, in the Log Retention section you can choose to retain these logs from 1 month to a 6 months time period. Note that 6 months is the longest the logs will be available in the OCI Logging service and if you would like to retain them longer, you can either move them to Logging Analytics or Object Storage bucket.
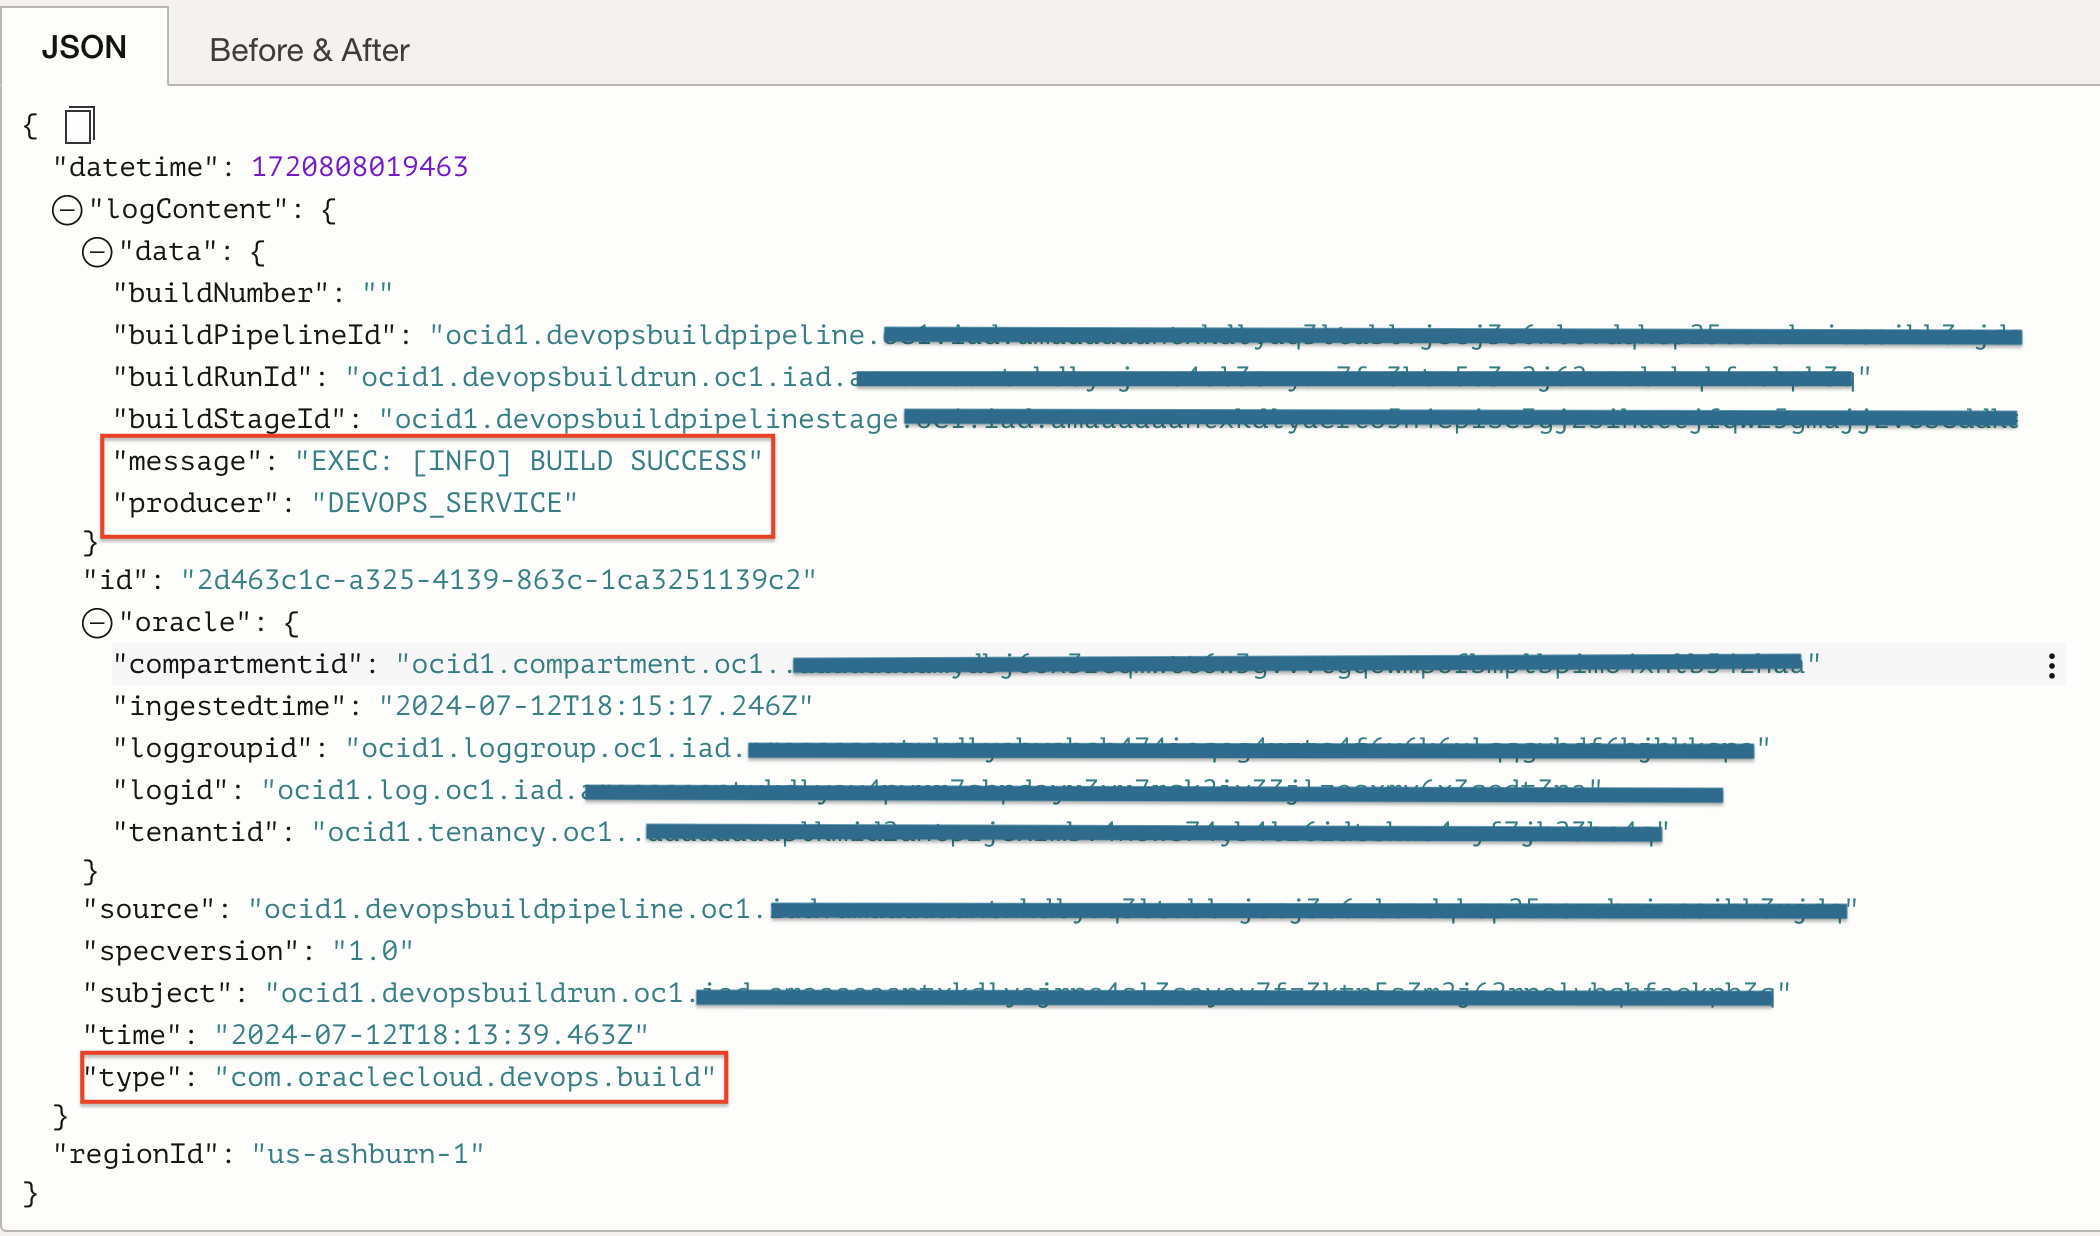
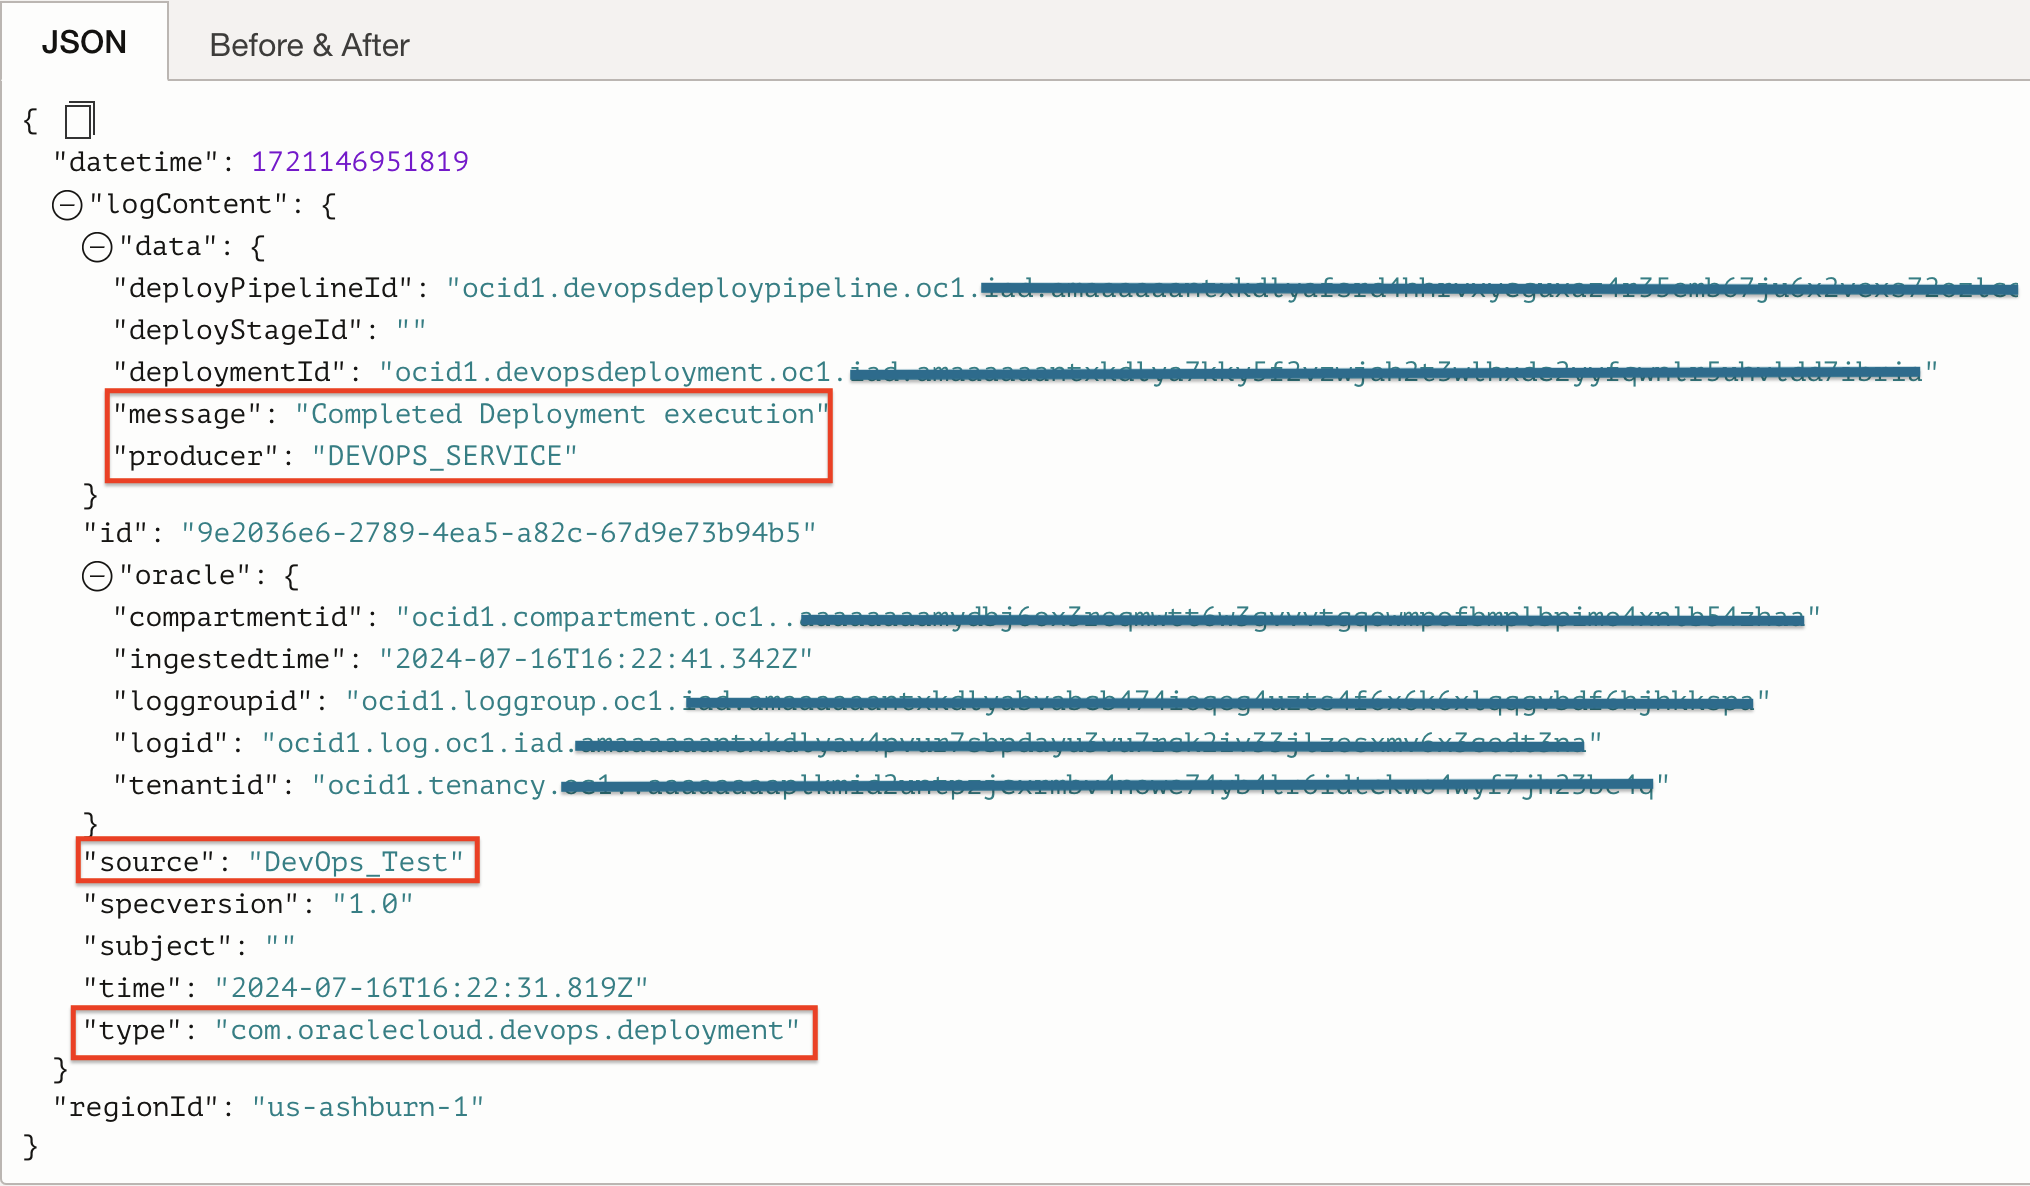
Some important information gathered from DevOps build and deployment logs are:
- Category of log whether it is Build or Deployment.
- Message describing a successful Build or successful deployment execution.
- Producer of the log message, if it is the DevOps service or a script from customer.
- Project name.
- OCIDs of resources such pipelines, runs, stages.
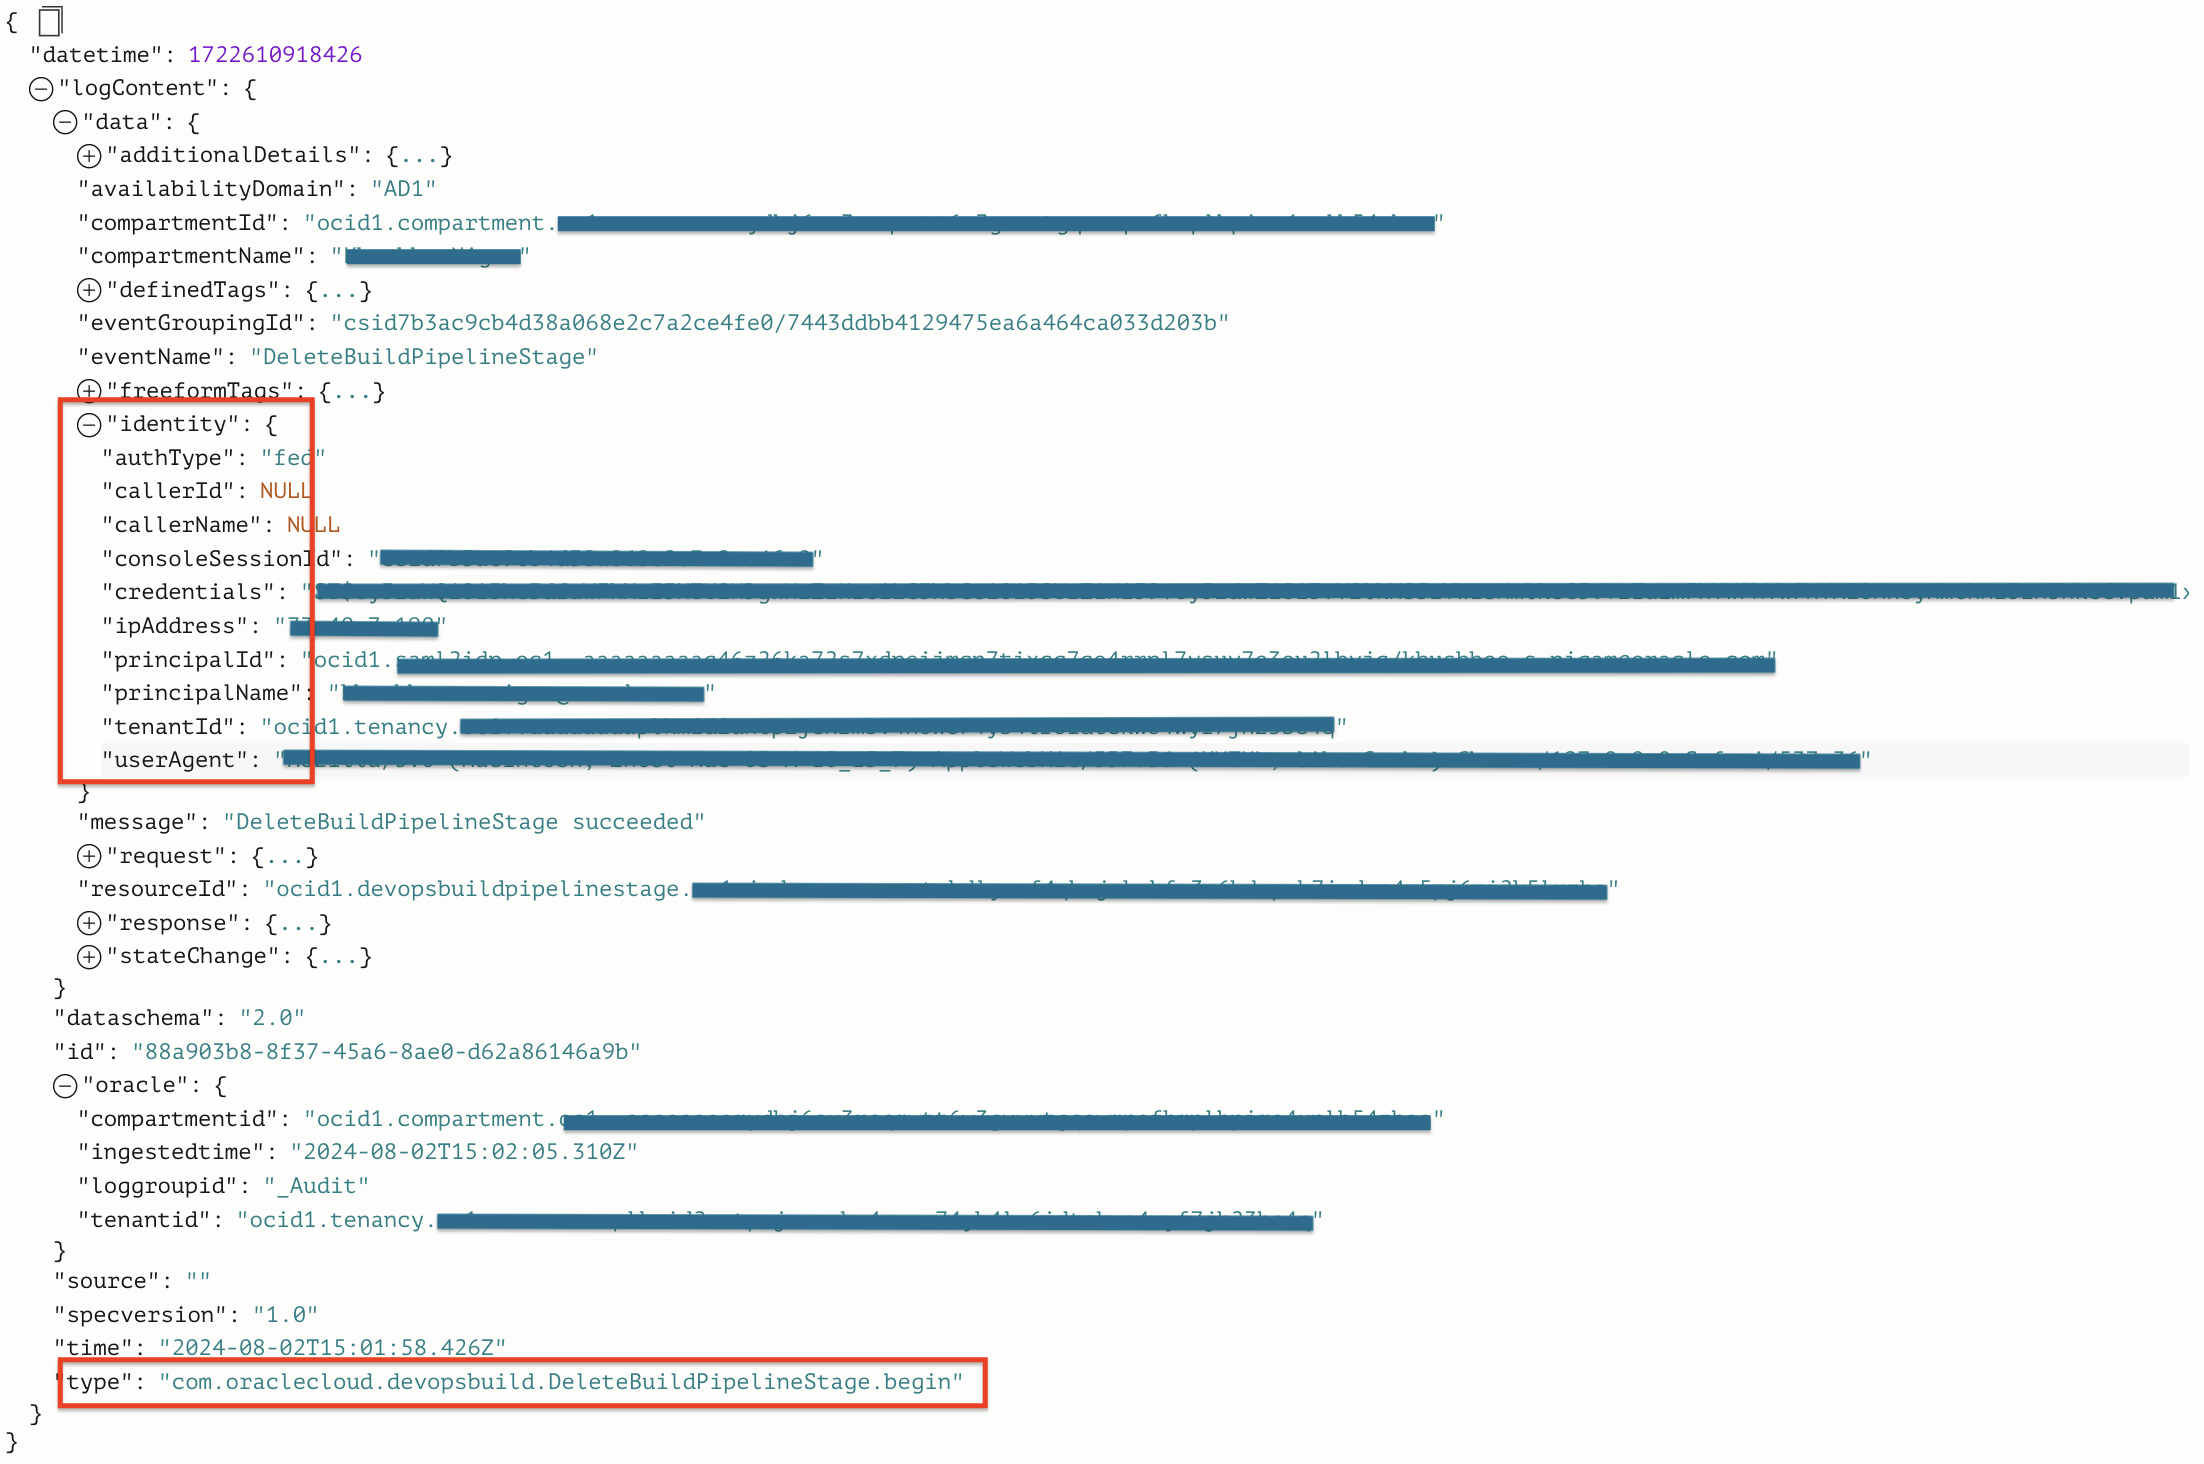
Audit logs are another place within the OCI Logging service to see who is accessing which resource in the tenancy. It captures all API calls including GET, DELETE, POST. Looking at the audit logs you can discover who created, accessed, updated or deleted a particular DevOps resource. The image below shows one example of an audit log which captures deletion of a stage from a build pipeline. The identity block in the audit log shows details of the user who deleted the stage.
OCI Logging Analytics for OCI DevOps Service
Oracle Cloud Infrastructure (OCI) Logging Analytics is a powerful tool for aggregating, storing, and analyzing log data. It offers a comprehensive solution for organizations seeking to improve their log management practices and gain deeper insights into their DevOps operations.
One of the key strengths of OCI Logging Analytics lies in log aggregation. It can collect logs from various sources, including applications, databases, and infrastructure components, and centralize them in a single location. This aggregation capability simplifies log management, providing a unified view of log data across the entire IT environment.
Another advantage of OCI Logging Analytics is its ability to support long-term log retention. Organizations can retain logs for extended periods, ensuring compliance with regulatory requirements and enabling historical analysis. The service offers scalable and cost-effective storage options, allowing organizations to retain vast amounts of log data without burdening their infrastructure or budgets.
Furthermore, OCI Logging Analytics excels in advanced analytics capabilities. It provides a range of tools and techniques for analyzing log data, including log parsing, filtering, and correlation. With its advanced search and query functionalities, organizations can quickly identify patterns, trends, and anomalies within their log data.
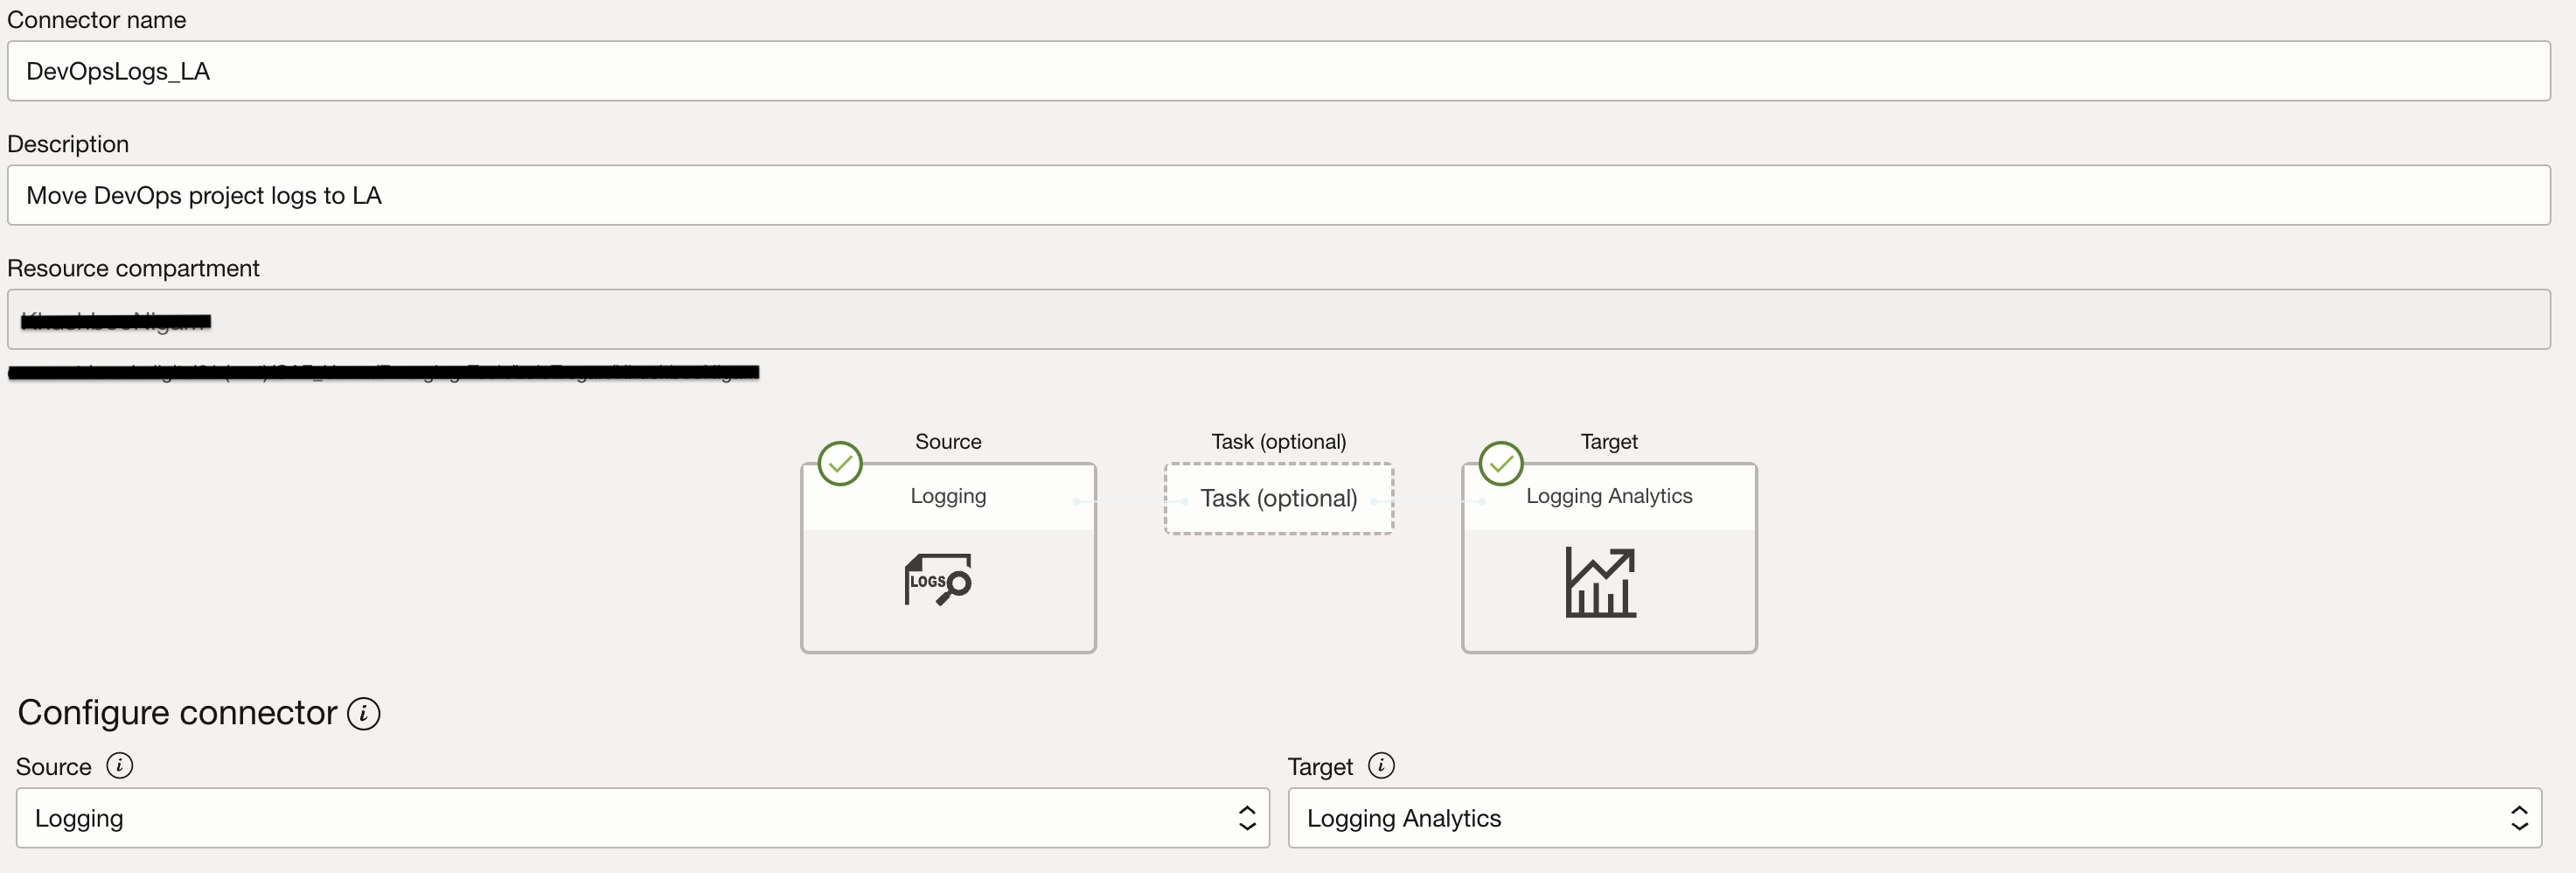
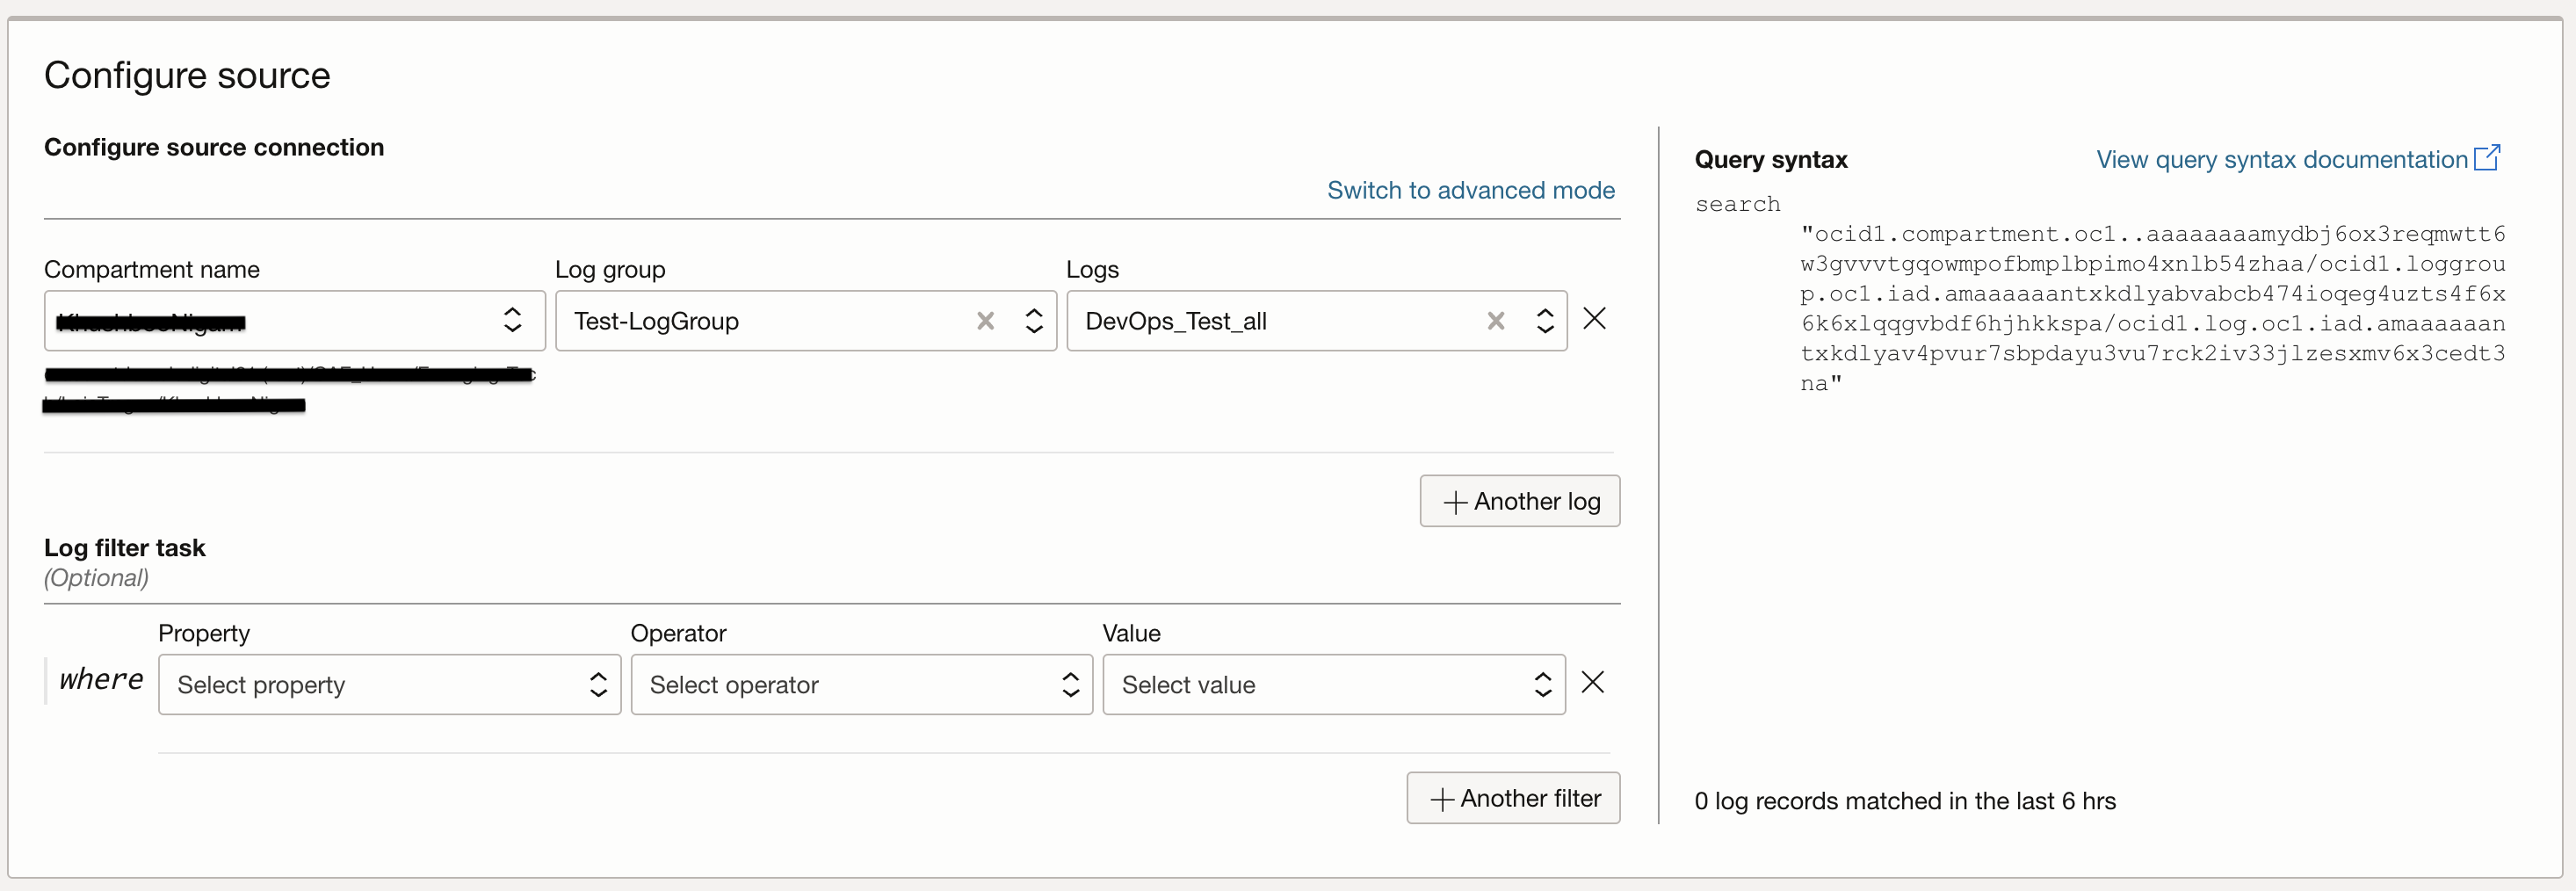
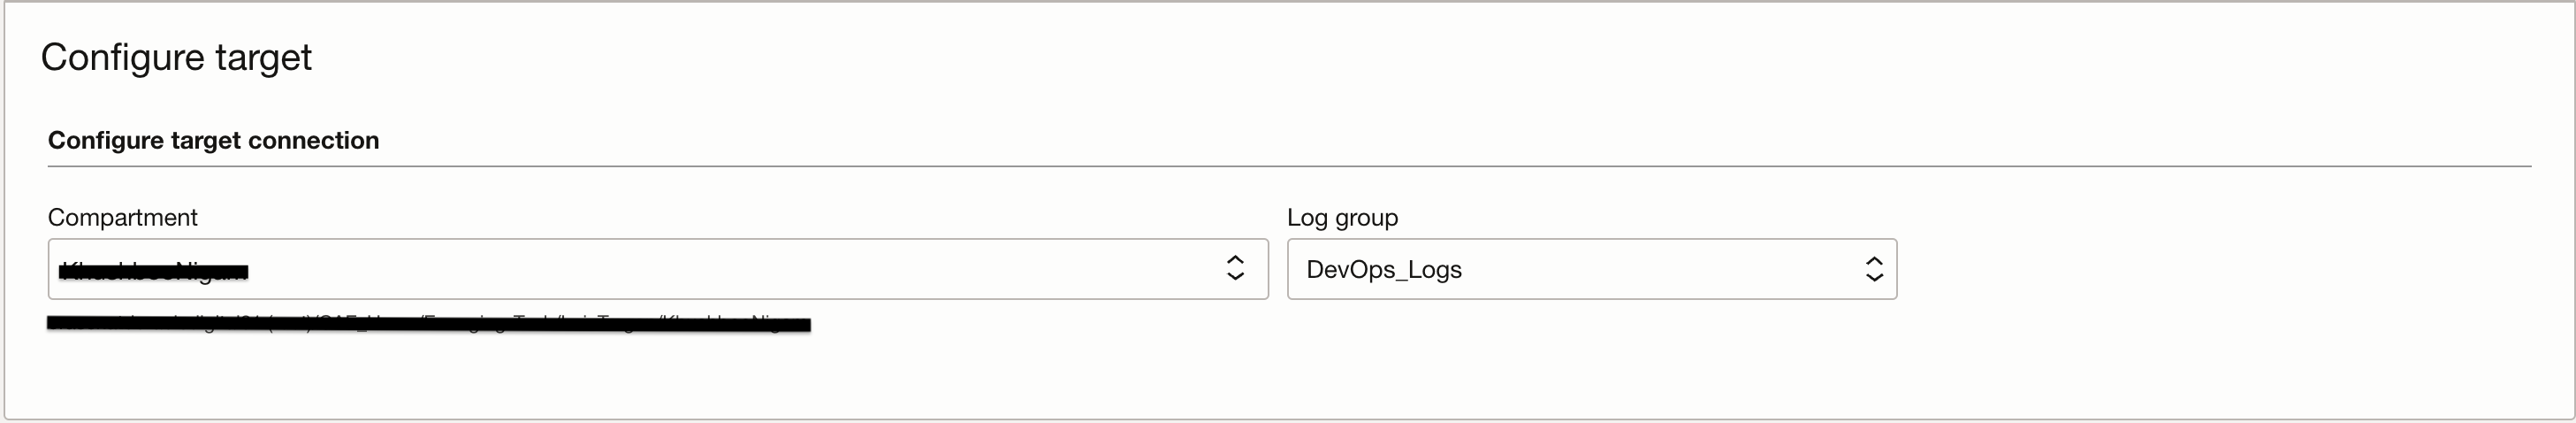
Once DevOps logs are enabled in OCI Logging service, they can be sent to Logging Analytics for both long-term retention as well as advanced analytics. Service Connector is an Observability & Management offering that makes it easy to move logs between these two services. Navigate to Observability & Management -> Logging -> Connectors, provide an appropriate name and description. Source service is Logging and you have to choose logging Log Group and Logs related to your devops project. Target service is Logging Analytics and a logging analytics Log Group is needed as the target log group. The logging analytics group needs to be created as a pre-requisite of creating a connector.
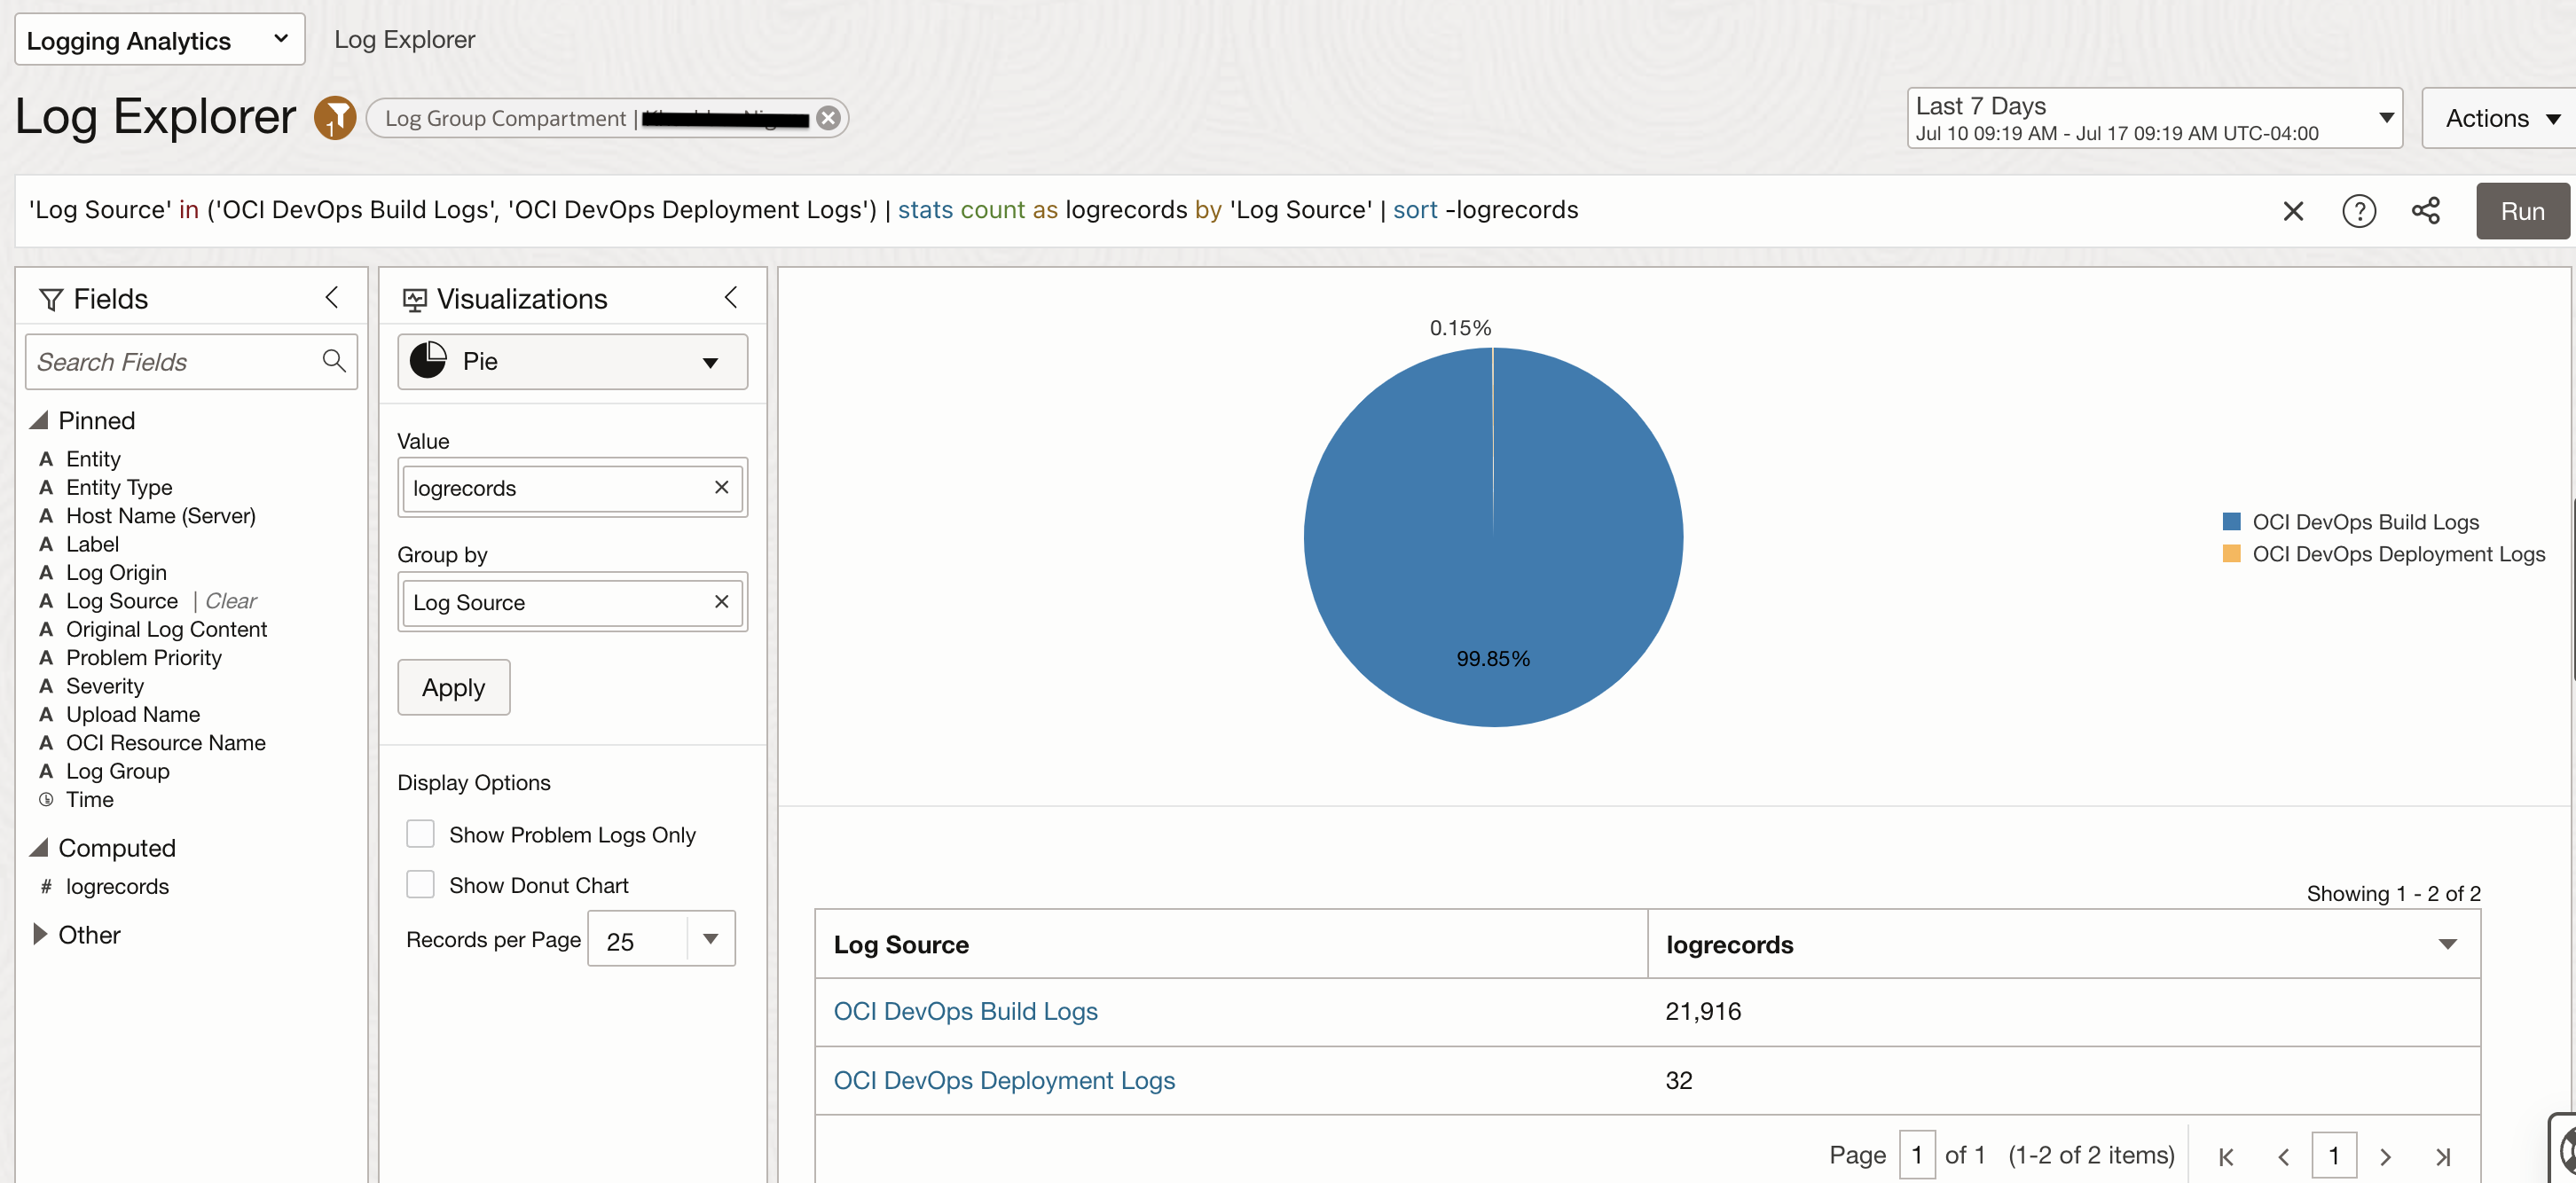
Once Devops logs are ingested in Logging Analytics, they are automatically parsed based on category which is either Build or Deploy and are also associated to the corresponding Log Source. OCI DevOps Build Logs and OCI DevOps Deployment Logs are the Log Sources in Logging Analytics as shown in the Log Explorer page below.
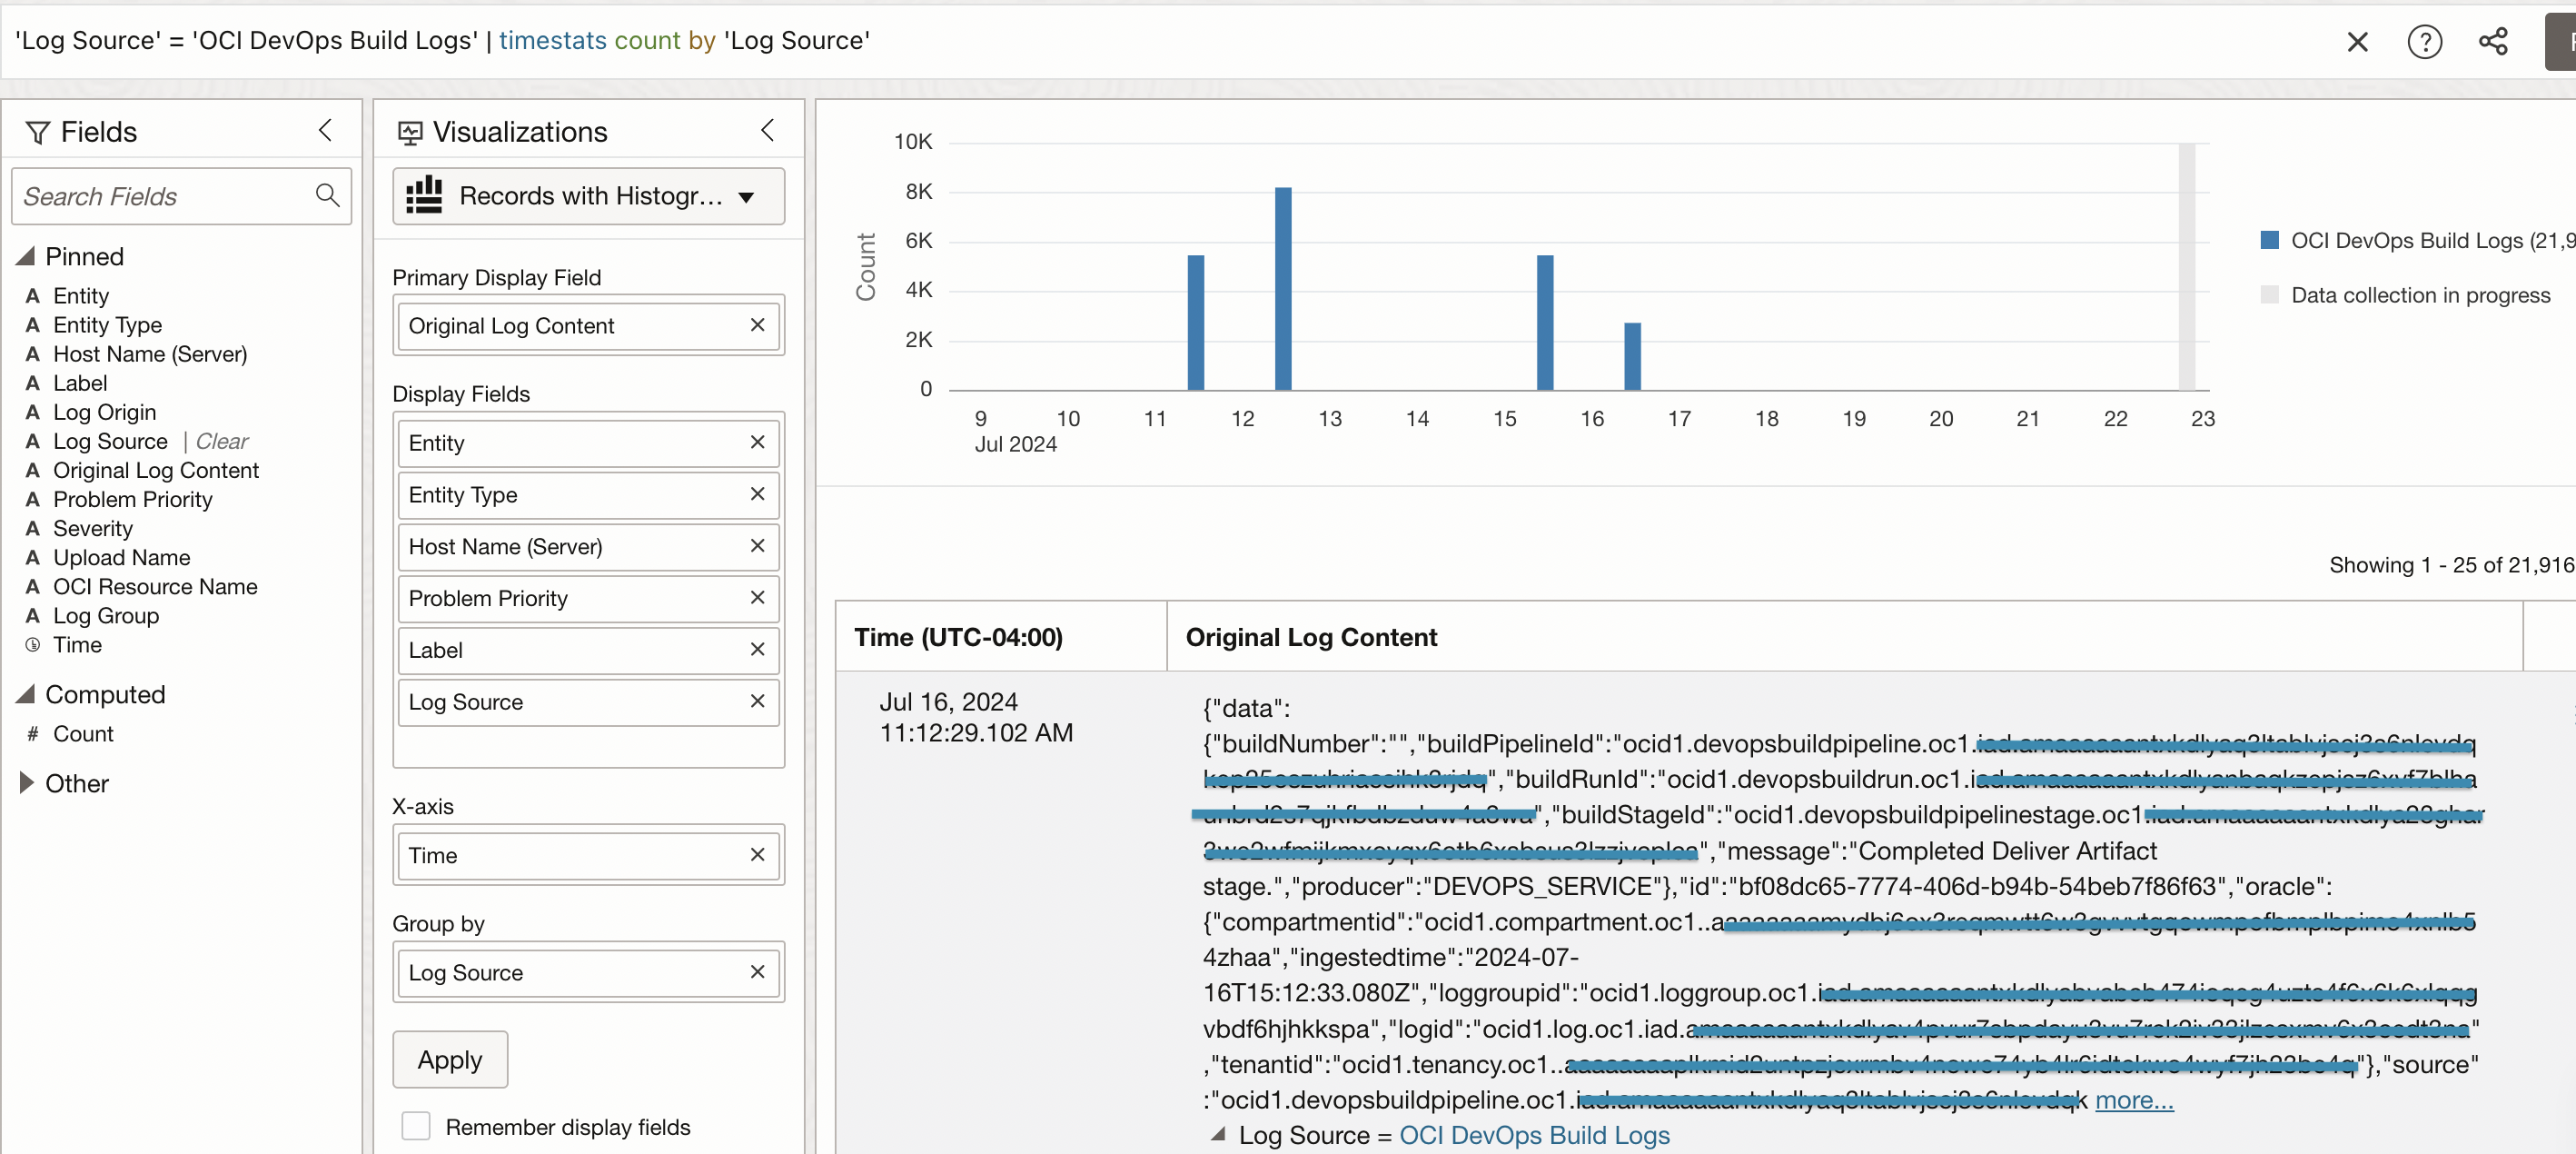
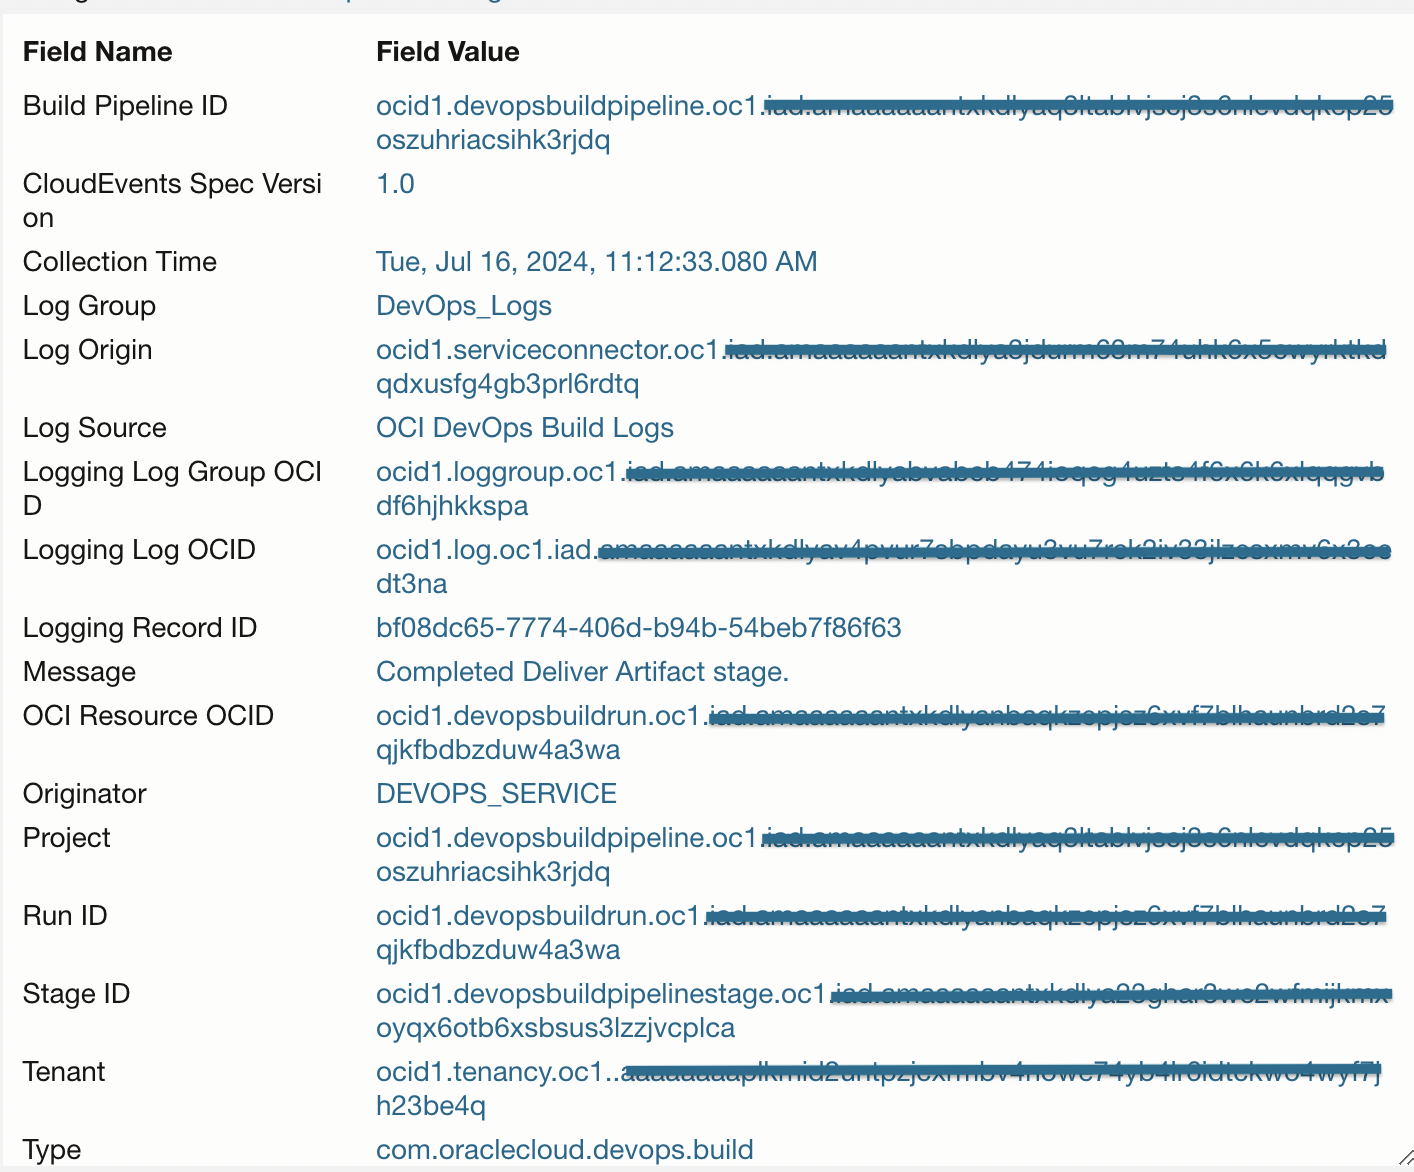
You can further drill down into one of these log sources and look at detailed log content by switching the Visualization to a Records with Histogram type. Original Log Content shows the ingested log data in the original raw format and also in an easy to read tabular format as shown in the second image below. All the text in blue color are interactive and can be easily used for further filtering the log data. These selections are available in the Fields section as well.
Once you search through the logs based on different fields and choose a suitable visualization type, you will see custom query being build up simultaneously in the log explorer section. This search query can be saved and will be available in the Saved Searches section. You can also add these searches to a dashboard if you would like to frequently take a look at the resulting log data or patterns.
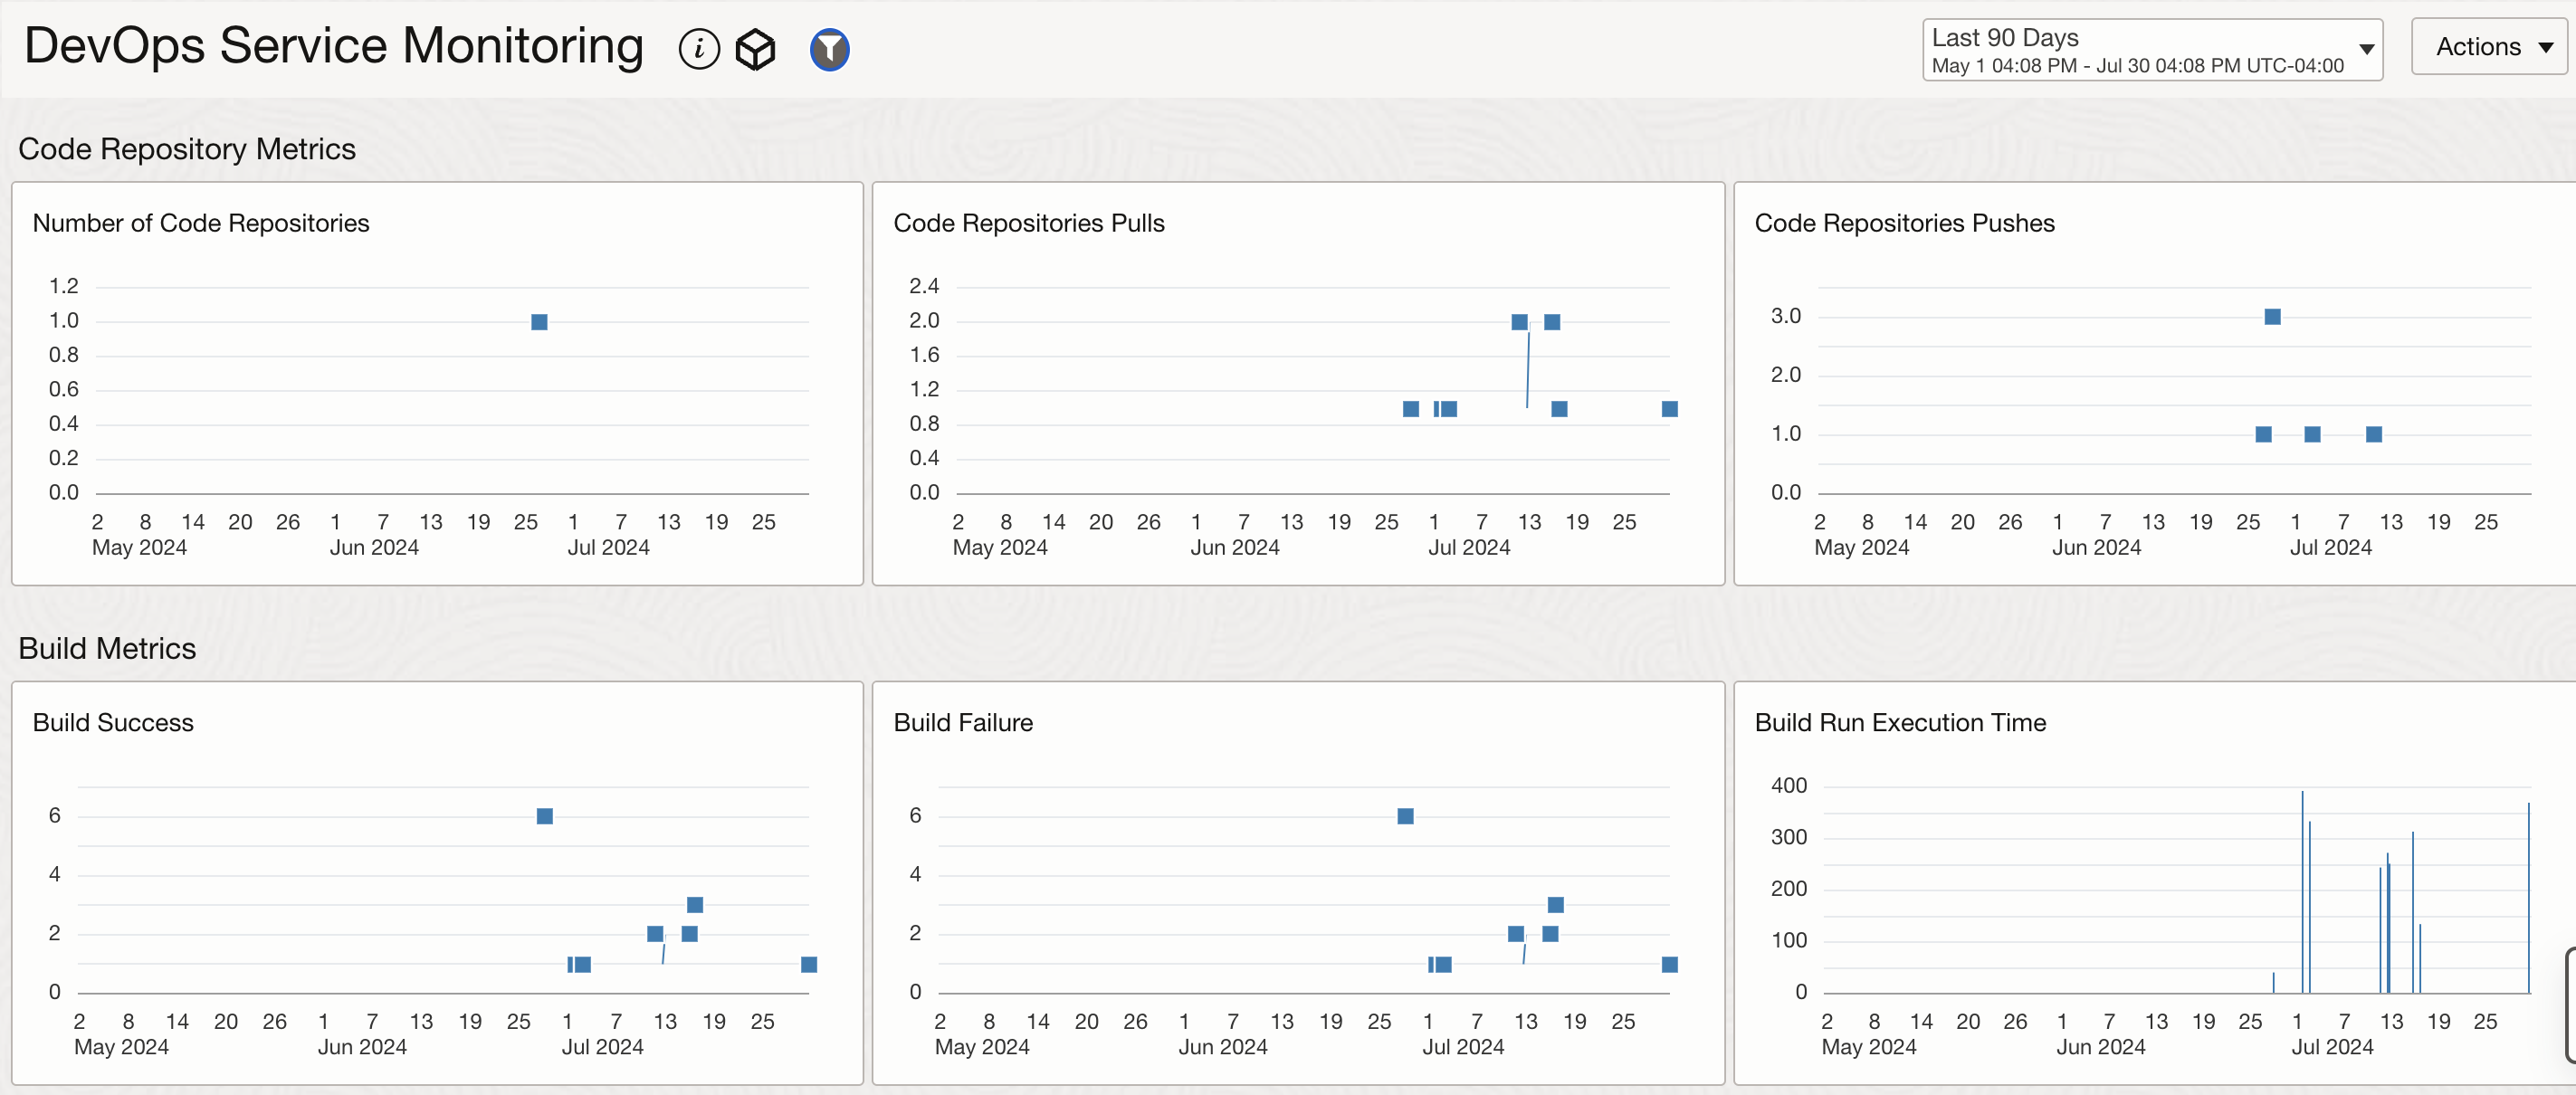
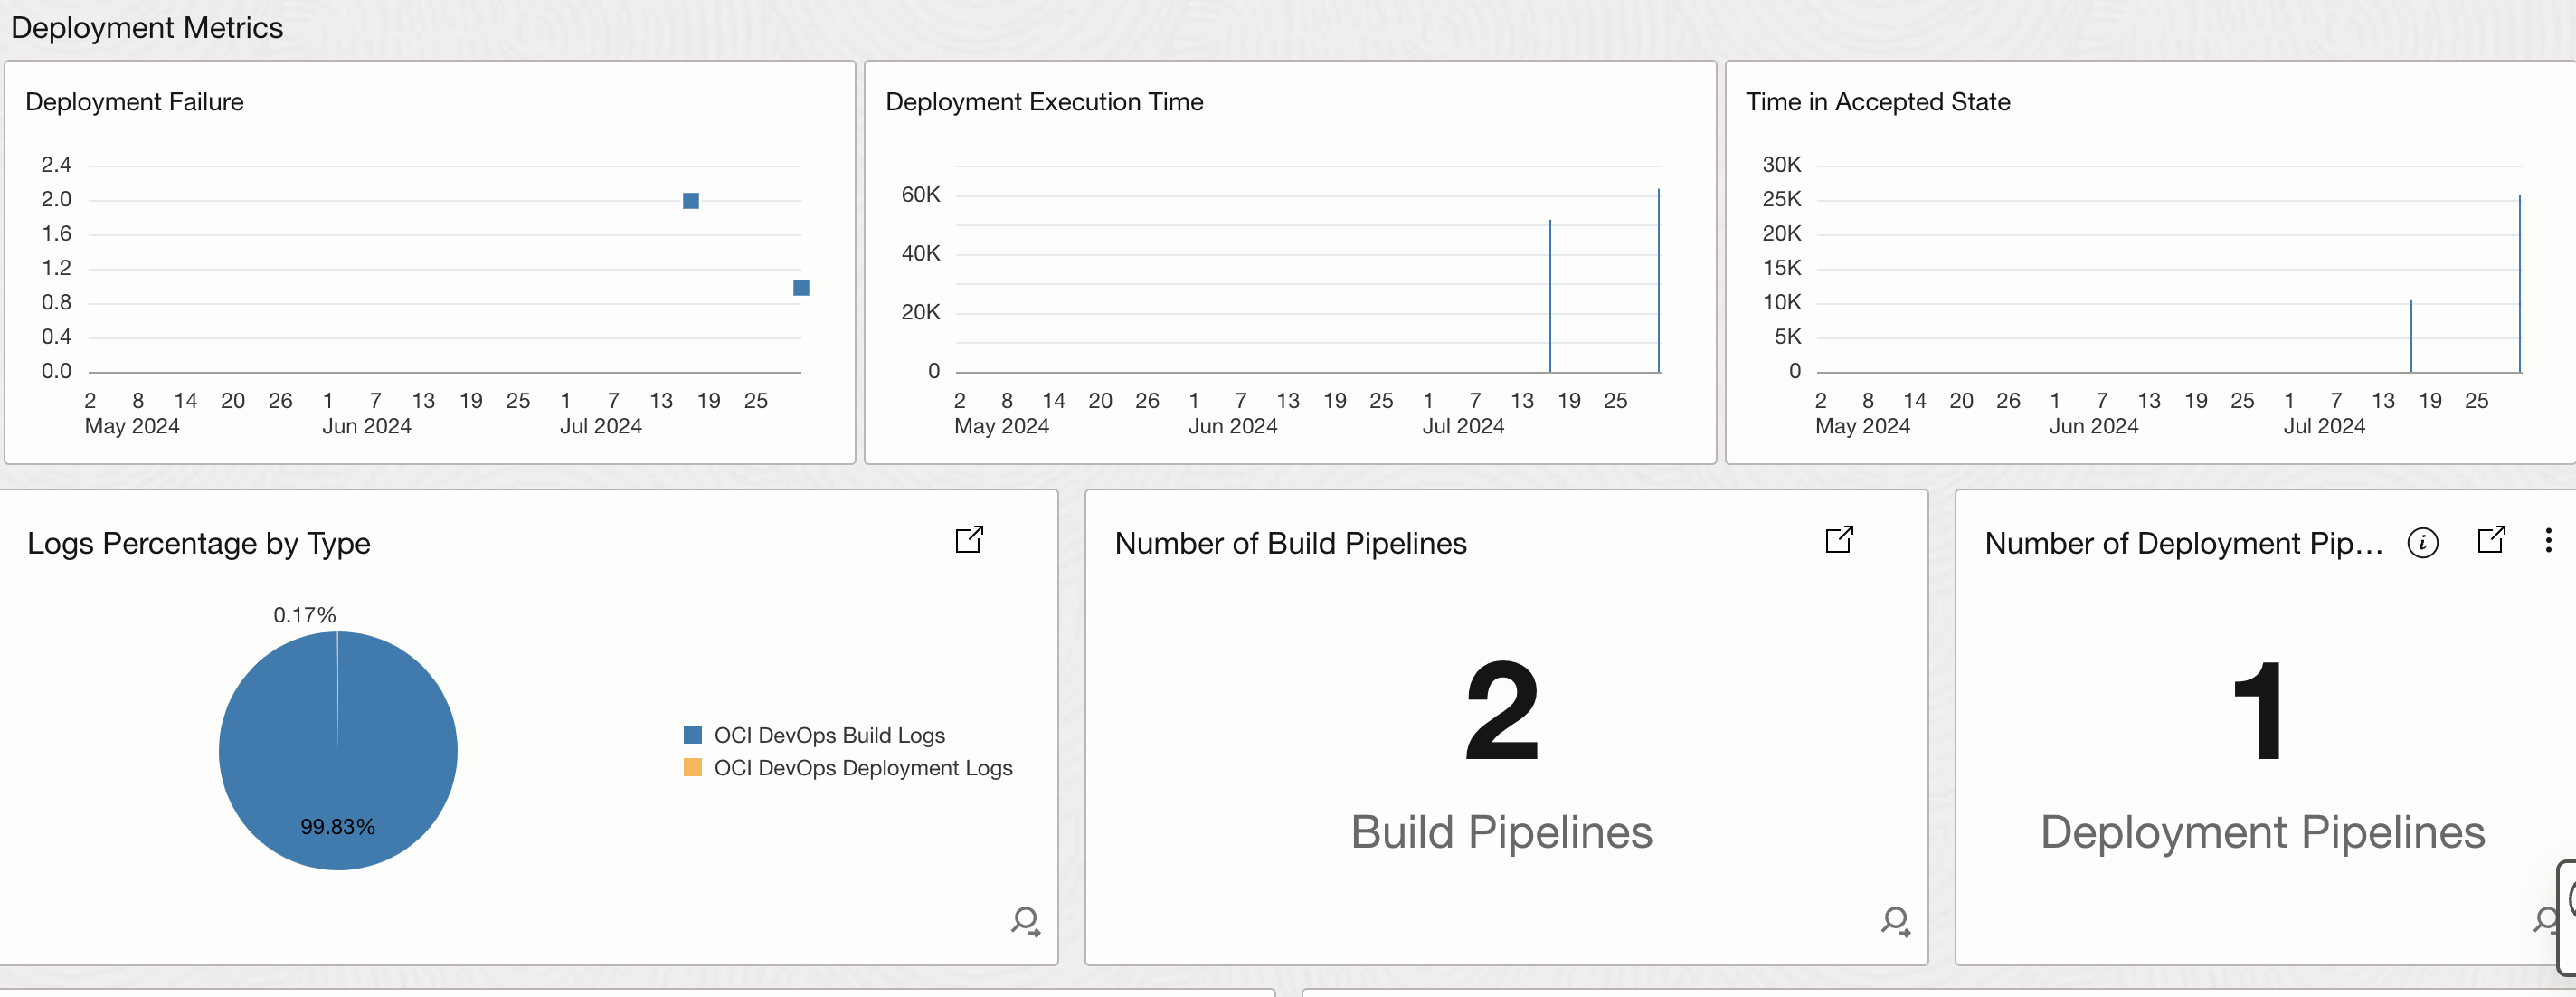
The image below shows a sample dashboard for monitoring DevOps service. A dashboard gives you capability to add both metrics and custom log searches.
- The first section widgets here shows the metrics related to code repo, build metrics, deployment metrics.
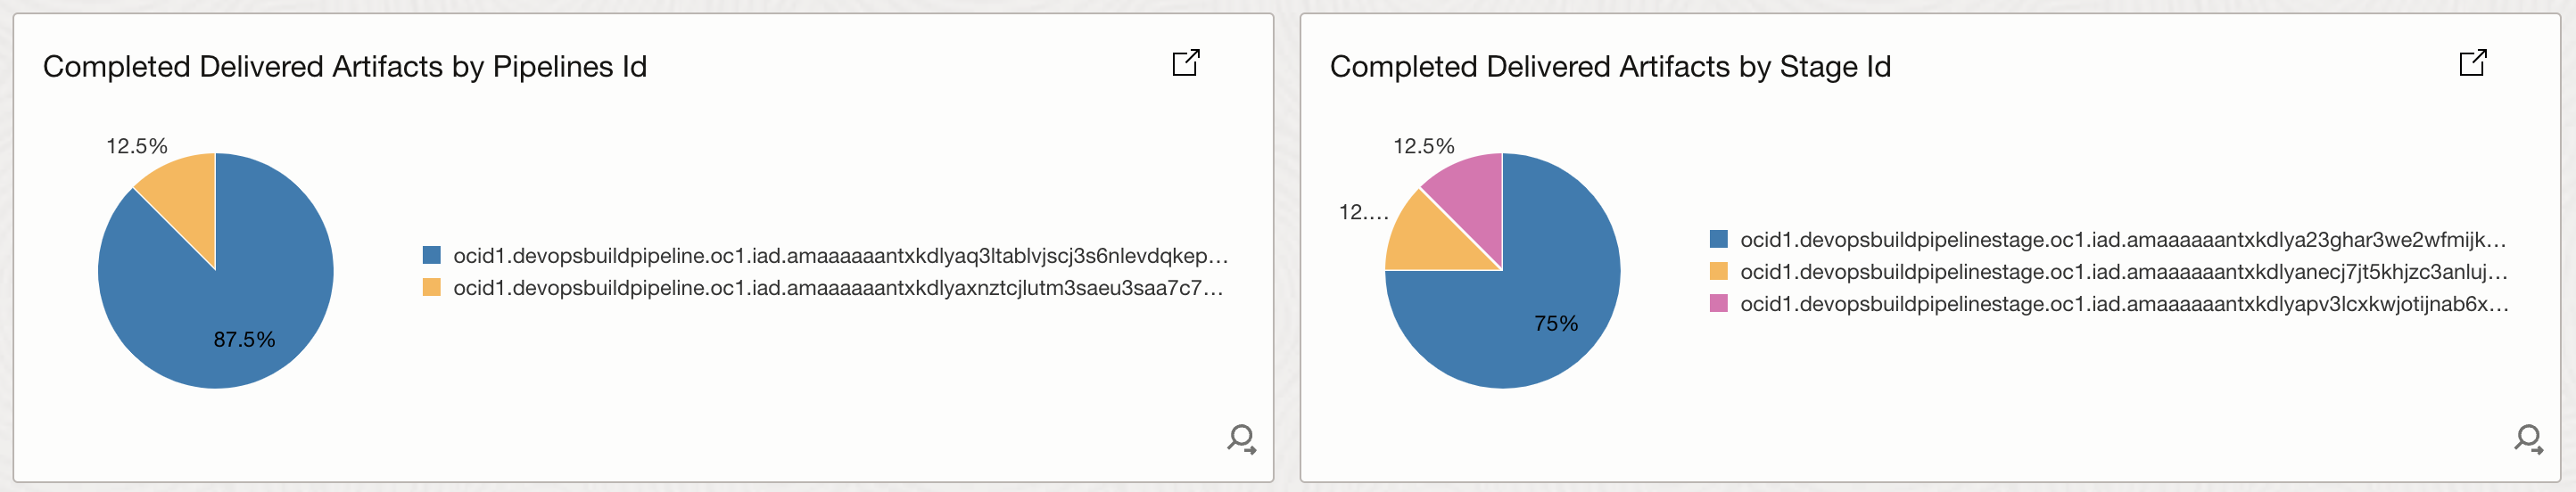
- The second section widgets are based on the log data from both build and deployment logs. They show the amount of logs from both the pipelines, number of build and deployment pipelines, “Completed Delivered Artifacts” segregated by Pipelines ID and Stage ID.
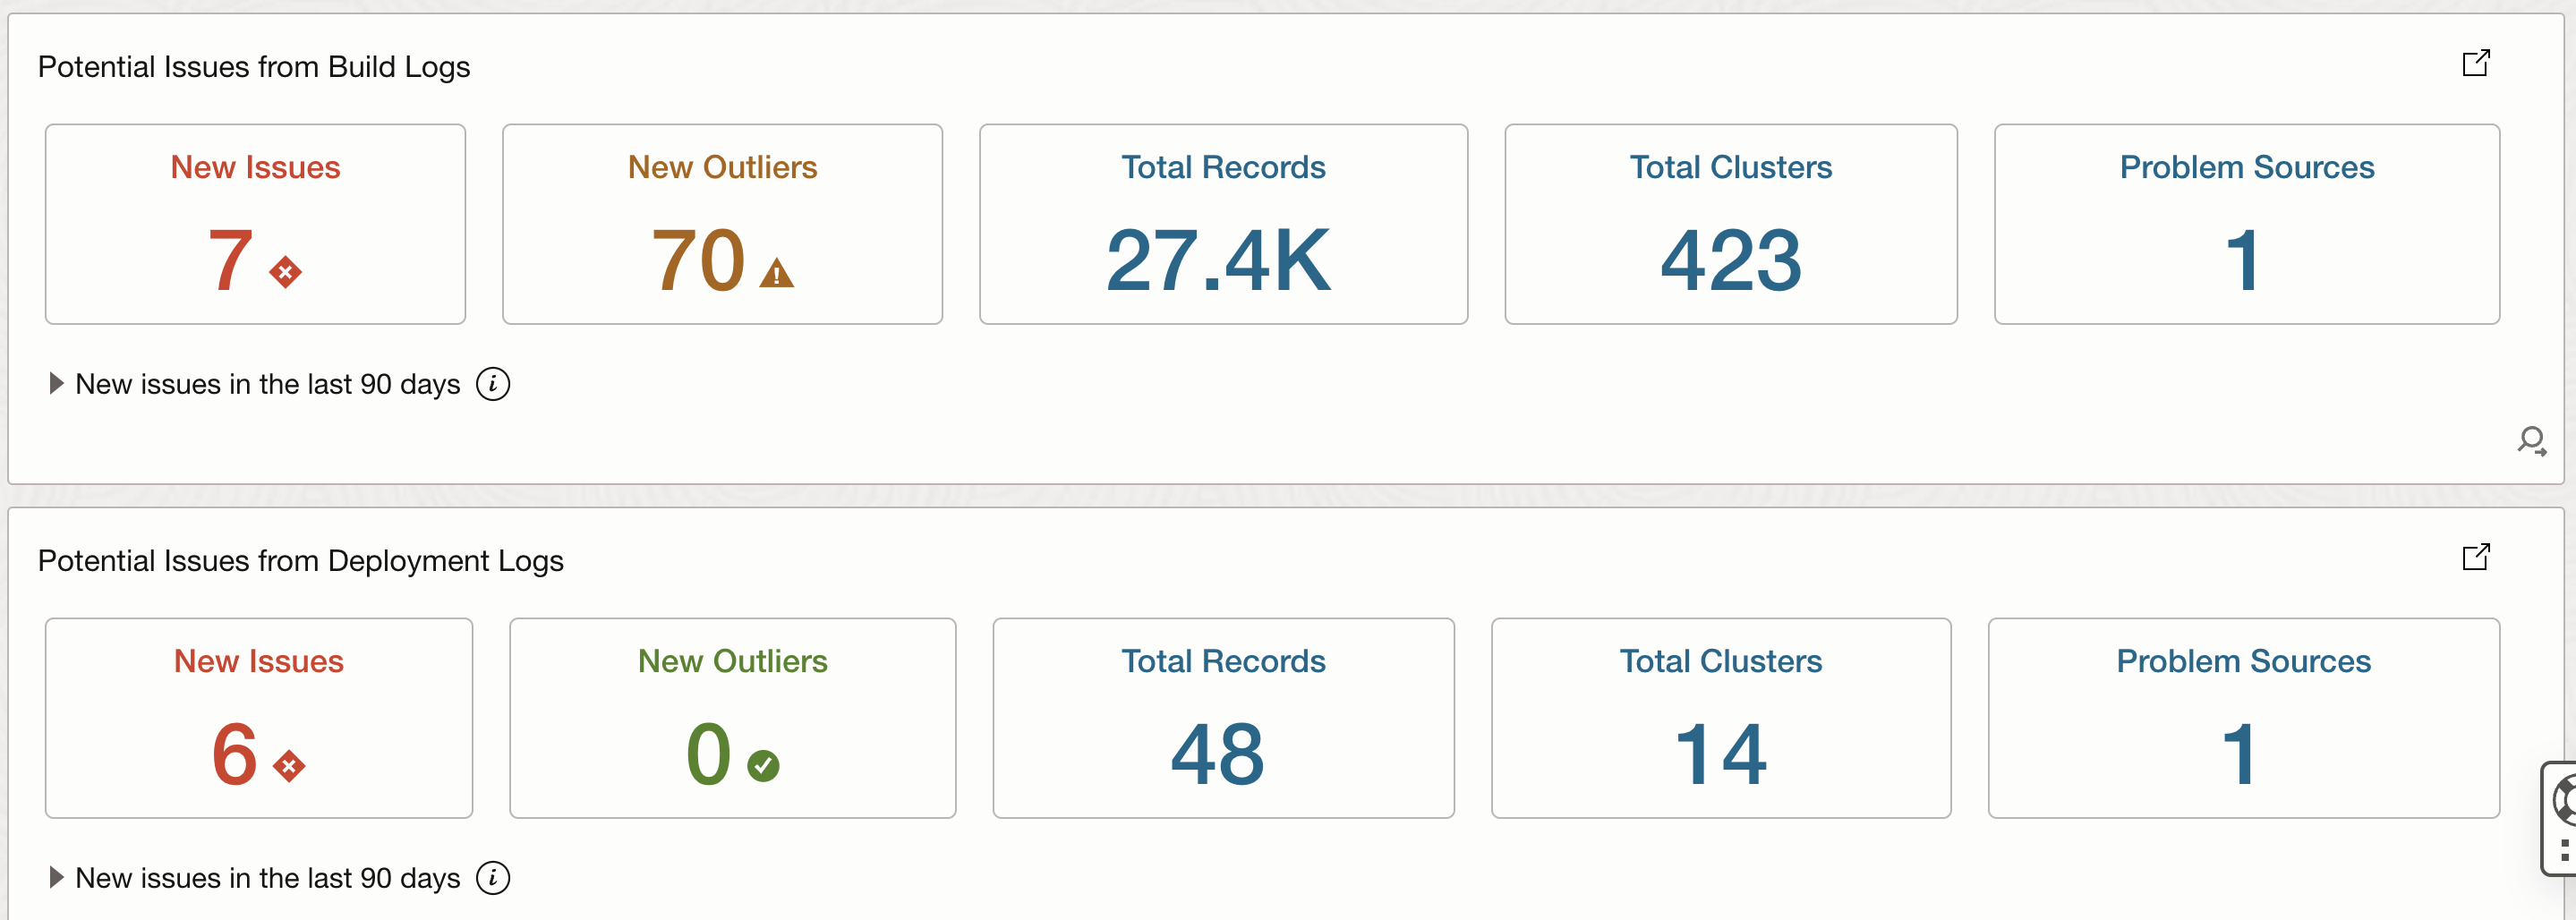
- The third section shows 2 widgets which leverage ML based visualization capabilties to show issues, outliers, clusters from build and deployment logs.
OCI Events for OCI DevOps Service
Oracle Cloud Infrastructure (OCI) Events service is a highly scalable and durable event service that helps you build reactive systems that react to state changes or events. Events are produced by many OCI services when a change of state occurs, such as an object being uploaded to Oracle Cloud Storage. You can also write code to publish custom events to the Events service.
The Events service provides a flexible and reliable way to route these events to functions and applications that process them or you can also choose to get alerted through the Notification service. Events are available for different DevOps resources including Project, Artifacts, Code Repository, Connections, Build Pipelines, Runs and Stages, Trigger Events, Deployment Events, Environments. Some sample use cases for devops events could be:
- Get alerted when a DevOps project, code repository, environment is created, updated or deleted. These events are especially useful to monitor updates and deletion of the resources. As an example, “Schedule Cascade Delete Project Begin” is an important activity as this would delete all resources within a project so getting a notification if a cascade deletion is scheduled will give you 72 hours window to decide if you want to go forward with this deletion or not.
- Get alerted when new artifacts are added to the Artifact Registry after a build or delpoyment pipeline are succesfully executed.
- Events service can also trigger a Function when a certain event occurs. This capability helps in building out any automation use cases to trigger workflows related to CI/CD pipelines. Some examples could be to do artifiact management where you upload artifacts or files to a object storage when a certain CI/CD related event is captured.
In order to create these event rules navigate to Observability & Management-> Events Service -> Rules and Create Rule. Provide and appropriate name and description. In the Rule Conditions, set the Condition Type to Event Type and from the Service Name list you can select, DevOps Code Repository, DevOps Project, DevOps Build, DevOps Deploy and then select corresponding events. The image below shows some of the sample events.


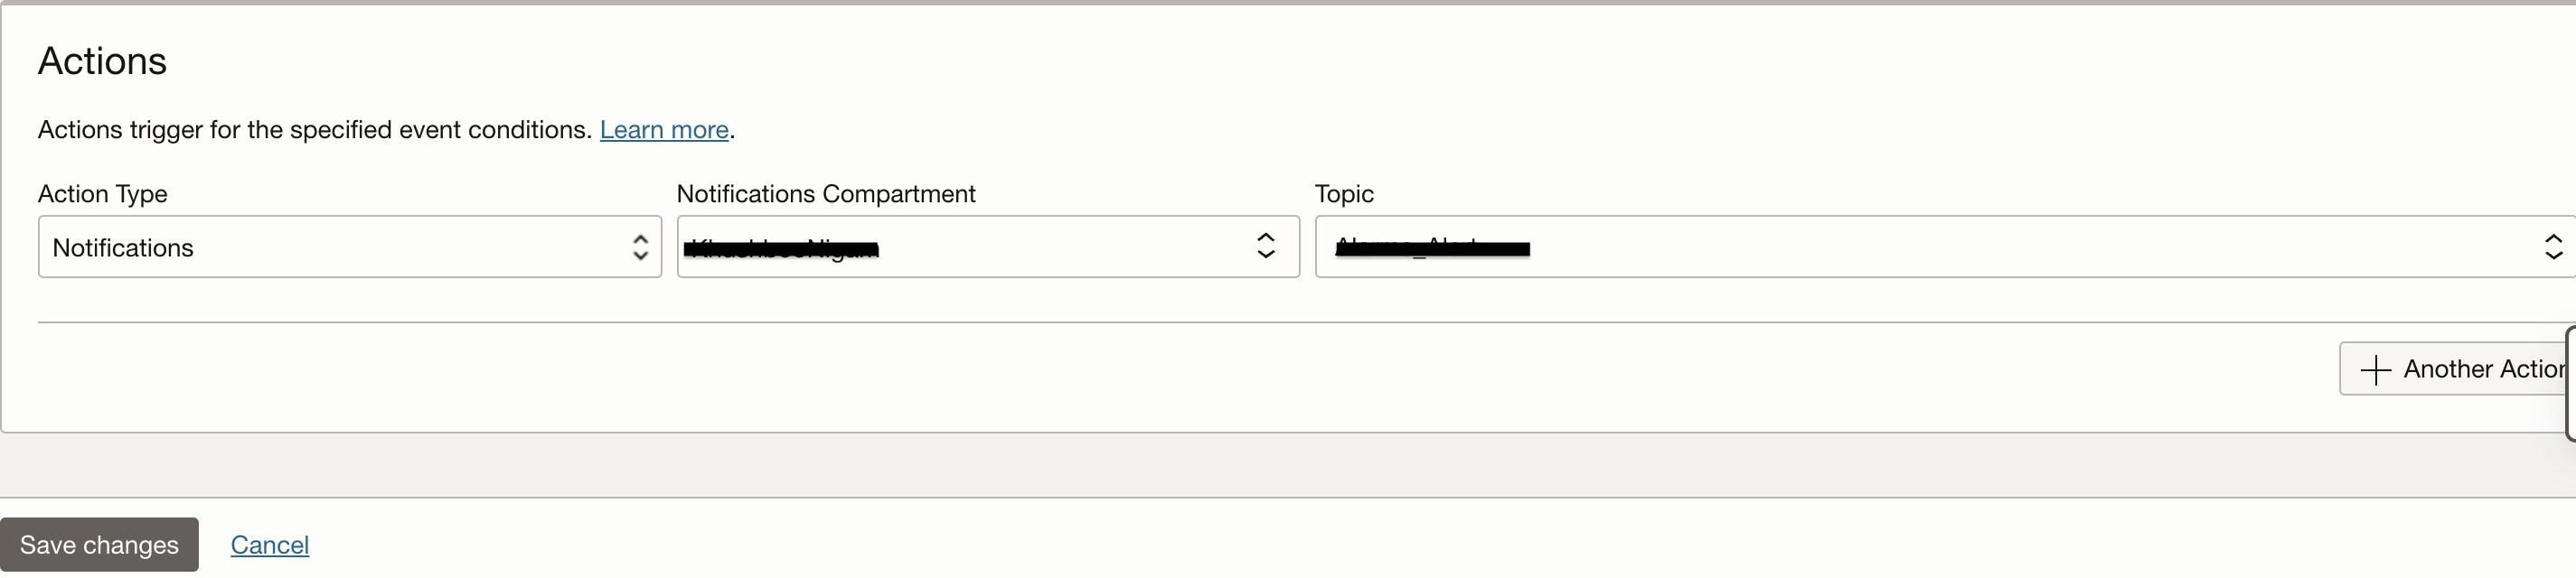
In the Actions section, you can select to send alerts to a Notification Topic or choose to trigger an automation by selecting an OCI Function that you have already deployed.
Conclusion
Oracle Cloud Infrastructure (OCI) offers a comprehensive suite of Observability and Management platform services that empower DevOps engineers to efficiently monitor and manage their workflows. By leveraging OCI Monitoring, Events, Logging, and Logging Analytics, we can gain deep insights into the performance and health of our DevOps services. This enables us to proactively identify and address any issues, ensuring optimal performance and availability of our pipelines. With OCI’s robust observability and management capabilities, we can deliver high-quality applications and services efficiently, meeting the demands of today’s fast-paced digital world.
References
- DevOps Events: https://docs.oracle.com/en-us/iaas/Content/devops/using/devops_events.htm
- DevOps Service Logs: https://docs.oracle.com/en-us/iaas/Content/Logging/Reference/details_for_devops.htm
- DevOps Metrics: https://docs.oracle.com/en-us/iaas/Content/devops/using/devops_metrics.htm
- Ingest Logs from OCI Services Using Service Connector into Logging Analytics: https://docs.oracle.com/en-us/iaas/logging-analytics/doc/ingest-logs-other-oci-services-using-service-connector.html
- Search in Log Explorer: https://docs.oracle.com/en-us/iaas/logging-analytics/doc/search-ui.html
- Create Dashboards: https://docs.oracle.com/en-us/iaas/logging-analytics/doc/create-dashboards.html