Executive Summary
ODA (Oracle Digital Assistant) is being integrated into many functional areas of Oracle Fusion Applications (FA). End-user conversations via ODA in different functional areas of Fusion Apps is gaining popularity to achieve many common tasks. An ODA conversation session typically consists of many round trips of request-response pairs which internally traverses through multiple layers of the ODA architecture topology. This blog attempts to provide an insight into the timing analysis of such a round-trip request-response dialog starting from the moment an end-user enters a request till the response is received within the chat session window. The process of the analysis described in this blog can also be used later to carry out a root-cause analysis for any performance bottlenecks in an ODA conversation.
Solution Architecture
The timing analysis is best explained with the help of the ODA product component architecture diagram (Fig. 1). We will analyze the timings in the 3 areas marked in the figure, namely,
- Intelligent Routing Engine in Digital Assistant
- Conversation Flow implemented in Skill
- Backend Integration Services provided by Custom Component
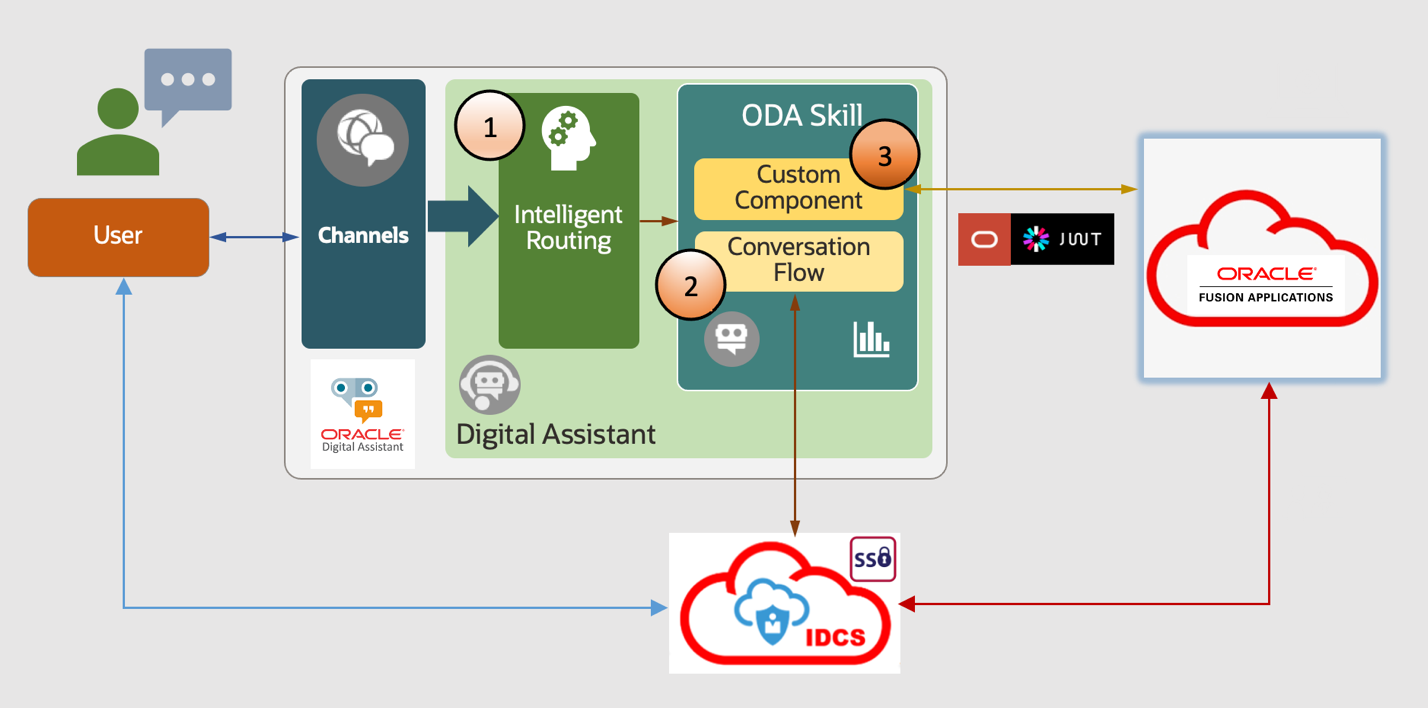
Fig. 1. ODA Component Architecture
Setup
A few prerequisite steps should be completed to get a complete picture of the round-trip timing analysis. These steps are completed in different product component consoles, as described in the following subsections.
Enabling Insights in ODA
The conversation statistics is available in Insights tab within the ODA console. However, Insights may be disabled by default as shown in Fig. 2. Click the link on the screen to enable it. Insights will be enabled and will show a dashboard with overview and other details of conversations.
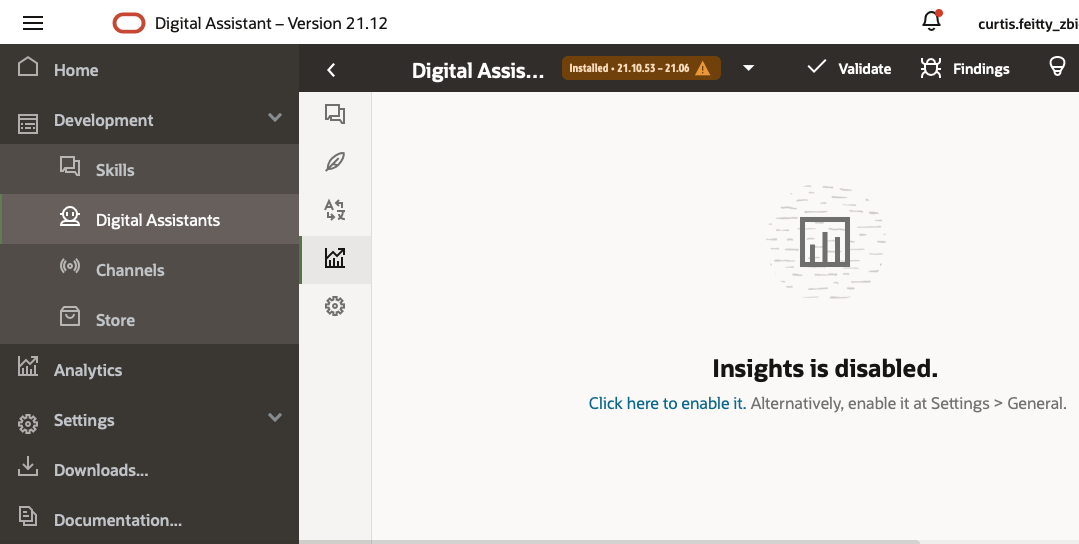
Fig. 2. Enabling Insights in ODA console
Enabling Timestamps for conversations in FA
By default, the timestamps for each request or response are not displayed within an ODA conversation session in Fusion Apps. However, this feature can be turned on by using Design Experience Studio and checking the box for displaying time stamps under Digital Assistant Configuration section (Fig. 3).
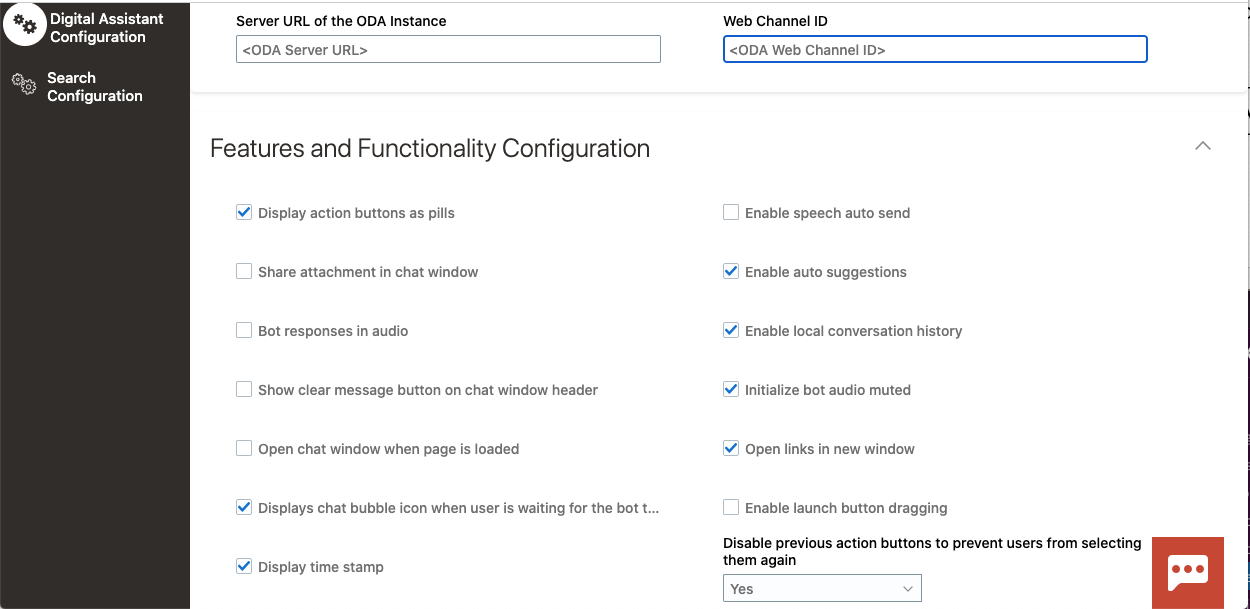
Fig. 3. Enabling display of time stamps in Design Experience Studio (FA)
Running a Test Conversation
After the setup is completed, we can run a sample conversation in the chat window of FA console. For our testing purposes, we have requested a query about vacation balance after a certain specified start date. Fig. 4 shows the results returned in the ODA conversation along with the timestamps for the initial query about vacation balance and the final response.
We can see here that the request was sent at 2.54.04 PM and the results were returned at 2.54.09 PM. So, it took 5 seconds (approx) to get the response back. We will now go behind the scenes and analyze the round-trip to get a breakdown of the 5 seconds that were taken to complete the round-trip.
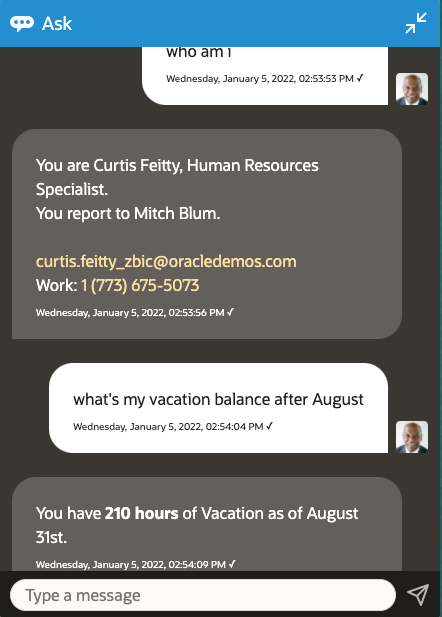
Fig. 4. Sample ODA conversation with timestamps
Round-Trip Timing Analysis
As shown in Fig. 1 for ODA solution architecture, the message traverses through 3 layers listed below.
- Intelligent Routing Engine residing in the Digital Assistant
- Conversation Flow implemented in the Skill
- Backend Integration Services provided by the Custom Component
To get the details of the breakdown for these layers, we need to download a few files that capture the time stamps for this request-response pair.
Export Insights Data
From ODA console, navigate to Export tab in Insights sidebar menu and export the analytics data specifying an appropriate date range which includes the conversation that needs to be analyzed. Fig. 5 shows the window that pops up to complete this export process.
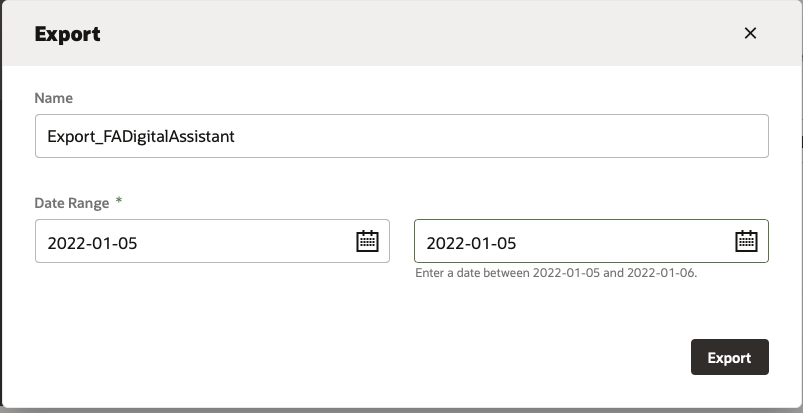
Fig. 5. Export Insights data
The export process creates a zip file and is downloaded into the local machine. It contains a csv file which we will look at for our timing analysis.
Download Custom Component Logs
The custom component logs are associated with the skill that processed the request and invoked the REST API call to FA for retrieval of relevant data. The skill can be identified by prior knowledge based on the utterance provided as input in the conversation window or it can also be determined by looking at the contents of the CSV file downloaded from Insights section in the previous step.
Let’s assume that we know the skill involved, so that we can navigate to its Custom Component section inside ODA console and download the diagnostics logs as shown in Fig. 6. For our sample test dialog about vacation balance, we download the diagnostic logs from the HCM skill.
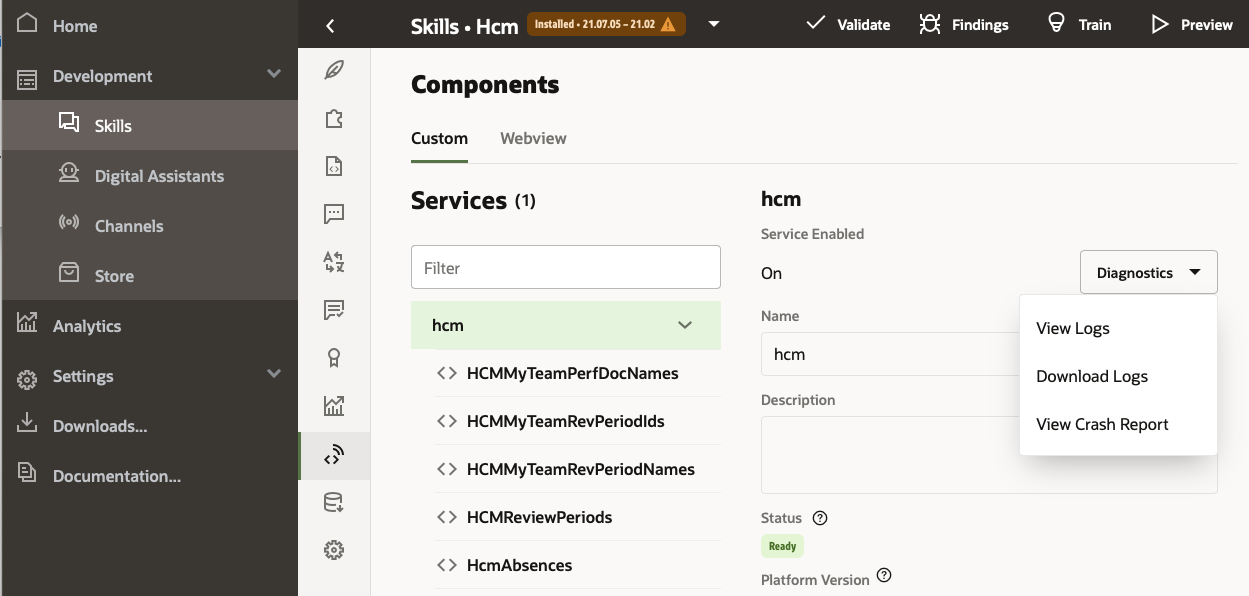
Fig. 6. Download Custom Component Diagnostic Logs
The download operation generates a text file containing all the debug information for the custom component operations. There is no option at present to limit the amount of log information downloaded for a specific date range but based on the timestamp information from the Insights data, it’s quite easy to zoom in to the relevant portion of the diagnostic logs of the custom component.
Insights Data Analysis
It must be noted that the timestamps displayed in the ODA chat session corresponds to the local time zone of user set in the FA console. However, the Insights data and the diagnostic logs display the timestamp in UTC. So, the conversion to UTC must be kept in mind when correlating the entries.
In our example, the chat session in Fig. 4 shows timestamps around 2:54 PM (local timezone set in FA console). This will correspond to 8:54 PM (UTC) in Insights data and 20:54 (UTC) in diagnostic logs.
After we import the CSV file from Insights into Excel, we will see lots of tracing information. We can ignore most of it for our timing analysis and only extract the following columns in a separate spreadsheet tab for our analysis.
- BOT_NAME – provides name of Digital Assistant or Skill
- TIMESTAMP – self-explanatory (UTC)
- CURR_STATE – current state during the timestamp in the conversation flow
- COMPONENT_NAME – Type of operation in current state. It will specify the custom component service name, if invoked
Sample entries from our conversation are shown below in Table 1.
| BOT_NAME |
TIMESTAMP |
CURR_STATE |
COMPONENT_NAME |
| FADigitalAssistant |
05-JAN-22 08.54.05.179000 PM |
System.Intent |
System.Intent |
| FADigitalAssistant |
05-JAN-22 08.54.05.180000 PM |
System.MsgSent |
ODA.Routing |
| Hcm |
05-JAN-22 08.54.05.182000 PM |
System.MsgReceived |
|
Table 1. Timing Data for Intent Resolution in Digital Assistant
We observe here that the Intent Resolution Engine within FADigitalAssistant was able to analyze the utterance provided by user and route the message to HCM skill in 0.003 seconds or 3 milliseconds (08.54.05.180000 PM – 08.54.05.179000 PM).
Next, we can trace down the rows in our spreadsheet extract to track the progress of the conversation within HCM skill through various states. At some point, we will see it invokes a custom component to retrieve the vacation balance data from the backend application, which is FA in this case. This is shown in Table 2 below.
| BOT_NAME |
TIMESTAMP |
CURR_STATE |
COMPONENT_NAME |
| Hcm |
05-JAN-22 08.54.05.370000 PM |
resolveAbsenceBalance |
System.ResolveEntities |
| Hcm |
05-JAN-22 08.54.05.373000 PM |
setBundleMsgsForAbsence |
System.SetVariable |
| Hcm |
05-JAN-22 08.54.09.560000 PM |
getAbsenceBalance |
HcmAbsences |
Table 2. Timing Data for Invoking Custom Component
There are a couple of observations that are worth pointing out from the data in Tables 1 and 2.
Firstly, the HCM skill received the message at 08.54.05.182000 PM (Table 1) and invoked the custom component to retrieve the absence balance at 08.54.05.373000 PM (Table 2). So, the message passed through various states defined in the HCM skill’s conversation flow in approximately 0.191 seconds or 191 milliseconds (08.54.05.373000 PM – 08.54.05.182000 PM) and then the custom component was triggered to retrieve absence balance data.
Secondly, the custom component service HcmAbsences took 4.187 seconds (08.54.09.560000 PM – 08.54.05.373000 PM) to complete the request within getAbsenceBalance state of the conversation. We can now drill down to the custom component diagnostic logs to see the breakdown of this processing time within this custom component, HcmAbsences.
The diagnostic log from the HCM skill has several log entries but for our analysis, we can zoom in to the timestamp interval shown in Table 2. Excerpts from the diagnostic log are shown in Table 3 below.
| TIMESTAMP |
MSG_TYPE |
MESSAGE_TEXT |
| [2022-01-05T20:54:05.386Z] |
[info] |
HcmAbsences: inside invoke |
| [2022-01-05T20:54:05.386Z] |
[info] |
absenceType ::Vacation |
| … |
… |
… |
| [2022-01-05T20:54:05.387Z] |
[info] |
HcmUtil: produceMessage: returning responseMEssage=minute |
| [2022-01-05T20:54:05.387Z] |
[info] |
https://FAHost:443/hcmRestApi/resources/latest/planBalances?onlyData=true&finder=findByPersonIdPlanIdLevelDate;personId=myPersonID,level=all,balanceAsOfDate=2021-08-31 |
| [2022-01-05T20:54:09.550Z] |
[info] |
HcmUtil: produceMessage: message is: {0} of {1} |
| … |
… |
… |
| [2022-01-05T20:54:09.551Z] |
[info] |
HcmUtil: produceMessage: returning responseMEssage=<b>210 hours</b> of Vacation |
| [2022-01-05T20:54:09.551Z] |
[debug] |
creating messageModel with payload |
| [2022-01-05T20:54:09.551Z] |
[debug] |
valid messageModel |
Table 3. Timing Data from Custom Component Logs
From the diagnostic log data, we find that HcmAbsences custom component invoked a REST API request at timestamp 20:54:05.387Z and the response was received at 20:54:09.550Z. So, the REST API took approximately 4.163 seconds to process (20:54:09.550Z – 20:54:05.387Z).
Indeed, if we extract the REST API call from the diagnostic logs and invoke it independently from a command line, we see similar response times, as shown below in Fig. 7. This re-affirms our analysis of the elapsed times for the REST API call within the custom component.
Shell Prompt> time curl --location --request GET 'https://FAHost/hcmRestApi/resources/latest/planBalances?onlyData=true&finder=findByPersonIdPlanIdLevelDate;personId=myPersonID,level=all,balanceAsOfDate=2021-08-31' --header  'AuthDetails'
…
curl --location --request GET  --header
0.03s user 0.01s system 0% cpu 4.005 total
Shell Prompt>
Fig. 7 REST API Timing confirmation from command line
Summary
To summarize, Table 4 now lists the breakdown of the total round-trip time of the conversation, as seen by the user in the chat session.
| Number |
ODA Component |
Elapsed Time |
| 1 |
Intent Resolution |
0.003 seconds |
| 2 |
Conversation Flow |
0.191 seconds |
| 3 |
Custom Component |
4.187 seconds |
| 4 |
REST API call within Custom Component |
4.163 seconds |
Table 4. Summary of Timing Analysis
Fig. 8 describes in a diagram the time is spent in the 3 tiers of the ODA component architecture, namely,
- Intent Resolution Engine (Digital Assistant)
- Conversation Flow (Skill)
- Backend Integration Services (Custom Component)
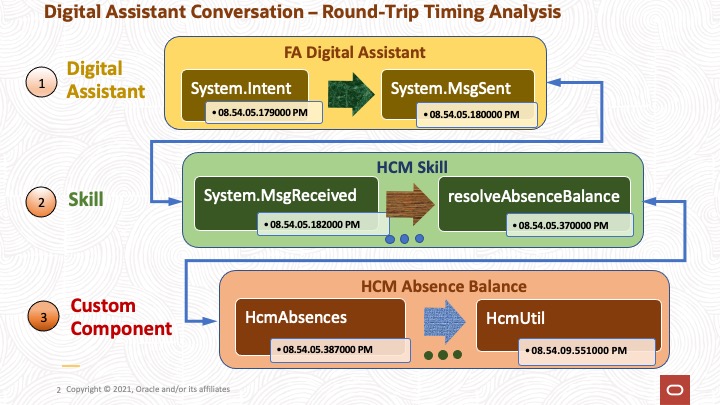
Fig. 8 Timing Analysis summary in 3 areas
We have picked a simple conversation here to demonstrate the timing related information that is present within various artifacts of the ODA tool set. The analysis is necessary to understand the contribution in the total round-trip time of a request-response pair from various layers of the ODA engine. This process can be easily leveraged to identify performance bottlenecks in case of slow responses observed within ODA chat sessions.
For more details on interpretation of the information captured in Insights data or custom component diagnostic logs, please refer to the ODA Product Documentation portal [1].
Acknowledgements
I would like to acknowledge the assistance I received from my teammate, Greg Mally for the compilation of this blog. I would also thank Martin Deh and Rohit Dhamija from the Oracle Digital Assistant team for their help at different times.
References
1. ODA Product Documentation Portal – Product Documentation for Oracle Digital Assistant