Introduction:
For many Oracle Cloud Infrastructure (OCI) users, the Load Balancer plays a vital role in their network architecture. It’s often the first line of defense when it comes to distributing traffic efficiently and ensuring high availability. Because of its importance, keeping a close eye on the Load Balancer’s performance and health is essential.
Relying on manual monitoring, however, can be a tedious and unreliable approach. It’s time-consuming, susceptible to human error, and often leads to delayed responses or missed issues that can impact application performance.
In this blog post, I’ll Walk you through how to leverage OCI’s native Monitoring services to automate the process. You’ll learn how to set up alarms and notifications that track the backend health of your OCI Load Balancer—no manual checks required. This approach not only boosts operational efficiency but also ensures you’re always in the know when something needs your attention.
Network Diagram:
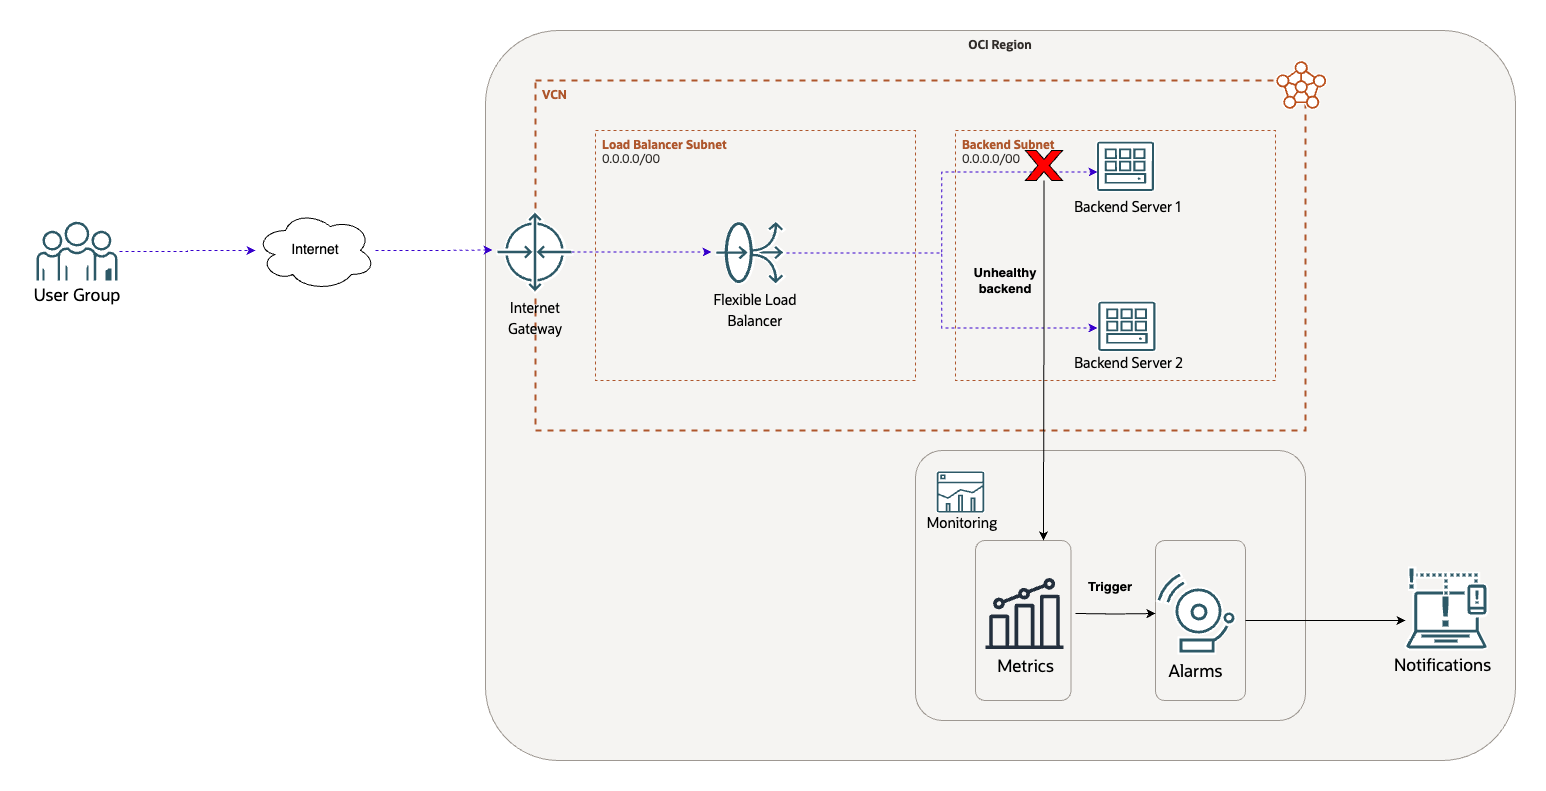
For this blog, I have already provisioned:
- VCN and respective subnets with the appropriate routing and security configuration
- Internet Gateway
- Load balancer and backend server’s configuration
Now let’s see how we can setup monitoring.
Configuration:
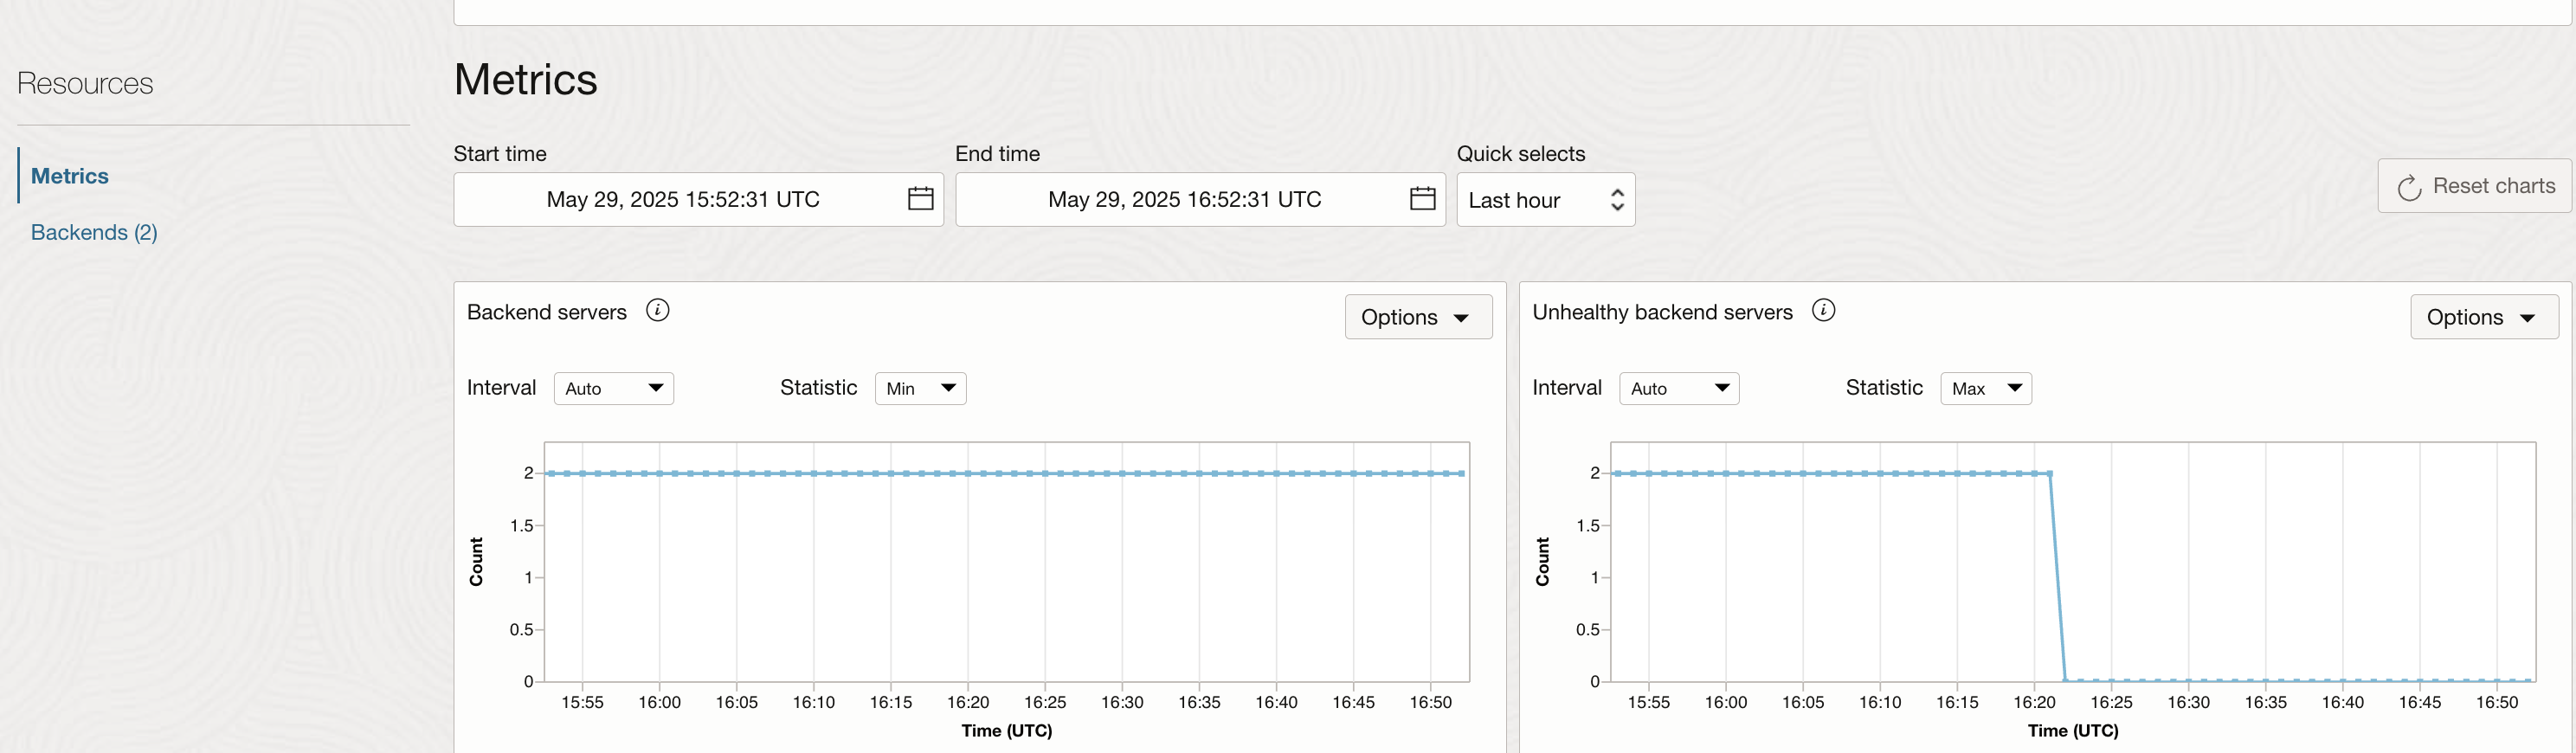
Navigate to the Load Balancer and go to the Backend Set that is created.
Click on Metrics under Resources and locate the graph for ‘Unhealthy backend servers’. You can see that there are no unhealthy backends currently:
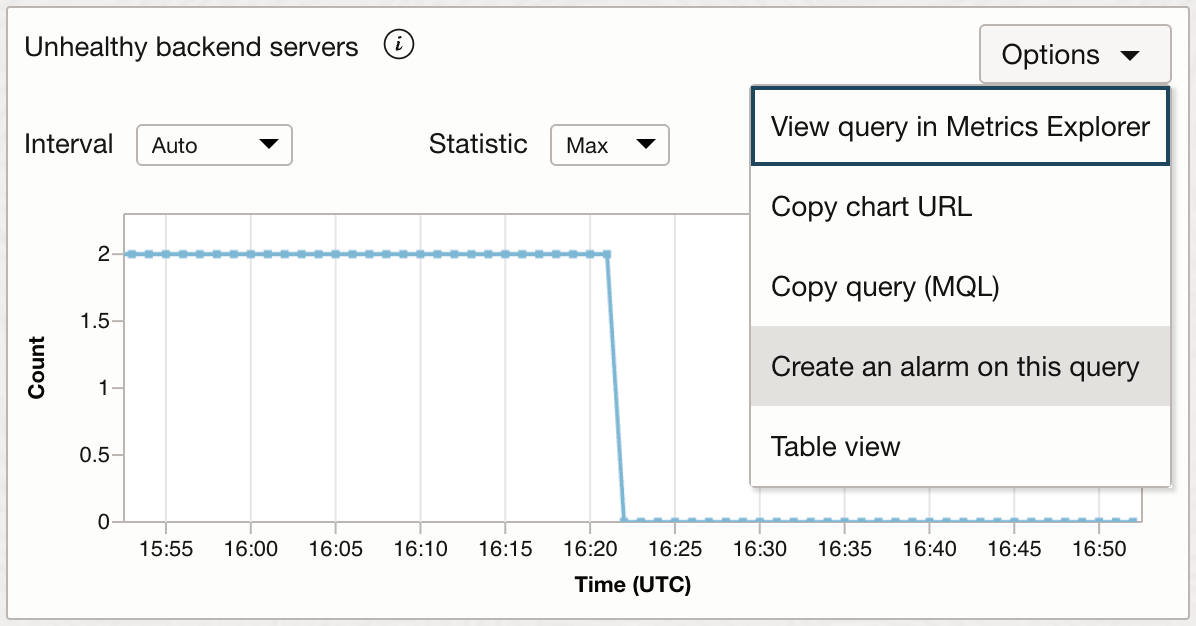
Next, click on ‘Options’ for that graph and click on ‘Create an alarm on this query’:
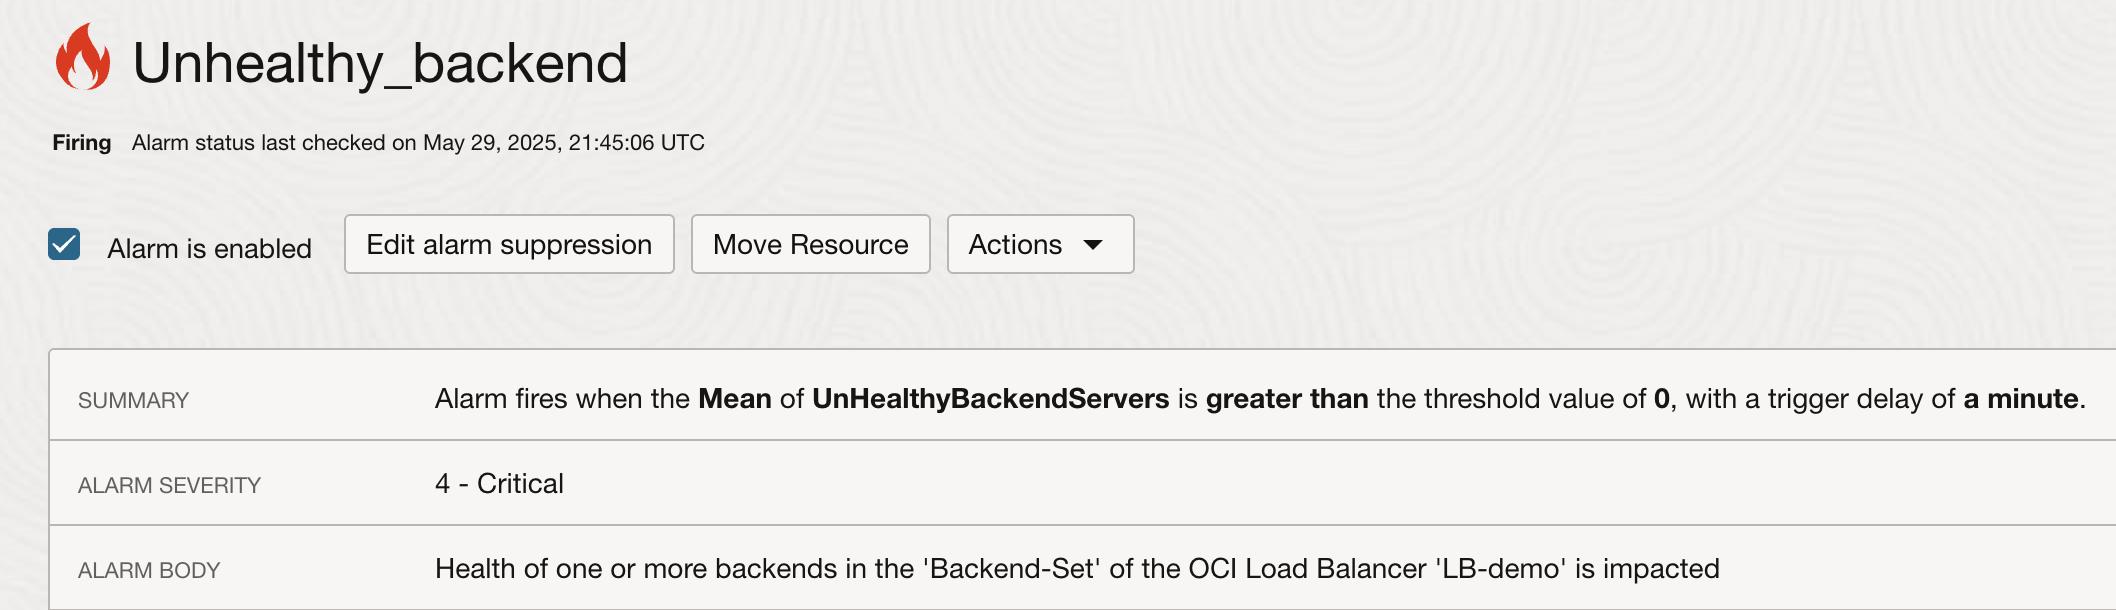
You will be taken to the alarm creation page. Define the metric description as follows. Please note that I have chosen and highlighted ‘Mean’ as statistic. Rest all the fields are filled in automatically and to be kept as they are:
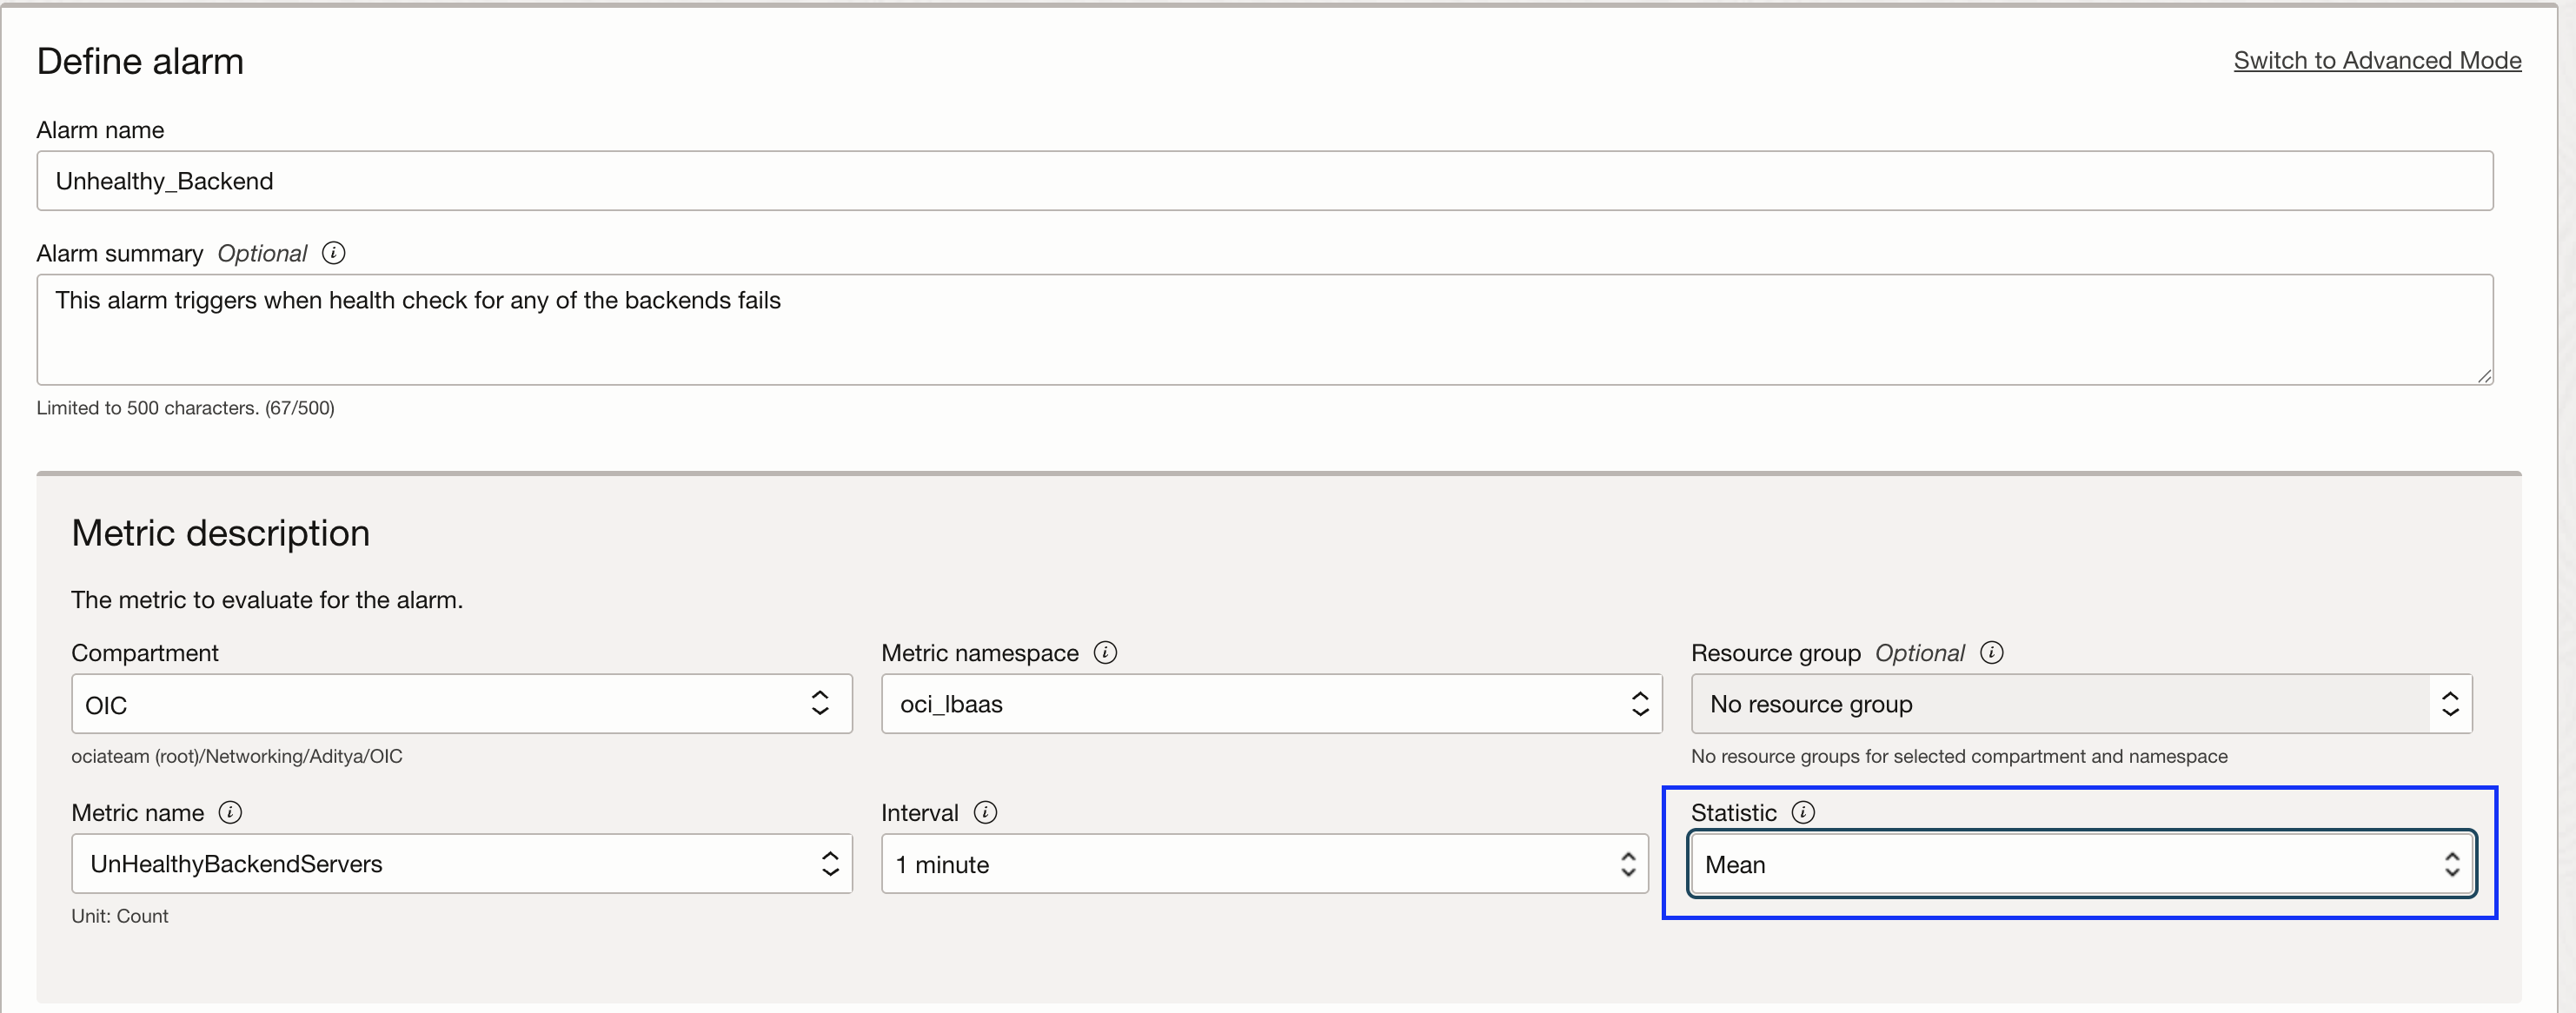
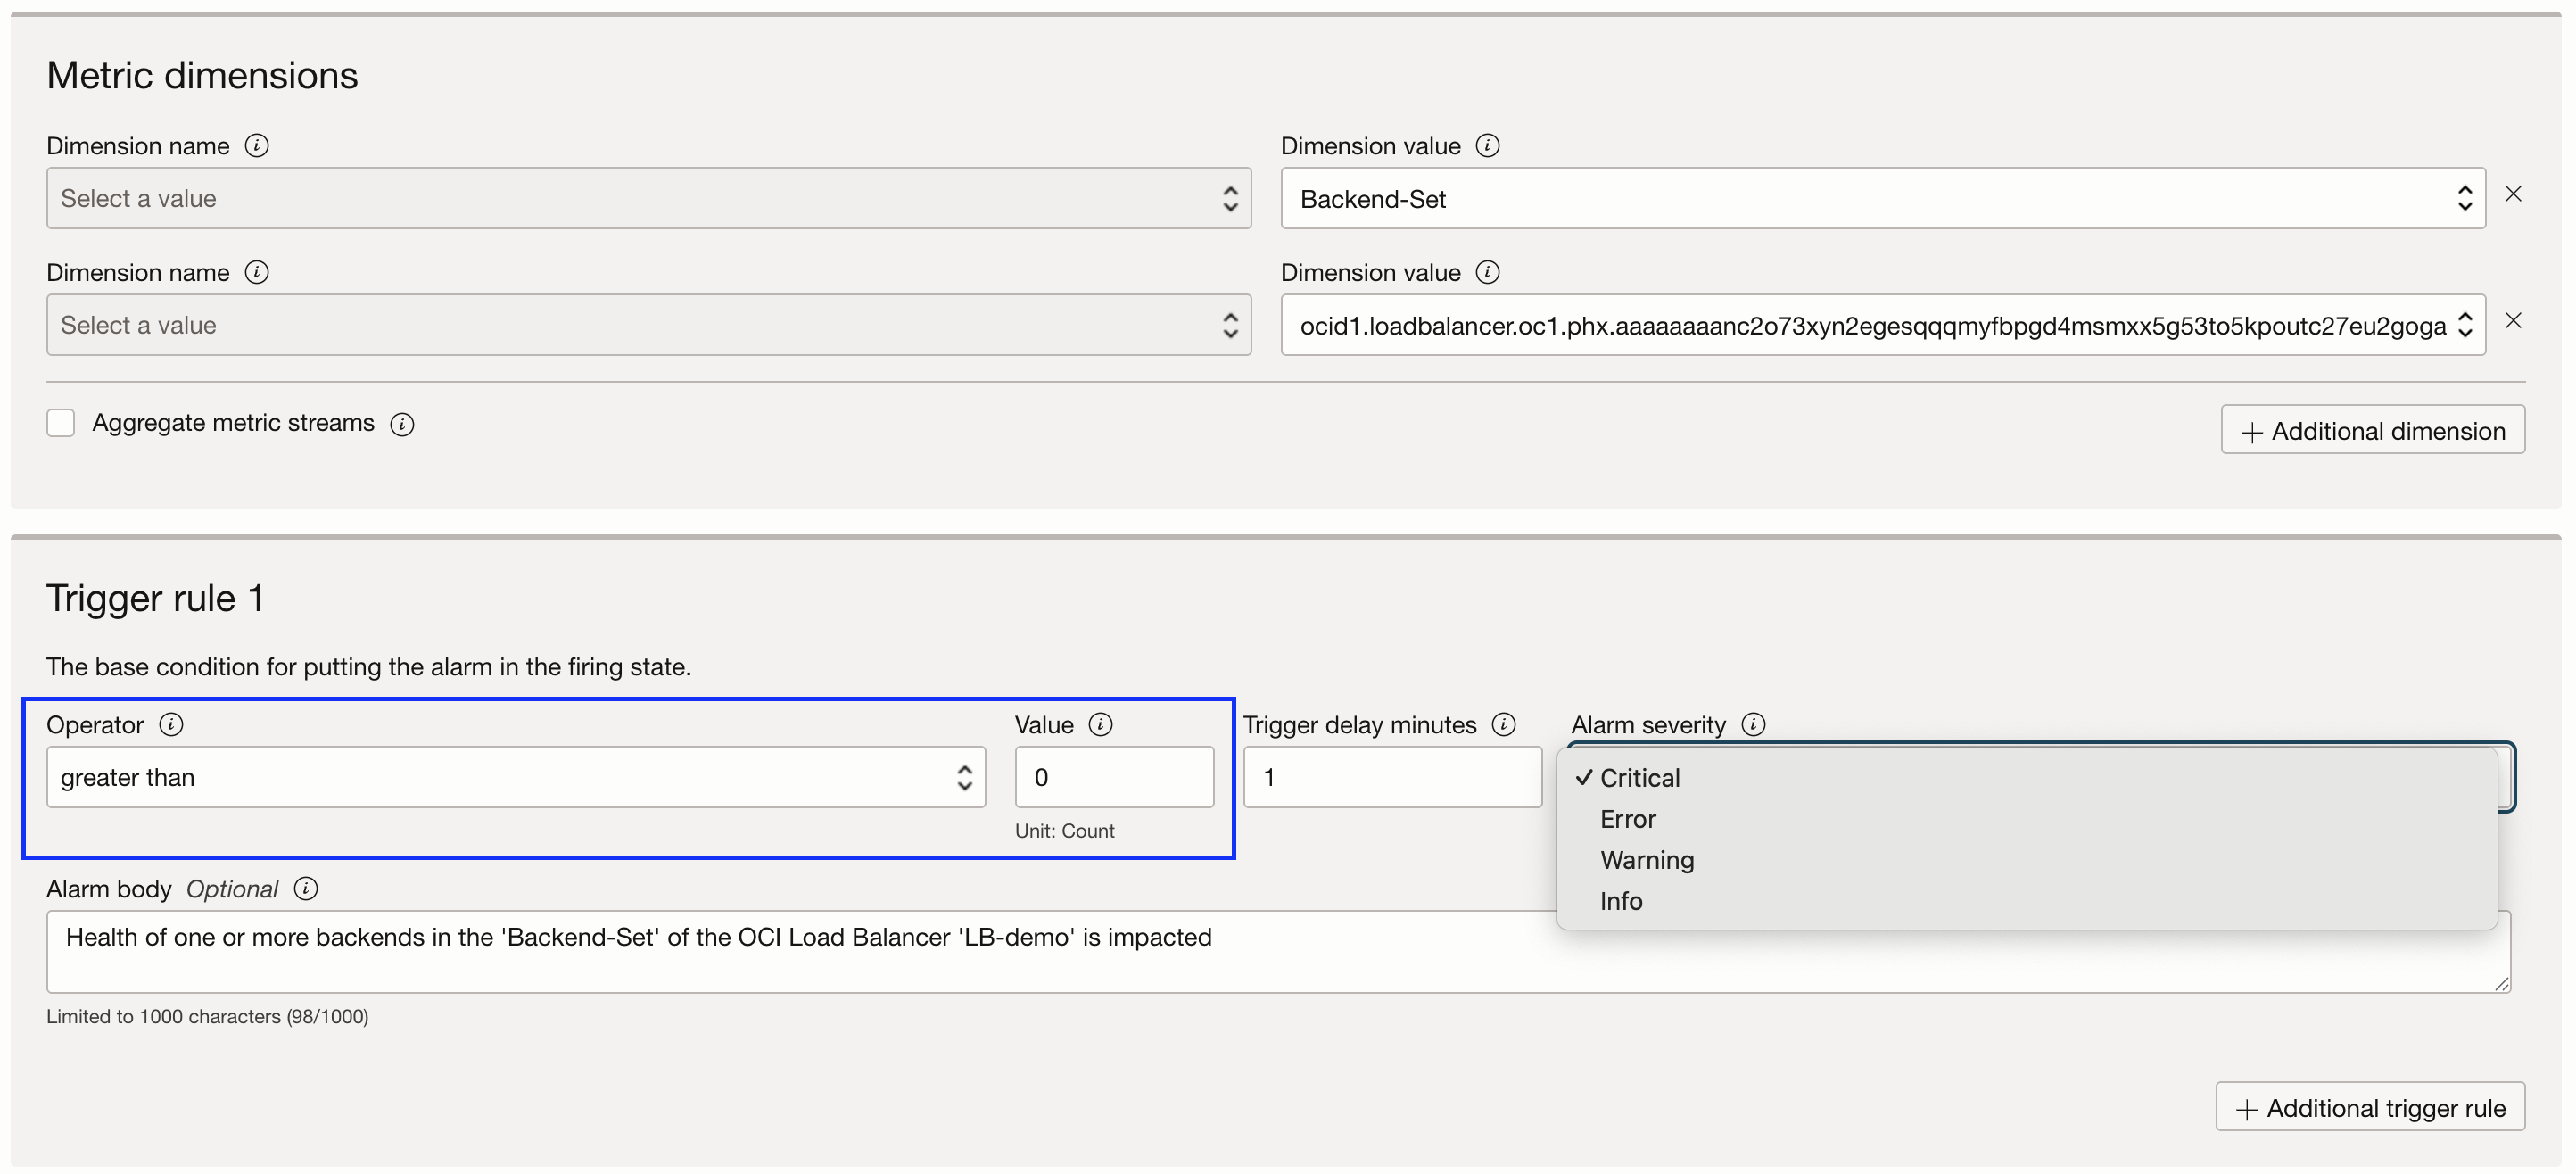
Going further, keep the Metric dimensions unchanged. These are filled automatically as we are directly creating the alarm on from the query.
In the Trigger rule:
- Operator: ‘more than’
- Value: 0
- Alarm Severity: Select as per the requirement
- Alarm body: While optional, it can provide more human-readable insights to the recipients.
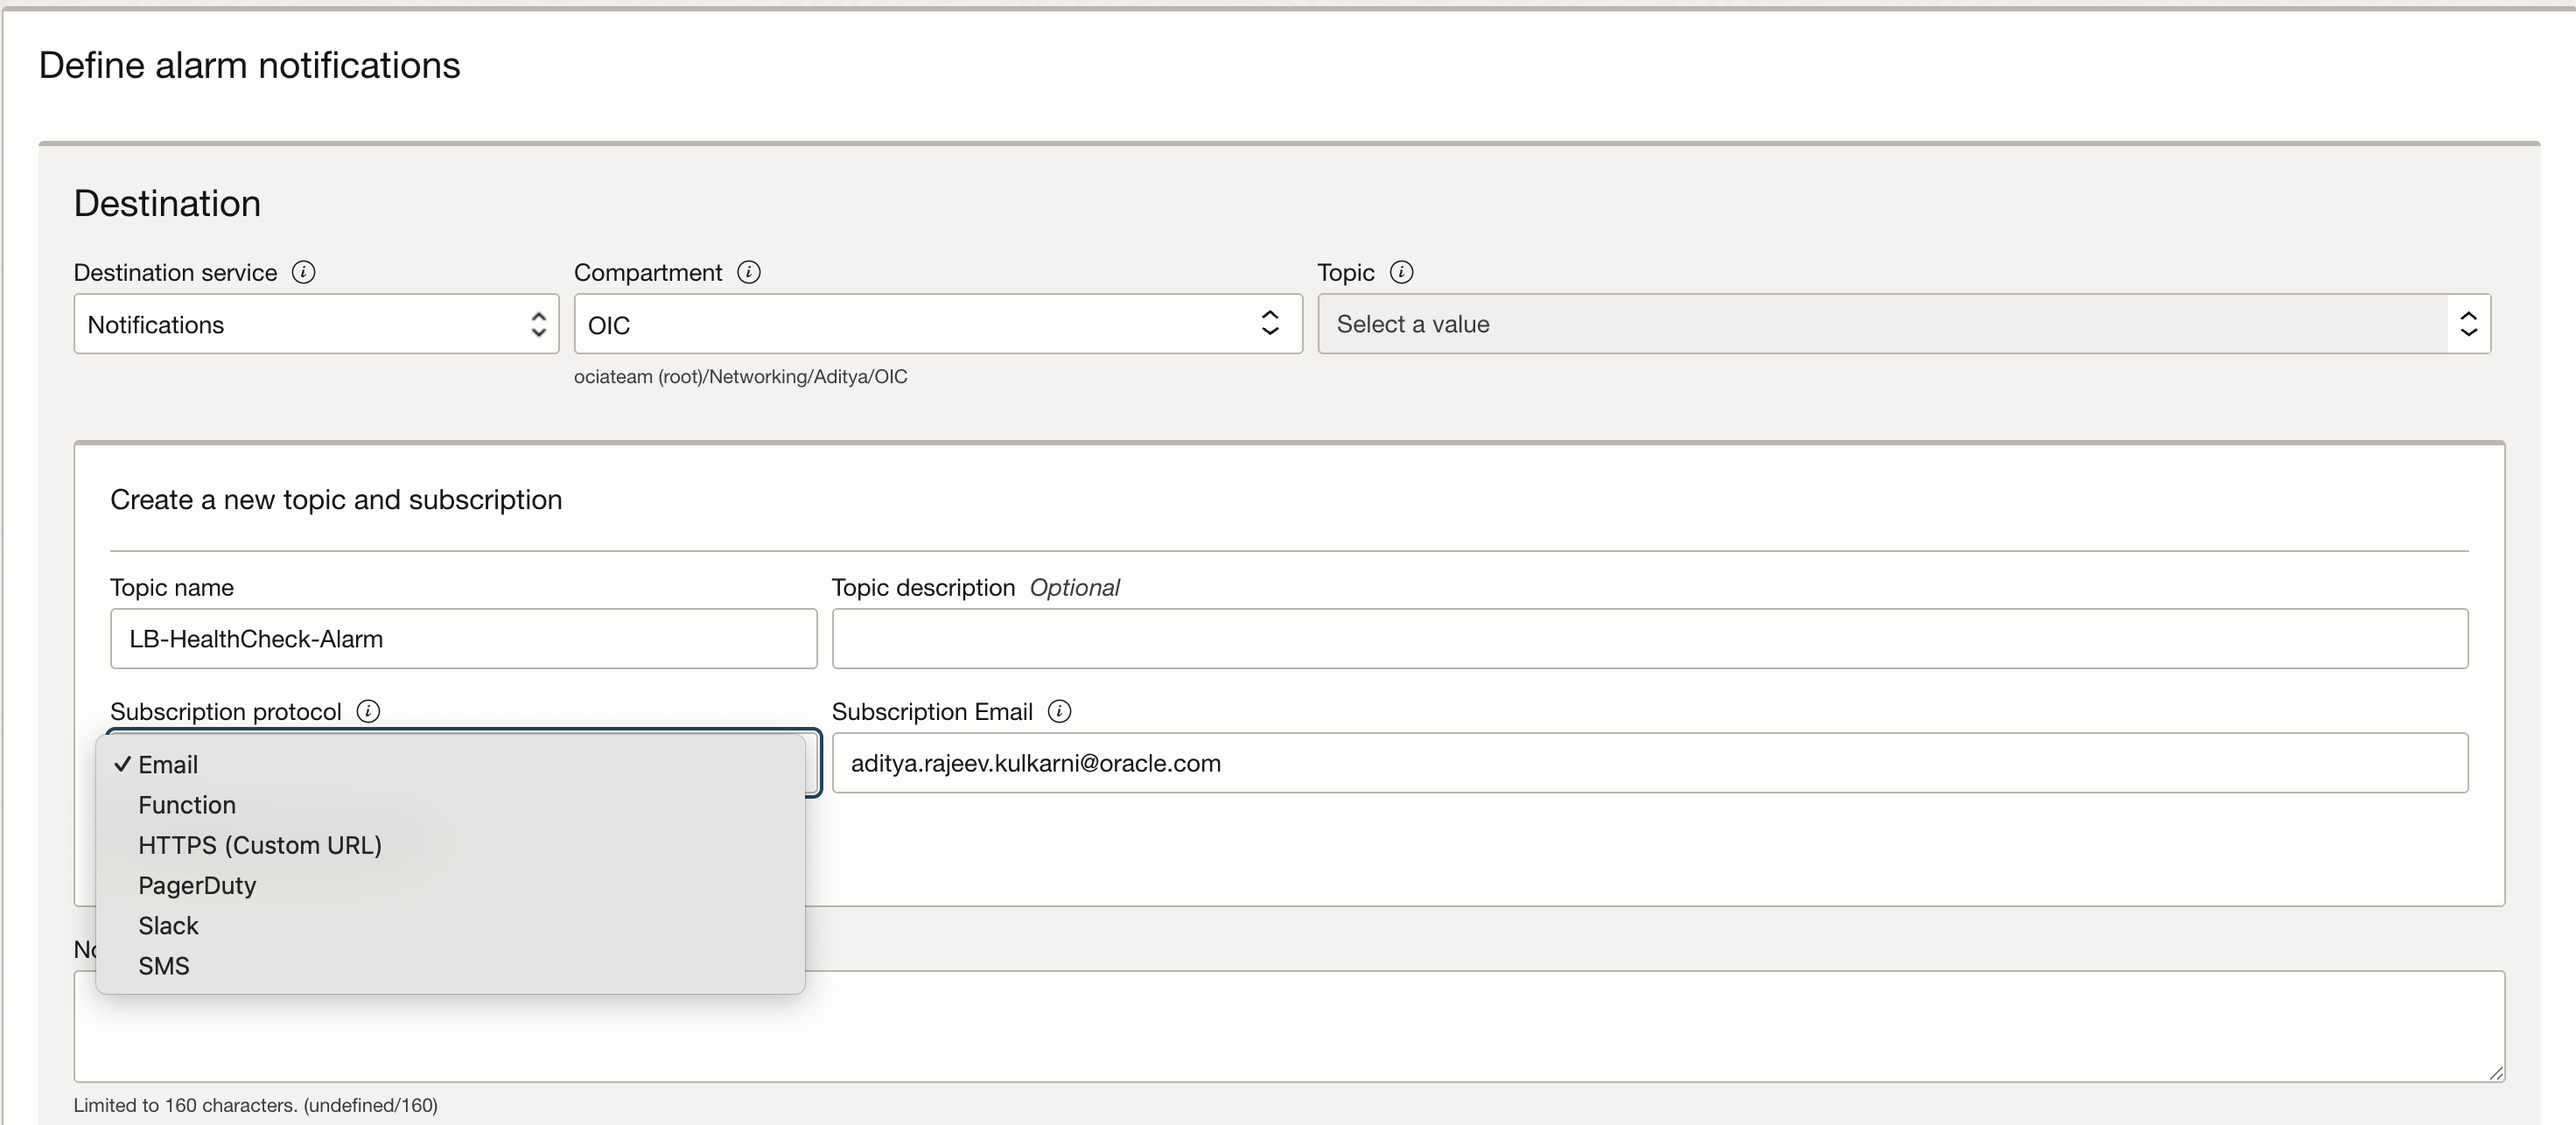
Next, let’s set up the Notifications service, which is essential for getting alerted when something goes wrong. This involves creating a topic and a subscription. The good news is that you can configure both the topic and the subscription directly within the alarm setup window, so there’s no need to jump between different sections of the OCI Console.
For this example, I’ve chosen to use email as the notification method, but OCI supports several other options too, such as Slack, PagerDuty, or custom HTTPS endpoints—so you can choose what best fits your workflow.
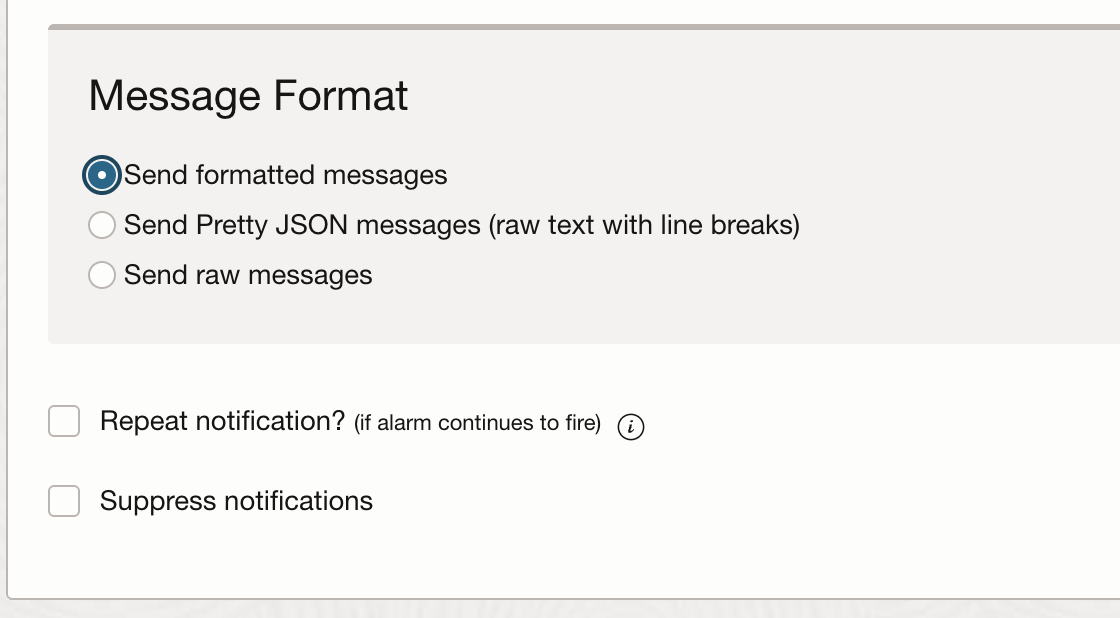
We have some options around the message format and notifications that you can opt for. For example, you can choose to repeat the notifications at regular intervals or suppress them during a certain time window. For this walkthrough, I’m sticking with the default settings:
In summary, we have configured this alarm to send a notification if any of the backends in the given backend set fails the health check.
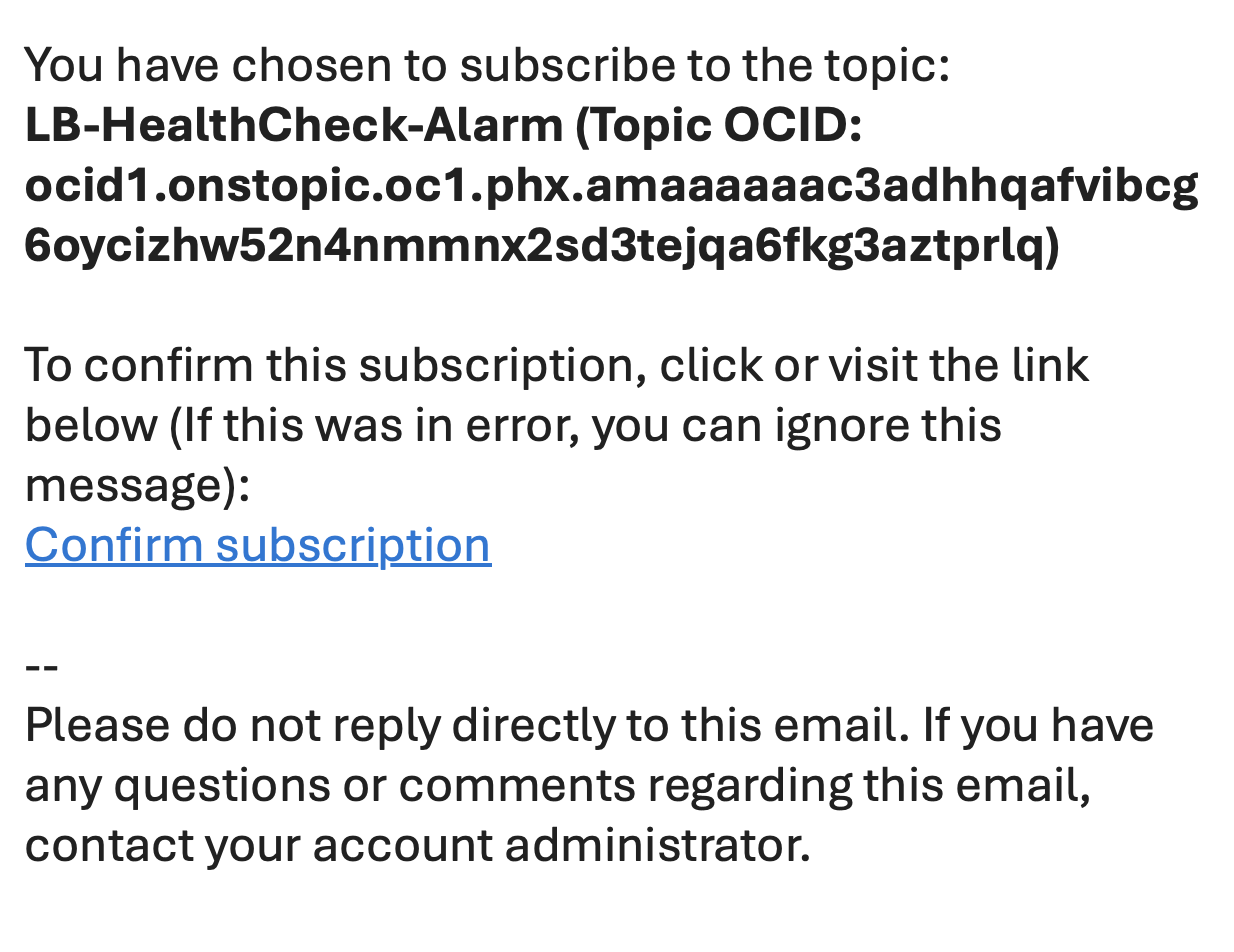
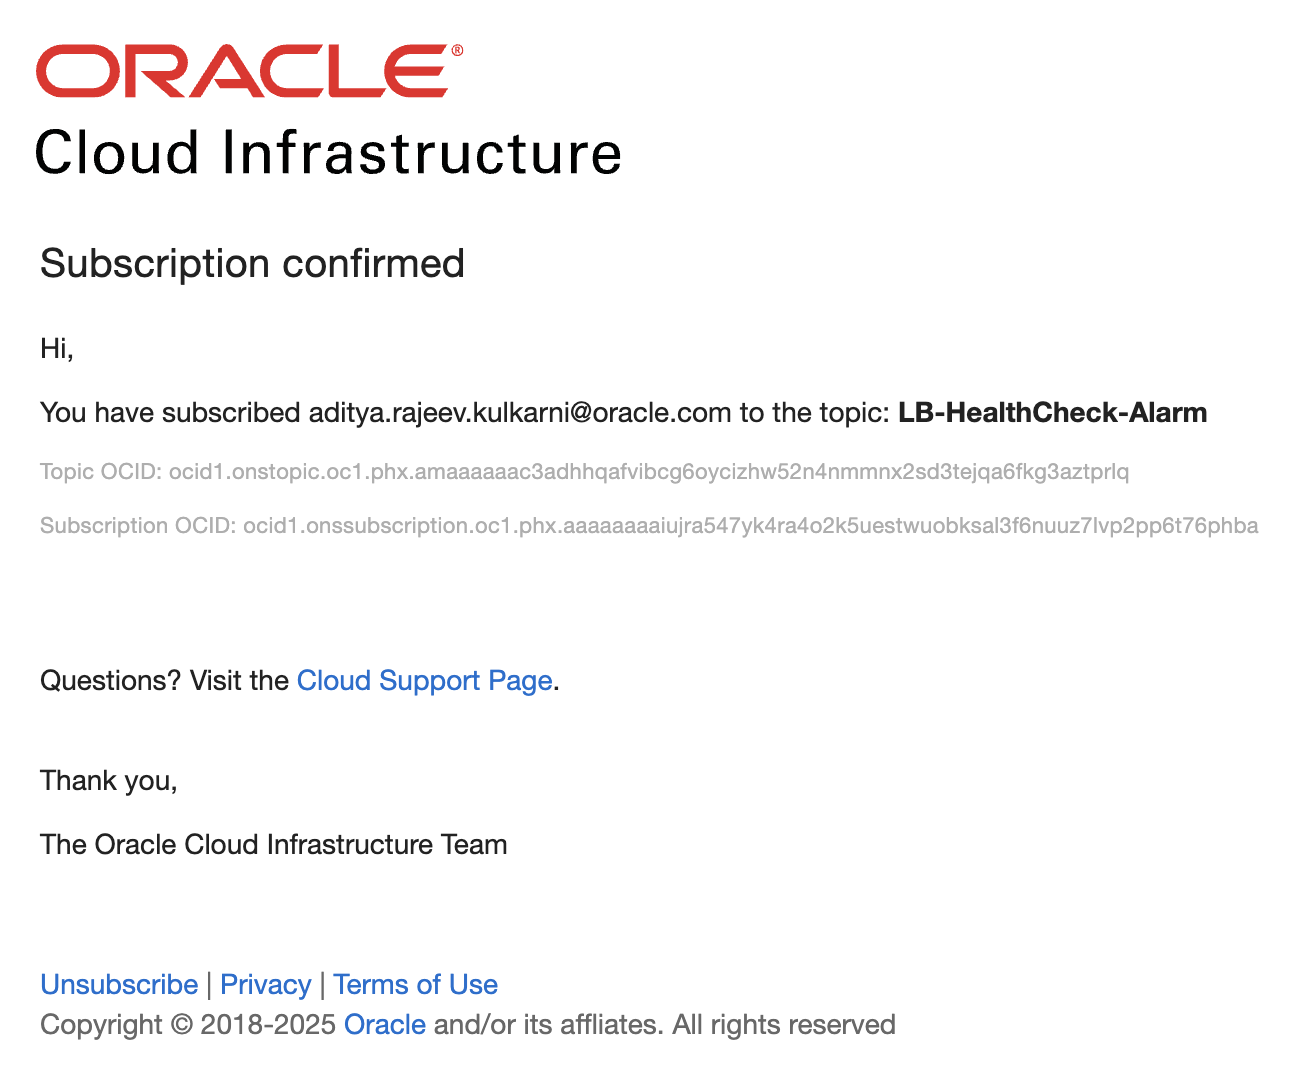
Once the alarm is created, the recipient of the Notifications service will receive an email prompting them to confirm the subscription. It’s important that they complete this step—without confirming, they won’t receive any of the alarm notifications:
Verification:
For testing purpose, l stopped one of the backend servers in the backend set.
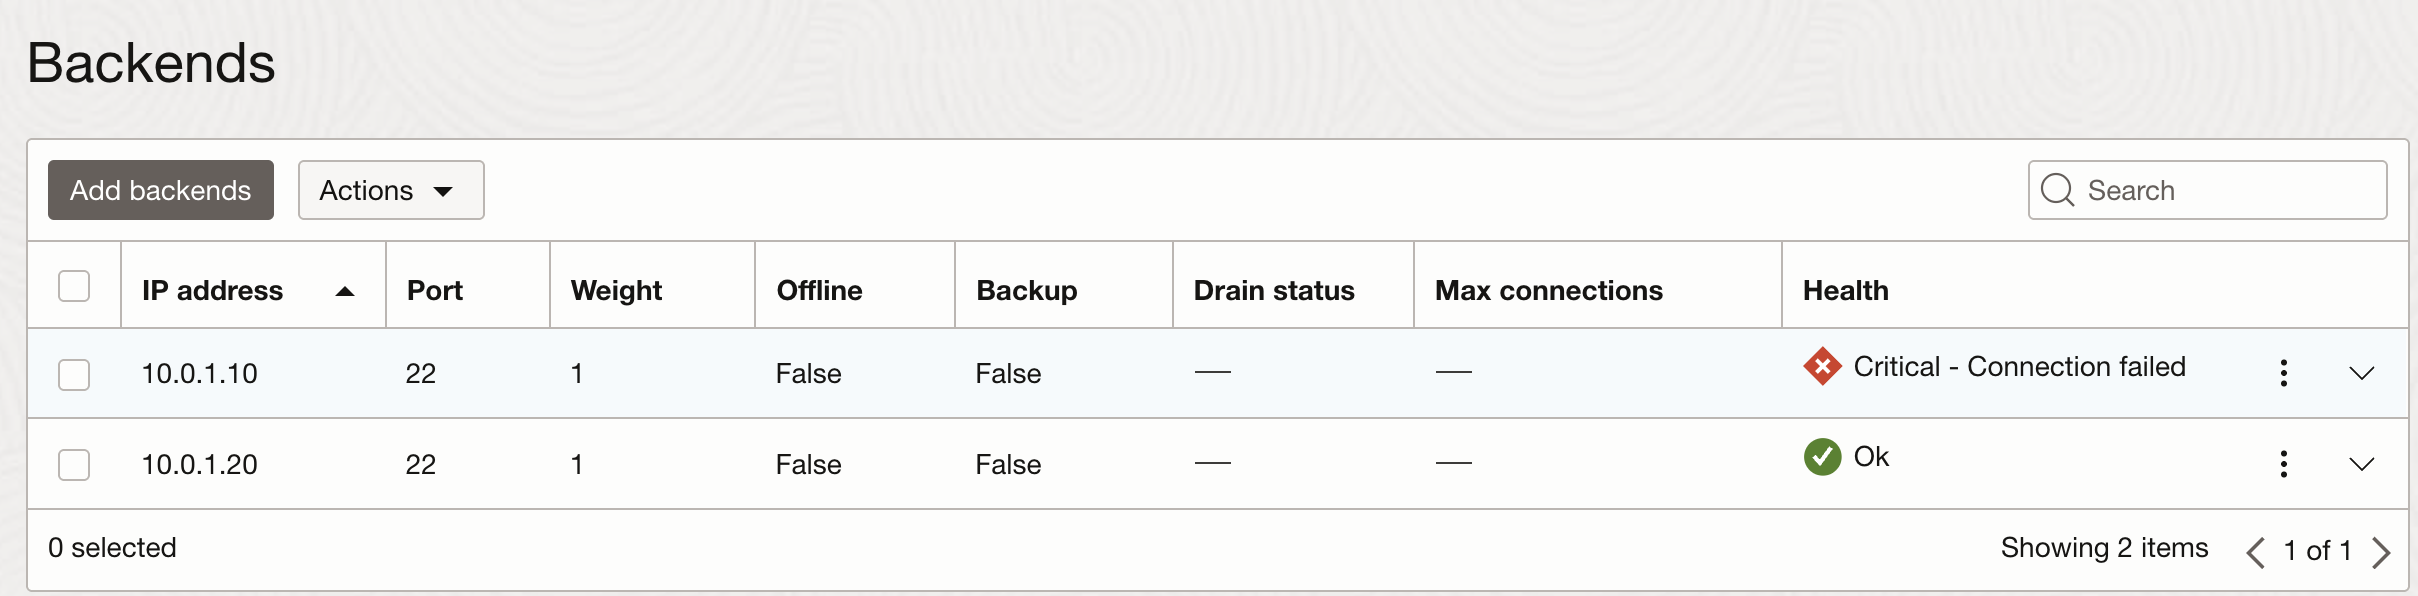
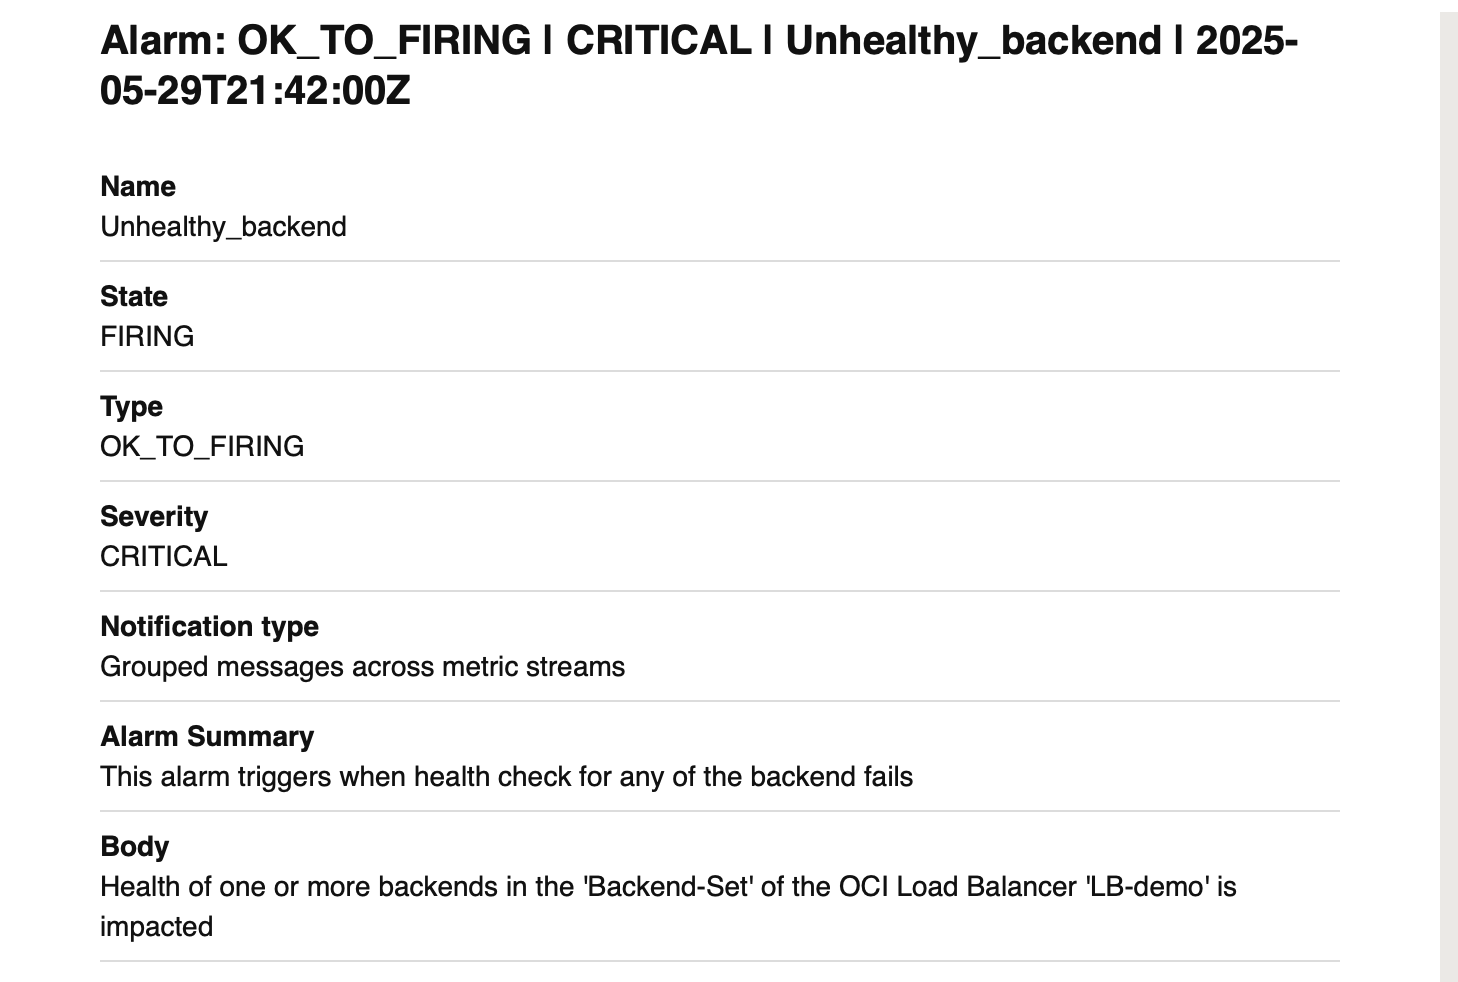
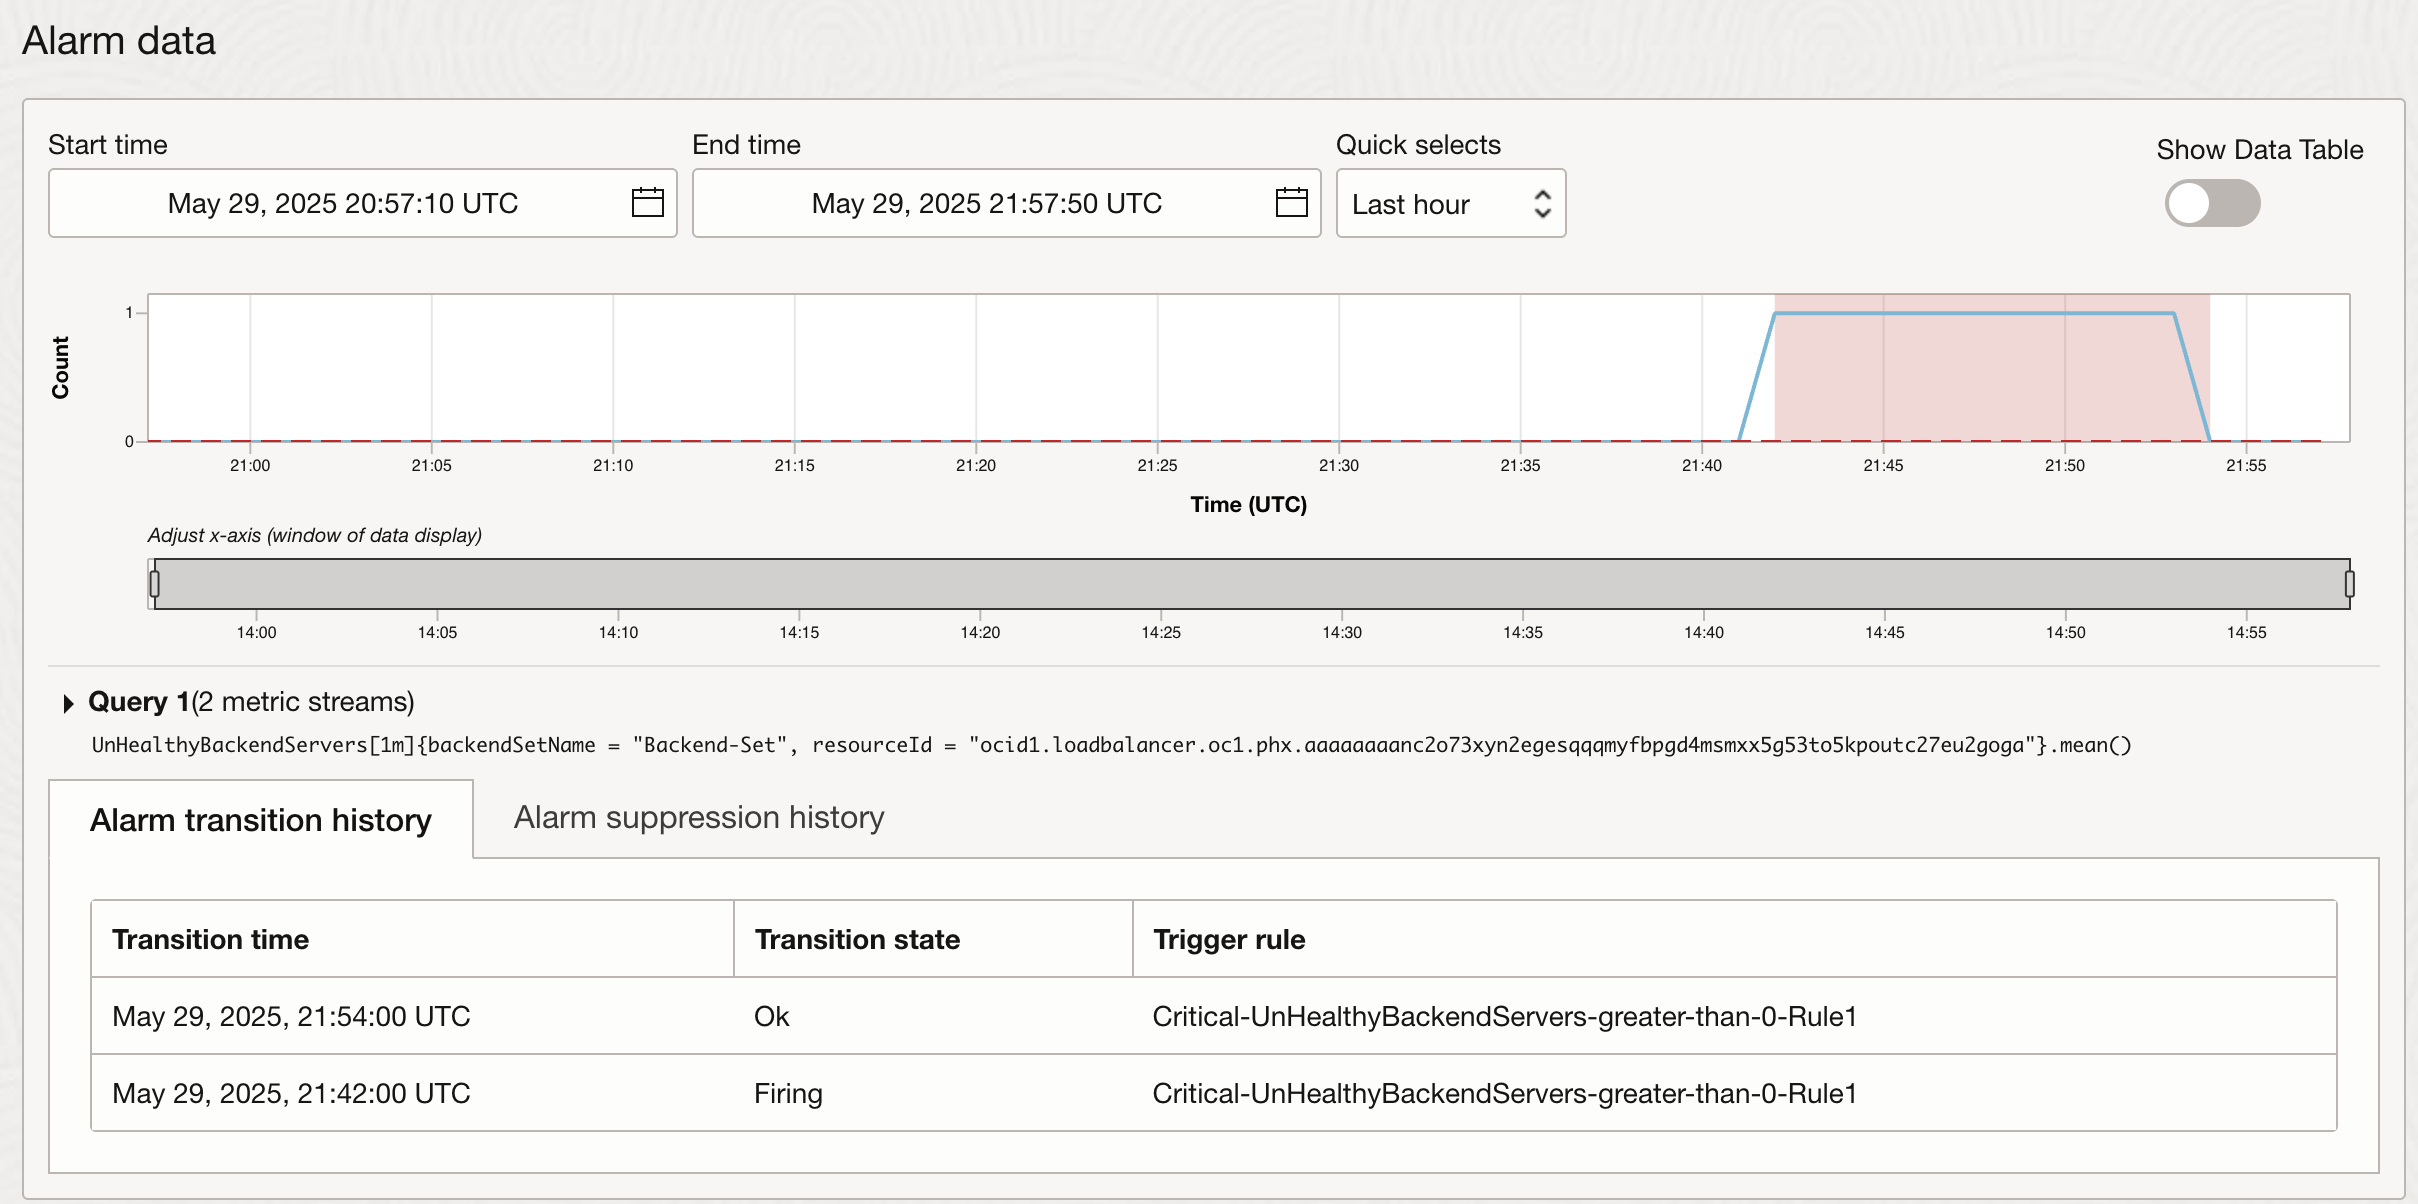
As expected, alarm starts firing and we get following notification in the email:
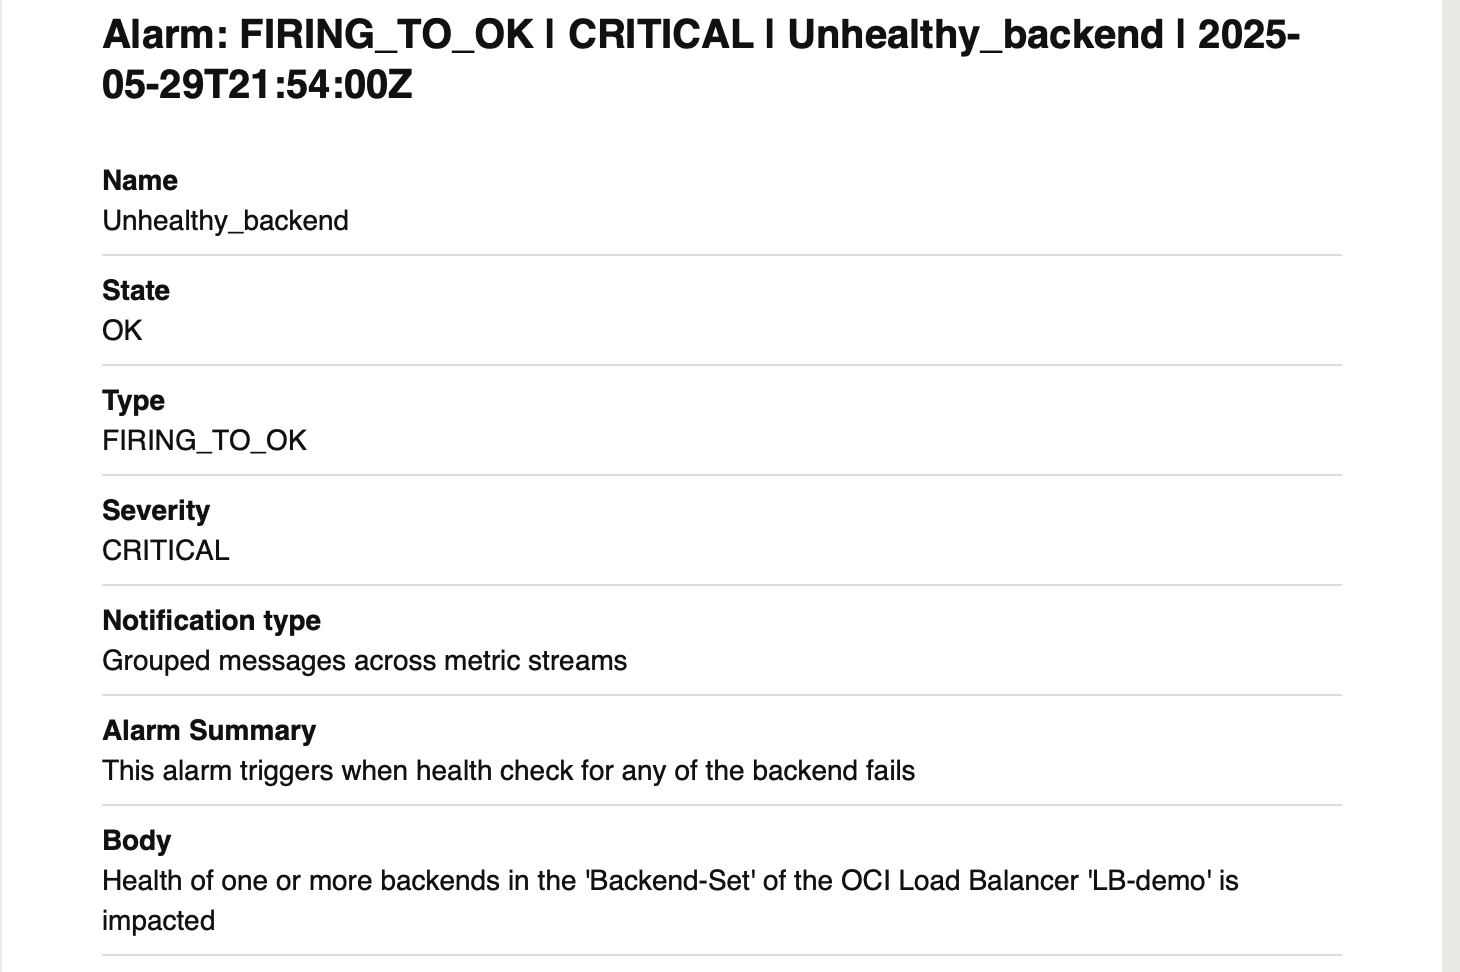
As soon as we fix the issue that is causing the health check to fail, health check goes back to ‘OK’ and alarm stops firing. Recipient also receives an email notification:
Conclusion:
In this blog, we explored how to use OCI’s native Monitoring service—specifically Metrics, Alarms, and Notifications—to actively monitor the backend health of a specific backend set in an OCI Load Balancer. By automating this process, you can ensure timely alerts and take swift action, leading to faster and more efficient issue resolution.