In part one of this series, I covered how to access and use various features to present filtered VCN Flow Log data. In this blog (part 2), we’ll dive into standard techniques and general guidance for getting the most out of your filters.
The following video also demonstrates what we cover in both blogs:
Custom Filtering Syntax 101
OCI uses a filter syntax called Logging Query Language to create basic or advanced filtering queries. Basic queries can be entered in the Custom filters section in the top left field, which we’ll discuss in this blog. While I can’t cover every filter attribute in this blog, I did want to touch on the most common filters I come across. Since VCN Flow Logs are based on a 5-Tuple of Source IP/Port, Destination IP/Port, & Protocol, we’ll focus on these filters.
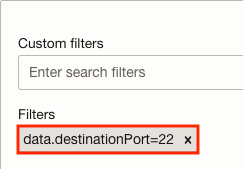
When entering a filter on any of these five attributes, the syntax starts with “data.” followed by the attribute (e.g., data.destinationPort). From there, you have the option to enter a comparison operator such as equal (=), not equal (!=), or greater than (>) followed by the value (e.g. 22 for SSH TCP Port). Take, for example, this filter for TCP port 22:
Here’s a list of some of the most common filters and a brief description:
| Filter | Description |
|---|---|
| data.sourceAddress |
Source IP Address |
| data.destinationAddress |
Destination IP Address |
| data.sourcePort |
Source Port |
| data.destinationPort |
Destination Port |
| data.protocol |
Protocol |
| data.action |
“ACCEPT” or “REJECT” message from matching Security List or NSG security rule. |
*NOTE that adding multiple basic filters to your Custom filter search will result in an AND operation. If you need to search on various filters with complex operators, a better approach would be to use the Advanced Mode mentioned in Part 1 of this series.
Three quick tips when entering filters:
- You must press Enter or click the typed filter syntax for it to take effect.
- As you enter filtering syntax, if it’s a viable command, the Console will help you auto-fill the command as you type.
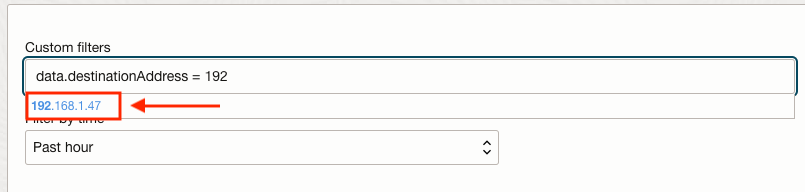
- If there’s any existing historical log data related to your filter, it will show in the auto-fill area. For example, I began typing in a filter for my destination IP address 192.168.1.47. As I was typing, the auto-fill showed me it had a matching log before I completed my filter string:
Example Filter Expressions
With the filtering syntax format in mind, here are some filter expressions I commonly use, and a description of each:
| Filter Expression | Description |
|---|---|
| data.sourceAddress = x.x.x.x |
Filter for log events with the source IP address listed. (NOTE: replace the x’s with the actual IP address) |
| data.destinationAddress = x.x.x.x | Filter for log events with the destination IP address listed. |
| data.sourceAddress != x.x.x.x | Filter for log events without the source IP address listed. |
| data.destinationPort = num | Filter for log events with the destination port. (NOTE: replace ‘num’ with the actual port number) |
| data.destinationPort != num | Filter for log events without the destination port. (NOTE: replace ‘num’ with the actual port number) |
| data.action = ACCEPT | REJECT | Filter for log events with a matching or missing security rule. (NOTE: Enter either ACCEPT or REJECT for the action type. Security Lists/NSGs are allow-lists, if no rule is matched, it’s denied aka REJECT) |
| Combining Filters
|
Filter for log events with the destination IP address listed on a specific destination port. |
| Combining Filters
|
Filter for log events with the destination IP address listed on a specific destination port and allowed by a matching security rule. |
Exploring Log Events
As mentioned in part 1, the default Explore mode will present a visual chart followed by the emitted log events captured below. For each event, you can expand it for additional details regarding the Flow Log by clicking the down arrow on the right side of the log event:

Logs are presented in JSON format. If you would like to see how the log correlates to other log events, select the Before & After tab on the expanded log event as shown:
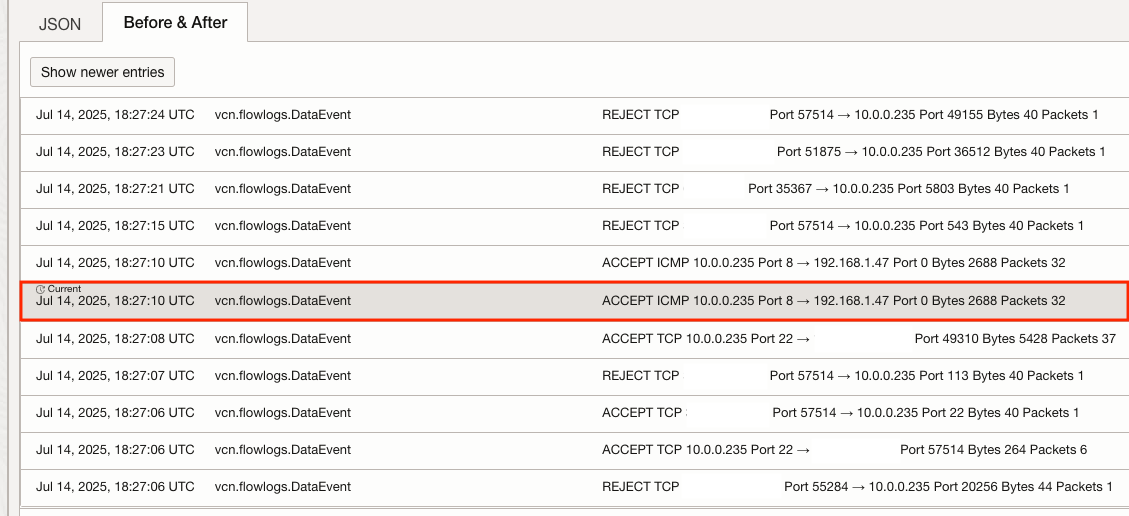
Note that the small print of “Current” on the log event selected highlights where it fits compared to recent logs captured before and after (hence the name) this specific event.
Dissecting the VCN Flow Log Event
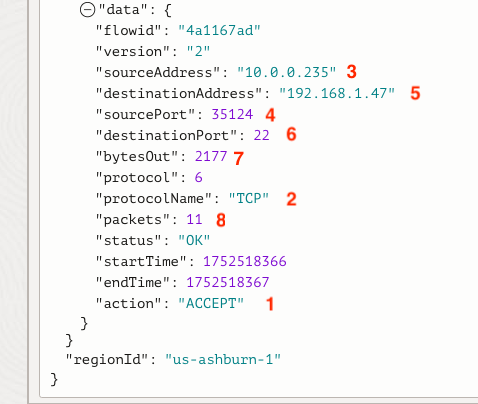
Let’s look at what the message (data.message) column tells us about the log event. It’s essentially split into eight parts as shown in the following picture:
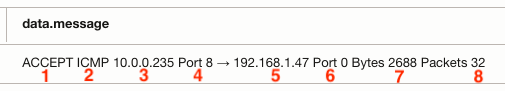
- Specifies whether or not the traffic was allowed “ACCEPT” or denied “REJECT” by a corresponding Security List or NSG rule. Remember that every VCN subnet has at least one Security List associated. Therefore, an “ACCEPT” or “REJECT” message will be applied to every log event.
- Network protocol (e.g., ICMP, TCP, or UDP)
- Source IP address
- Source protocol port number (e.g., TCP ephemeral port range 32768–60999)
- Destination IP address
- Destination protocol port number (e.g., 443 for HTTPS)
- Bytes captured in the log event
- Number of packets captured in the log event
Circling back to an expanded log event, you can see the parts of the flow log that match what was presented above:
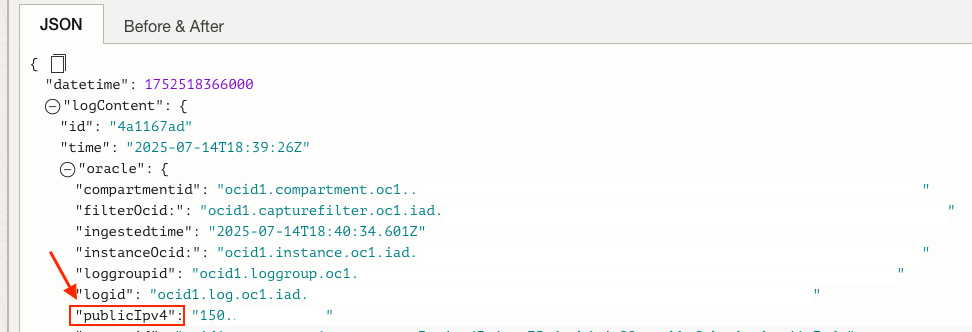
The JSON log includes metadata about many details besides just 5-Tuple network information. This is listed under the “oracle” section of the log. Once expanded, you can find details such as vNIC, subnet, and VCN OCIDs. If your resource has a Public IP assigned, you’ll also see it listed here.
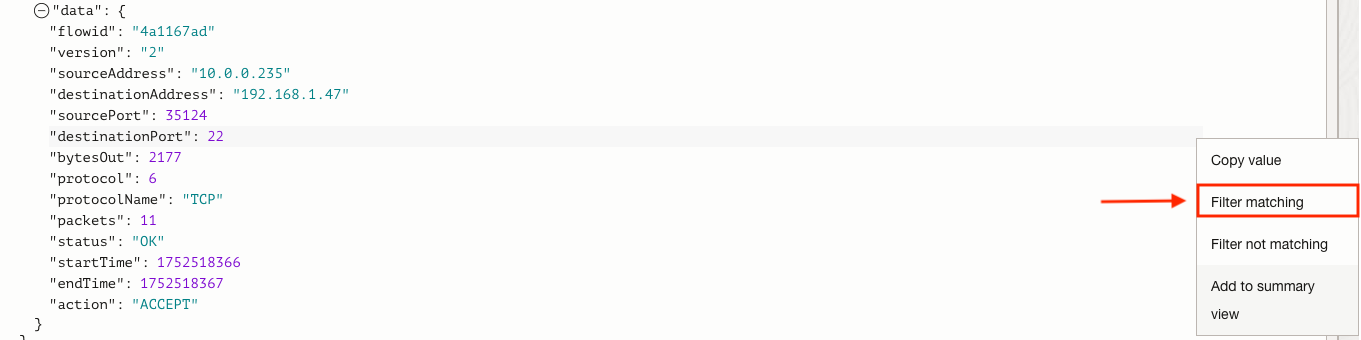
The last thing to note is that you can copy or filter on any of these values presented. Simply highlight the JSON value and select the three vertical dots to the right, followed by any of the actions presented:
Conclusion
VCN Flow Log filtering in OCI turns noisy data streams into actionable insights. With the right syntax and awareness of the log event structure, you can troubleshoot issues faster, validate security rules, and gain clearer visibility into your OCI cloud network behavior.