

The hard part of deploying AI agents is not getting one impressive demo to work. The hard part is explaining what happened after the agent made a strange decision and consumed way more tokens than you expected without any warning, retried a few tools 20 times, kept loading skills in a loop, eventually retrieved the wrong document, touched sensitive data, and still returned a confident answer.
Traditional application monitoring tells you whether an API was slow, an endpoint failed, or a database query timed out. That still matters. But agentic systems add a new layer of behavior: prompts, retrieved context, model choices, tool calls, retries, guardrails, evaluator scores, feedback, cost, and data exposure. If you cannot reconstruct those steps, you are not operating an AI system. You are watching outputs arrive and hoping the process behind them made sense.
AI Agent Observability is the discipline of making that behavior traceable, measurable, governable, and improvable. It is not only about troubleshooting. It is also about quality, safety, cost control, release management, privacy, and trust.
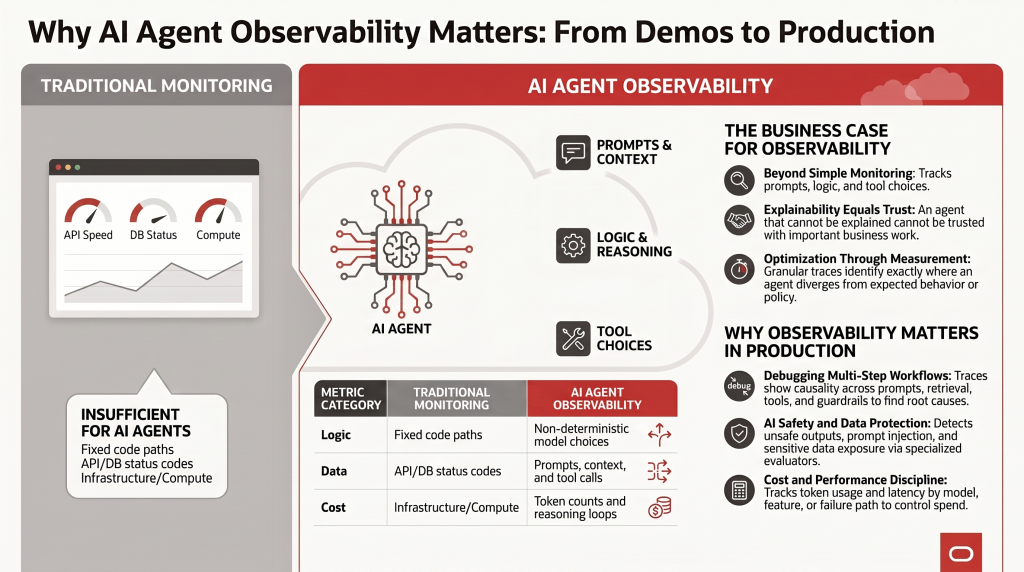
Why Agent Observability Matters
Agent observability matters because production teams need more than a final answer. They need enough evidence to understand what the agent saw, what it decided, what it did, what it cost, and whether it stayed inside the boundaries of policy and data protection.
- Debugging: Traces show causality across multi-step LLM workflows, so teams can identify the failing span and root-cause errors across prompts, retrieval, tools, guardrails, and orchestration.
- Evaluation: Prompt and completion events capture non-deterministic model behavior. Those traces can feed automated evaluations for accuracy, groundedness, format compliance, safety, and other quality characteristics. User feedback tied to specific outputs adds another signal for understanding quality and engagement.
- AI safety: GenAI telemetry, combined with specialized evaluators, helps detect unsafe outputs, bias, prompt injection, privacy violations, policy bypasses, and sensitive data exposure.
- Cost tracking: Usage metrics and token counts reveal operational cost by model, workflow, tenant, feature, prompt version, tool path, or failure path.
- Performance optimization: Latency, throughput, error rate, queue time, retry count, and tool dependency timing give agents the same production performance discipline expected from traditional applications.
- Incident response automation: Observability data can trigger operational workflows such as opening an incident, attaching the trace, notifying the owner, scaling resources, throttling risky paths, or restarting failed components. High-risk actions still need policy, approval, and audit controls.
- Version control and rollback: Tracking model versions, prompt versions, tool schema versions, retrieval indexes, and deployment versions makes it possible to see whether quality or reliability changed after a release and to roll back quickly when a new version degrades behavior.
The business case is simple: an agent that cannot be explained cannot be trusted with important work, and an agent that cannot be measured cannot be optimized.
Reference Architecture
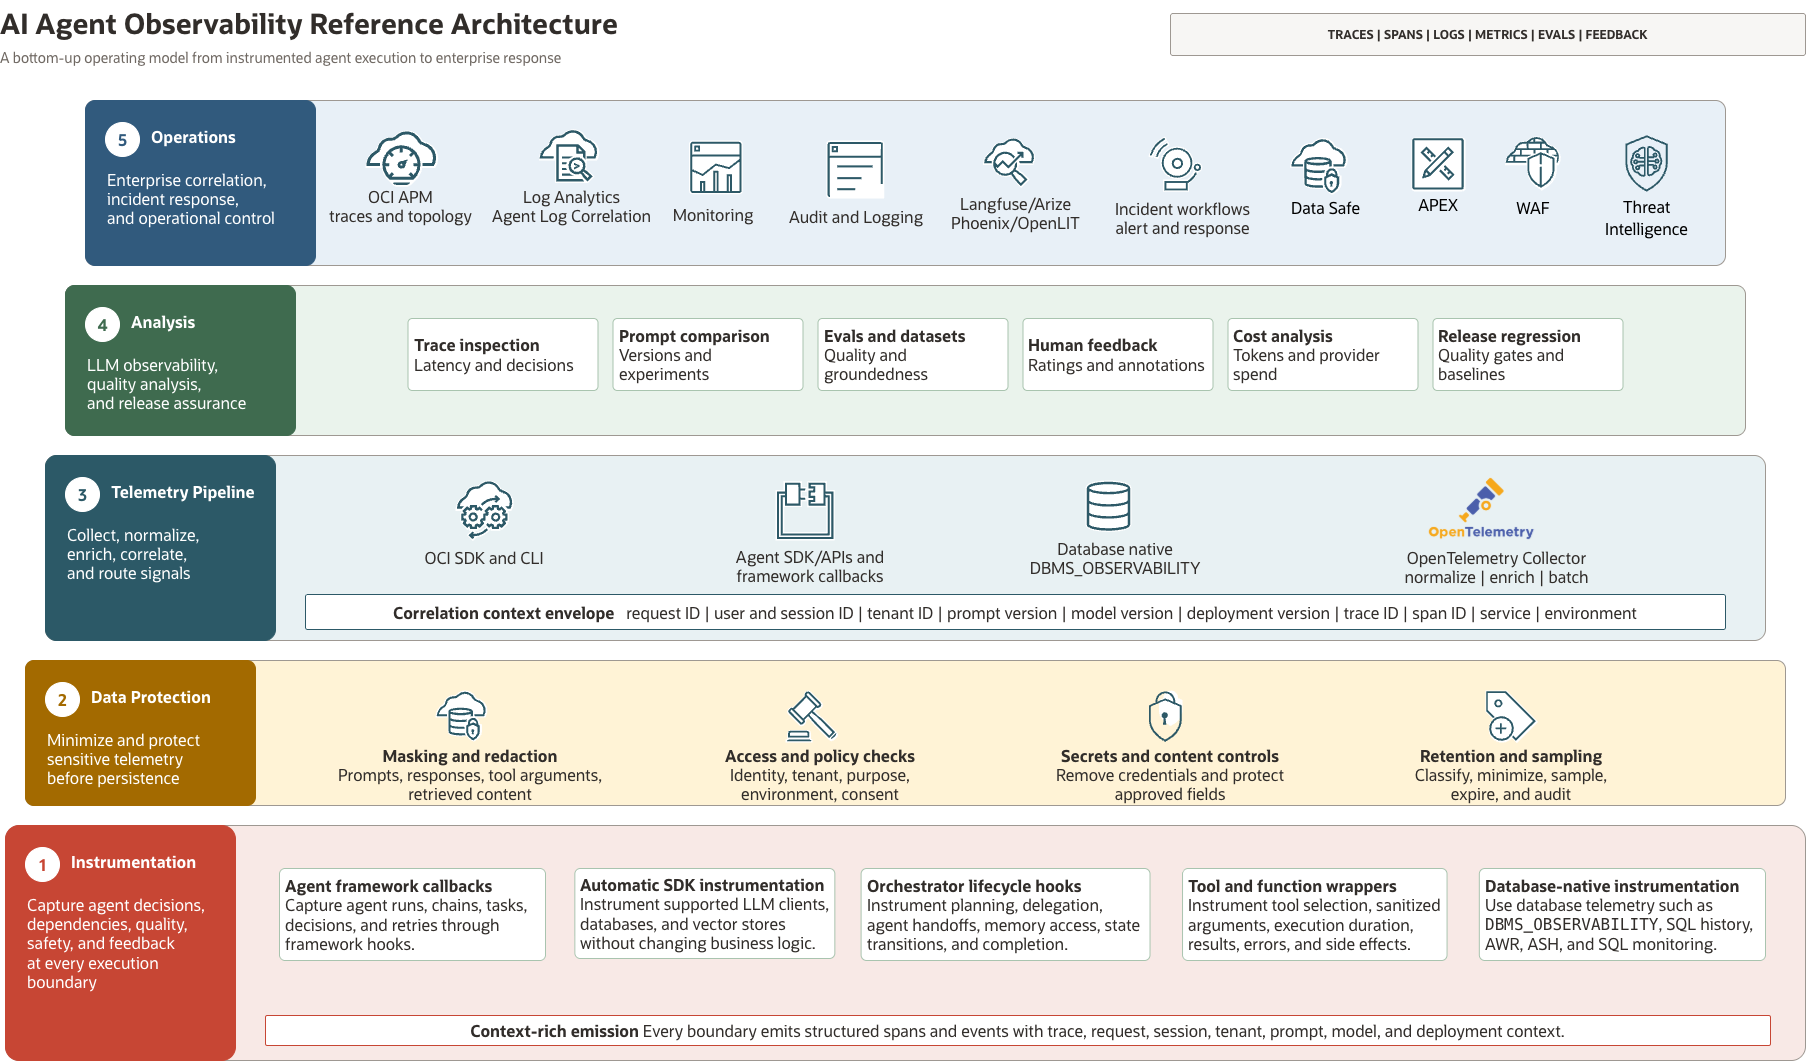
A practical production architecture has five layers:
- Instrumentation layer: Capture traces and spans from the application, orchestration framework, model gateway, retrieval layer, tools, guardrails, evaluators, and feedback UI.
- Data protection layer: Apply masking, redaction, access control, policy checks, retention rules, and sampling before telemetry becomes another sensitive data store.
- Telemetry pipeline: Emit structured events through SDKs, OpenTelemetry, vendor APIs, or database-native history views using DBMS_OBSERVABILITY package. Preserve request IDs, user/session IDs, tenant IDs, prompt versions, model versions, and deployment versions.
- Analysis layer: Use an LLM observability platform for trace inspection, prompt comparison, evals, datasets, feedback, cost analysis, and release regression checks.
- Operations layer: Correlate agent telemetry with APM, logs, metrics, audit, SIEM, database telemetry, and incident management workflows.
Tooling Landscape
No single tool wins every scenario. The right choice depends on whether you prioritize deep eval workflows, open-source self-hosting, framework-native tracing, gateway-level observability, enterprise production support, data-residency controls, or OpenTelemetry portability.
| Tooling approach | Tracing and eval fit | Security and privacy posture | Best fit |
|---|---|---|---|
| Langfuse | Strong traces for LLM calls, chains, agents, tools, metadata, sessions, datasets, scores, experiments, prompt management, and user feedback. | Strong for teams that want masking control: client-side masking can prevent sensitive data from leaving the app, and self-hosted enterprise ingestion masking can centralize policy enforcement. | Teams that want open-source control plus broad LLM observability coverage. |
| LangSmith | Very strong for LangChain and LangGraph applications, with detailed traces, threads, datasets, prompts, online evals, offline evals, and production monitoring. | Supports hiding or masking inputs, outputs, and metadata, plus conditional tracing when some requests should not be traced at all. | Teams already building with LangChain/LangGraph or needing tight framework integration. |
| Helicone | Strong gateway-centric request observability, cost, latency, caching, sessions, prompts, users, and properties. | Good fit for centralized gateway controls and usage visibility. Confirm masking, retention, and self-hosted posture against your compliance requirements before sending raw prompts or tool payloads. | Teams that want fast gateway deployment, usage visibility, and cost controls. |
| Arize Phoenix and Arize AX | Strong open-source tracing for LLMs, retrieval, tools, agents, OpenTelemetry, OpenInference, datasets, experiments, and evaluators. | OpenTelemetry-style control over spans and attributes; Arize documentation includes masking or redacting span attributes for sensitive data handling. | Teams that want open-source AI observability with a path to enterprise AI monitoring. |
| OpenLIT | Strong OpenTelemetry-native tracing for LLMs, agents, vector databases, MCP, GPUs, prompts, metrics, logs, dashboards, and evaluations. | Good for OpenTelemetry-first teams, but sensitive capture must be configured deliberately. OpenLIT warns that database parameter capture can expose passwords, API keys, or personal information. | Teams that want an OpenTelemetry-first, self-hostable AI engineering platform with broad instrumentation coverage. |
| Oracle Autonomous AI Database Select AI Agent | Database-resident agent framework with planning, tool use, reflection, conversation memory, tool history, and agent/team/task history views for transparency. | Strong data-gravity pattern: agents run inside Autonomous AI Database, inherit database security controls and auditing, reduce data movement, and can use controls such as RBAC, CBAC, privileges, VPD, RAS, data masking, encryption, and Data Safe. | Regulated or data-centric workflows where keeping tools, data, policy, and observability close to the database is more important than using a standalone agent framework. |
| OCI Log Analytics with LoganAI | Strong for enterprise log analytics, correlation, clustering, dashboards, and AI-assisted explanations of structured agent runtime logs. It is not a dedicated LLM span tracing product by itself. | Strong for OCI-centric operations, audit, security correlation, and retention governance. Best fed with structured and masked agent telemetry rather than raw sensitive prompts. | OCI-centric enterprises that need production operations, security, audit, and application telemetry in the same investigation workspace. |
The most common pattern will be hybrid: use a specialized LLM observability tool for prompt, trace, eval, and feedback depth, while exporting or correlating key signals into the broader enterprise observability stack.
Note: My friend Paul Parkinson is one of the best database architects that I know – wrote a great blog post and shared his point of view of how to trace from Agent into the Oracle AI Database using the Java observability provider and server-side OTel exporter
Balancing Efficiency And Data Security
The efficiency question is not only “Which tool gives me the best dashboard?” It is also “Where should the data be observed, reduced, masked, and stored?”
For teams that need speed, an OpenAI-compatible gateway or open-source LLM observability tool can provide fast visibility into prompts, token usage, latency, sessions, tool calls, and evals. This is the path highlighted by many practical Langfuse-style implementations: start with trace visibility, add scoring, then turn production failures into datasets and tests.
For teams that need stronger data control, the architecture should shift left. Mask before telemetry export. Keep raw customer records in governed systems. Store references, policy decisions, hashes, row IDs, and summarized observations instead of full payloads when possible. Use self-hosted observability only when the operational team is ready to manage retention, patching, access control, backups, and audit.
This is where Autonomous AI Database Select AI Agent can be a strong enterprise pattern. If the agent’s primary job is to reason over database-resident data, execute database tools, or call governed business logic, running the agent framework inside Autonomous AI Database reduces data movement and lets the agent inherit database security and audit controls. The tradeoff is that you may still want a dedicated LLM observability or evaluation platform for richer prompt experiments, dataset management, human annotation, and cross-application trace analysis. In that case, export masked or summarized telemetry rather than raw sensitive records.
In other words, ADB Select AI Agent is not simply another dashboard option. It is a placement decision: put agent execution close to governed data, then publish safe operational signals outward.
Where OCI Log Analytics And LoganAI Fit
OCI Log Analytics is especially interesting for enterprise AI operations because agent behavior does not end at the LLM boundary. Agents touch identity systems, databases, integration services, ticketing platforms, cloud APIs, network paths, and business applications. Those systems already produce logs, events, and operational signals.
For OCI customers, the pragmatic pattern is to emit structured, masked agent runtime logs into OCI Log Analytics: trace ID, span ID, user or tenant context, prompt version, model name, retrieval source, tool name, latency, token usage, error class, guardrail result, masking policy result, and final failure taxonomy. Once those fields are indexed, teams can use Log Explorer, dashboards, clusters, link visualizations to correlate agent behavior with OCI Audit logs, application logs, infrastructure logs, database telemetry, and security events.
LoganAI adds an AI-assisted investigation layer on top of that telemetry. LoganAI can analyze logs and log-derived data, including AI-powered explanations for single logs, multiple logs, clusters, and charts. It can also fetch metrics from OCI Monitoring using MQL and mix them with logs for analysis.
That makes LoganAI a useful operational companion to LLM tracing platforms. A dedicated LLM observability tool may tell you that a retrieval step failed or a tool call retried. OCI Log Analytics can help answer the next enterprise question: what else was happening in the environment at that time, which tenant or compartment was affected, whether related audit events occurred, whether masking policies fired, and whether similar failures are clustering elsewhere.
Hands-On Example: Trace A Codex Agent With Langfuse
Langfuse is a practical way to demonstrate LLM-focused observability because it gives teams traces, generations, tool calls, sessions, token usage, scores, datasets, and feedback workflows. For Codex specifically, the Langfuse Codex observability plugin traces agent turns, model calls, tool executions, token usage, and subagent threads to Langfuse.
Use this as a development or controlled-environment example first. The plugin can upload Codex transcript data, including prompts, assistant messages, reasoning summaries, tool-call inputs and outputs, model metadata, and token usage. Do not enable it for sessions that contain data you are not comfortable storing in Langfuse.
1. Create a Langfuse project
Create a Langfuse Cloud project or use a self-hosted Langfuse instance. Generate a public key and secret key for the project.
Choose the correct base URL for your data region, for example:
https://cloud.langfuse.comhttps://us.cloud.langfuse.comhttps://jp.cloud.langfuse.com
2. Optional: install the Langfuse skill for Codex
The Langfuse skill gives Codex Langfuse-specific guidance and documentation workflow support.
python3 ~/.codex/skills/.system/skill-installer/scripts/install-skill-from-github.py \
  --repo langfuse/skills \
  --path skills/langfuse
Verify the skill:
ls -la ~/.codex/skills/langfuse
Expected files include:
SKILL.md
references/
3. Add the Langfuse plugin marketplace
codex plugin marketplace add langfuse/codex-observability-plugin
4. Enable the tracing plugin
Depending on your Codex build, you may install the marketplace plugin explicitly:
codex plugin add tracing@codex-observability-plugin
Then verify:
codex plugin list
Expected entry:
tracing@codex-observability-plugin installed, enabled
5. Enable plugin hooks
Edit ~/.codex/config.toml, or use <project>/.codex/config.toml for project-specific tracing.
Put plugin_hooks = true under the [features] block:
[features]
plugin_hooks = true
Enable the plugin:
[plugins."tracing@codex-observability-plugin"]
enabled = true
6. Configure Langfuse credentials
Environment variables are usually the cleanest option for public examples and automation:
export TRACE_TO_LANGFUSE="true"
export LANGFUSE_PUBLIC_KEY="pk-lf-..."
export LANGFUSE_SECRET_KEY="sk-lf-..."
export LANGFUSE_BASE_URL="https://us.cloud.langfuse.com"
You can also use LANGFUSE_CODEX_PUBLIC_KEY, LANGFUSE_CODEX_SECRET_KEY, and LANGFUSE_CODEX_BASE_URL if you want Codex-specific settings that do not affect other Langfuse tools.
For a JSON config file, create ~/.codex/langfuse.json or <project>/.codex/langfuse.json:
{
  "enabled": true,
  "public_key": "pk-lf-...",
  "secret_key": "sk-lf-...",
  "base_url": "https://us.cloud.langfuse.com"
}
Lock down the file:
chmod 600 ~/.codex/langfuse.json
7. Restart Codex
Restart Codex after changing plugin or hook settings. Hook configuration is loaded when Codex starts.
8. Run a test turn and verify traces
Run a simple Codex task that does not contain sensitive data. Then open the Langfuse project and look for a new trace.
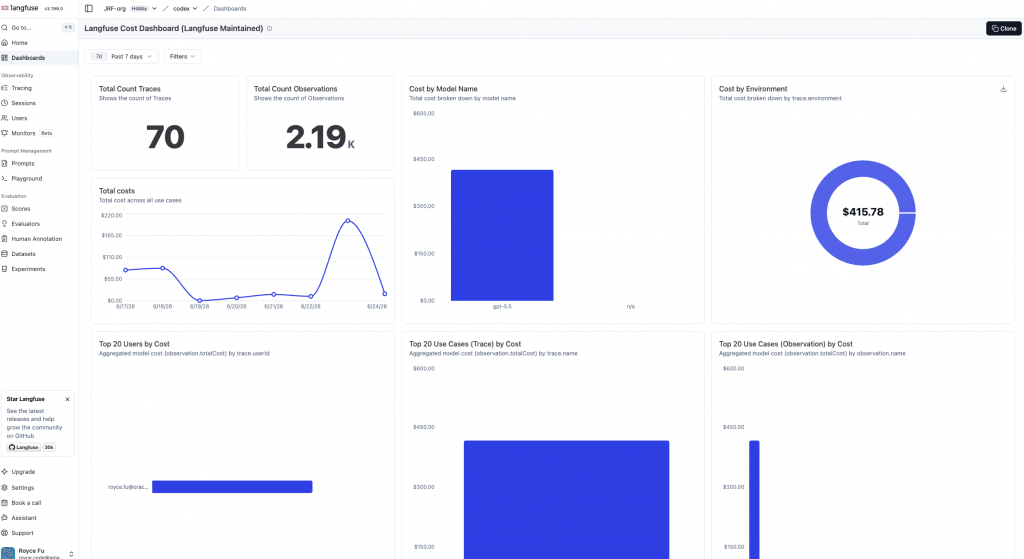
The Langfuse Home view gives a project-level overview of total traces, model cost, observations over time, and scores, so you can confirm telemetry is flowing before drilling into individual runs.
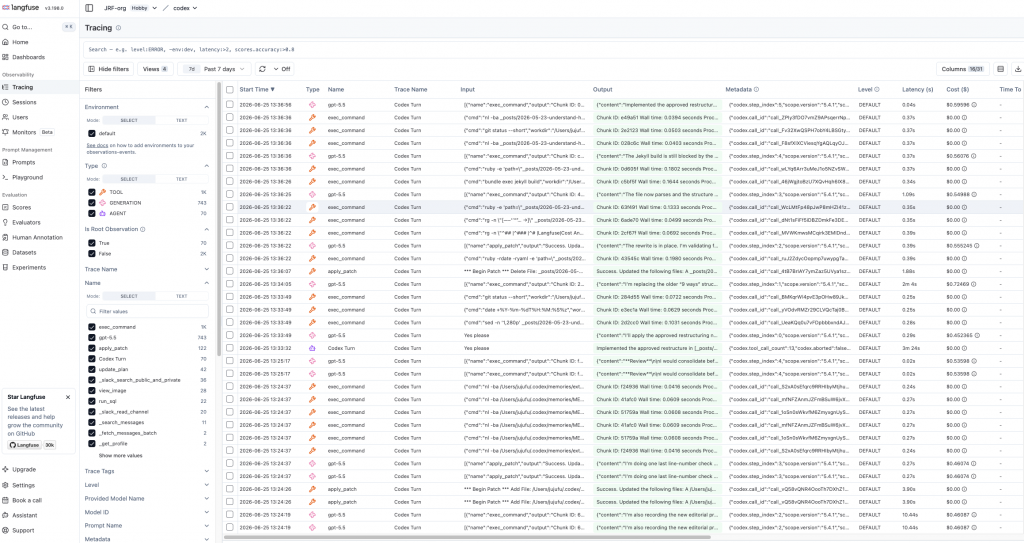
The Tracing view lists every agent run with its timestamp, name, input, output, latency, cost, and token usage, so you can scan for slow, expensive, or failed traces at a glance.
Inspect:
- Overall trace duration.
- Model name and token usage.
- Tool calls and errors.
- Failed commands or retries.
- Cost by model call or generation.
- Long prompts, large outputs, or oversized tool responses.
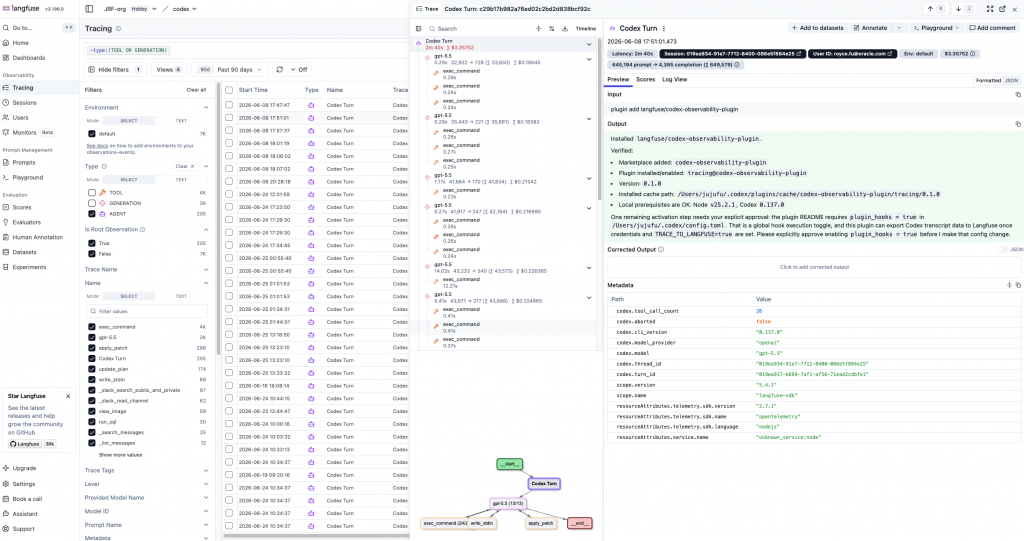
Opening a single Codex Turn trace shows the span tree for that run — the model call, exec_command, apply_patch, and any subagent threads — alongside the prompt, output, and per-span metadata. This is the unit where you root-cause behavior: which step ran, what it produced, and where the run diverged from expectation.
The same detail view exposes the full output and structured metadata for each span — model name, token usage, service attributes, and version tags — which is exactly the evidence you need during an incident review.
You can also run with debug and stricter failure reporting during testing:
export LANGFUSE_CODEX_DEBUG="true"
export LANGFUSE_CODEX_FAIL_ON_ERROR="true"
Turn those off for normal interactive use unless you want tracing upload errors to interrupt your workflow.
9. Use the data to control behavior and cost
Once traces are flowing, start with four dashboards or saved views:
- Cost by model and prompt version: Find expensive prompts, model upgrades, and regressions.
- Cost by trace outcome: Compare successful, failed, retried, and user-rejected requests.
- Tool and retrieval overhead: Identify tools returning too much data or retrieval steps stuffing too much context.
- Quality and safety signals: Correlate evaluator scores, user feedback, guardrail blocks, and sensitive-data masking decisions.
A cost dashboard turns those views into one place to watch spend: total cost across all traces, cost by model name and environment, and the top users, traces, and observations by cost — so a spike points you straight at the workflow that caused it.
The goal is not simply to store agent traces. The goal is to create a feedback loop: observe behavior, identify waste or risk, change prompts/tools/routing/retrieval, evaluate again, and keep the traces that prove the improvement.
Conclusion
The next phase of AI operations will not be won by teams with the prettiest dashboards. It will be won by teams that can reconstruct the full story of an agent’s behavior: what it saw, what it decided, what it did, what it cost, why it failed, what data it exposed, and how that failure becomes a better system tomorrow.
As agents move from demos into enterprise workflows, observability becomes more than troubleshooting. It becomes the control plane for trust, quality, safety, and cost.
The question is not whether your agent can answer. The question is whether you can explain how it answered when production asks for proof, whether you can afford the workflow at scale, and whether you can prove that the explanation did not create a new privacy problem.
References
- Langfuse Codex observability plugin
- Langfuse skill for Codex
- Observability for Enterprise AI Agents: An Open Source Solution
- End-to-End Agentic AI Observability: Tracing from the Agent INTO the Oracle AI Database (using the Java observability provider and server-side OTel exporter)
- OpenTelemetry GenAI semantic conventions
- OpenInference specification
- Braintrust documentation
- Braintrust advanced tracing: Mask sensitive data
- Langfuse documentation
- Langfuse masking of sensitive LLM data
- Langfuse self-hosted data masking
- LangSmith documentation
- LangSmith: Prevent logging of sensitive data in traces
- Helicone documentation
- Arize Phoenix
- Arize tracing configuration: Sensitive data handling
- OpenLIT documentation
- OpenLIT SDK configuration
- Oracle Autonomous AI Database Select AI
- Oracle Autonomous AI Database: About Select AI Agent
- Oracle Autonomous AI Database: Select AI Agent Concepts
- Build Your Agentic Solution using Oracle Autonomous AI Database Select AI Agent
- Oracle Data Safe overview
- OCI Log Analytics: Use LoganAI
- OCI Log Analytics: Prerequisites for LoganAI
- OWASP Top 10 for Large Language Model Applications