Observability has become a foundational requirement for operating modern cloud-native applications, yet many teams still struggle to move beyond basic metrics and logs when diagnosing performance issues. In distributed microservices environments, understanding how a user request flows through multiple services — and where latency or errors are introduced — requires end-to-end tracing.
In this article, I focus on application-level observability on Oracle Cloud Infrastructure (OCI) using OpenTelemetry, the OpenTelemetry (OTel) Collector, and OCI Application Performance Monitoring (APM). Using a microservices based retail application deployed on Oracle Kubernetes Engine (OKE), we walk through a practical approach to instrumenting applications, exporting traces, enriching telemetry with runtime context, and analyzing distributed spans in OCI APM to understand application performance, bottlenecks, and service behavior.
Note: This post focuses specifically on application tracing, while Kubernetes and CI/CD observability are covered in subsequent parts of the series.
Application Architecture and Telemetry Collection
The sample application used in this series is a simple, cloud-native microservices-based retail style application designed to demonstrate application observability patterns on Oracle Cloud Infrastructure (OCI). This retail application is implemented in Python using Flask and is focused on one feature: the checkout request. Python support in modern cloud-native environments is best approached using OpenTelemetry. OpenTelemetry provides a vendor-neutral instrumentation layer that works consistently across Python microservices, enabling portability across backends while still integrating seamlessly with OCI APM.
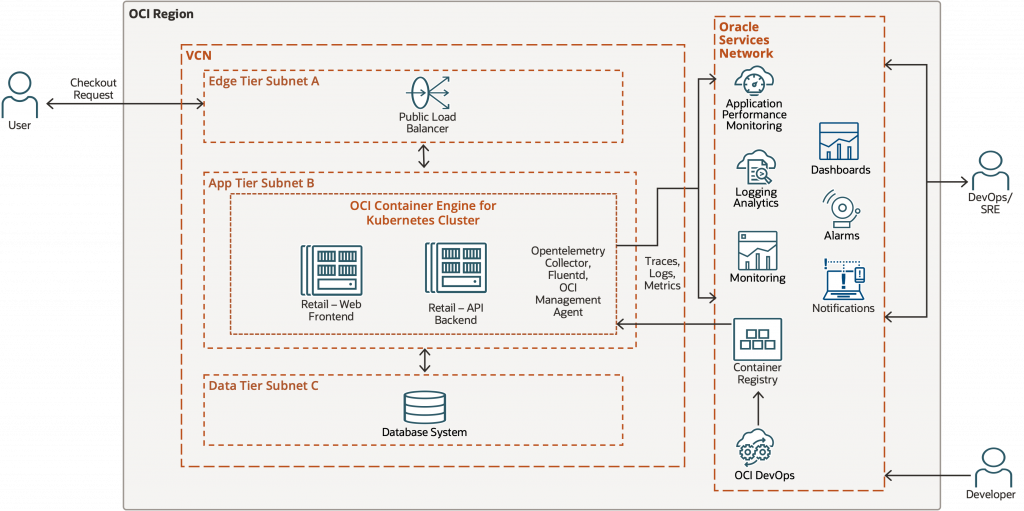
The application is deployed on OKE using OCI DevOps service and follows a tiered architecture commonly used in production environments. External user traffic enters the system through a public load balancer deployed in the edge tier subnet, which forwards requests to services running inside an Oracle Kubernetes Engine (OKE) cluster in the application tier.
The OKE cluster hosts two microservices:
- Retail-Web Frontend
This service exposes the user-facing checkout endpoint. It handles incoming HTTP requests from the load balancer and initiates downstream calls to the backend service as part of the checkout workflow. - Retail-API Backend
This service implements the core business logic for the checkout process, including inventory verification, payment processing, and order creation. For demonstration purposes, these operations interact with a SQLite database deployed in the data tier subnet.
Each checkout request traverses multiple components from the load balancer to the frontend service, through the backend service, and finally to the database making it an ideal candidate for demonstrating distributed tracing and application-level observability.
Both microservices use a combination of programmatic/library based-instrumentation and manual spans to capture request flow and business logic execution. An OpenTelemetry Collector is deployed as a Kubernetes Deployment (single replica) in the same namespace as the application. The collector also enriches telemetry with Kubernetes runtime context such as pod, node, and deployment metadata.
In addition to tracing, the cluster is onboarded to the OCI Log Analytics Solution for Oracle Kubernetes Engine which runs Fluentd and the OCI Management Agent to collect logs and metrics from Kubernetes workloads and nodes. These signals are sent to OCI’s Observability and Management services and enables a unified view of infrastructure health in Log Analytics.
This architecture provides a realistic foundation for exploring application observability. In this first part of the series, the focus is on application tracing and request-level visibility using OpenTelemetry and OCI APM.
Understanding OpenTelemetry and Why It Matters
OpenTelemetry provides a standardized way to generate and export telemetry from applications. OpenTelemetry Protocol (OTLP) is the default and recommended protocol for collecting telemetry signals (traces, logs, metrics) are transmitted between components. The OTLP span exporter sends spans to whichever OTLP endpoint is configured. In this case the spans are sent to OCI Application Performance Monitoring (APM).
Instrumentation Strategies in OpenTelemetry
Observability is a design choice, not a switch you flip.
OpenTelemetry offers 3 strategies to instrument your application code which are as follows.
| Strategy | Code Change | Control | Best Use |
|---|---|---|---|
| Auto | None | Low | Quick start |
| Programmatic (Library-based) | Low | Medium | Baseline visibility |
| Manual | High | High | Business logic |
In this application, auto-instrumentation alone is not sufficient. Instead, the application uses a combination of programmatic instrumentation(library-based) for framework-level visibility and manual instrumentation to capture business-level intent.
Trace Design in the Retail Checkout Application
In this first part of the series, the focus is specifically on distributed tracing, which captures a single user request starts when the user hits the Checkout button on the UI, moving on to the backend and then SQLite database. A single trace tracking this request will have multiple spans and, in this example, individual spans will capture every HTTP request and operations such as “verifying inventory,” “executing payment” and “create order” as shown in Image.
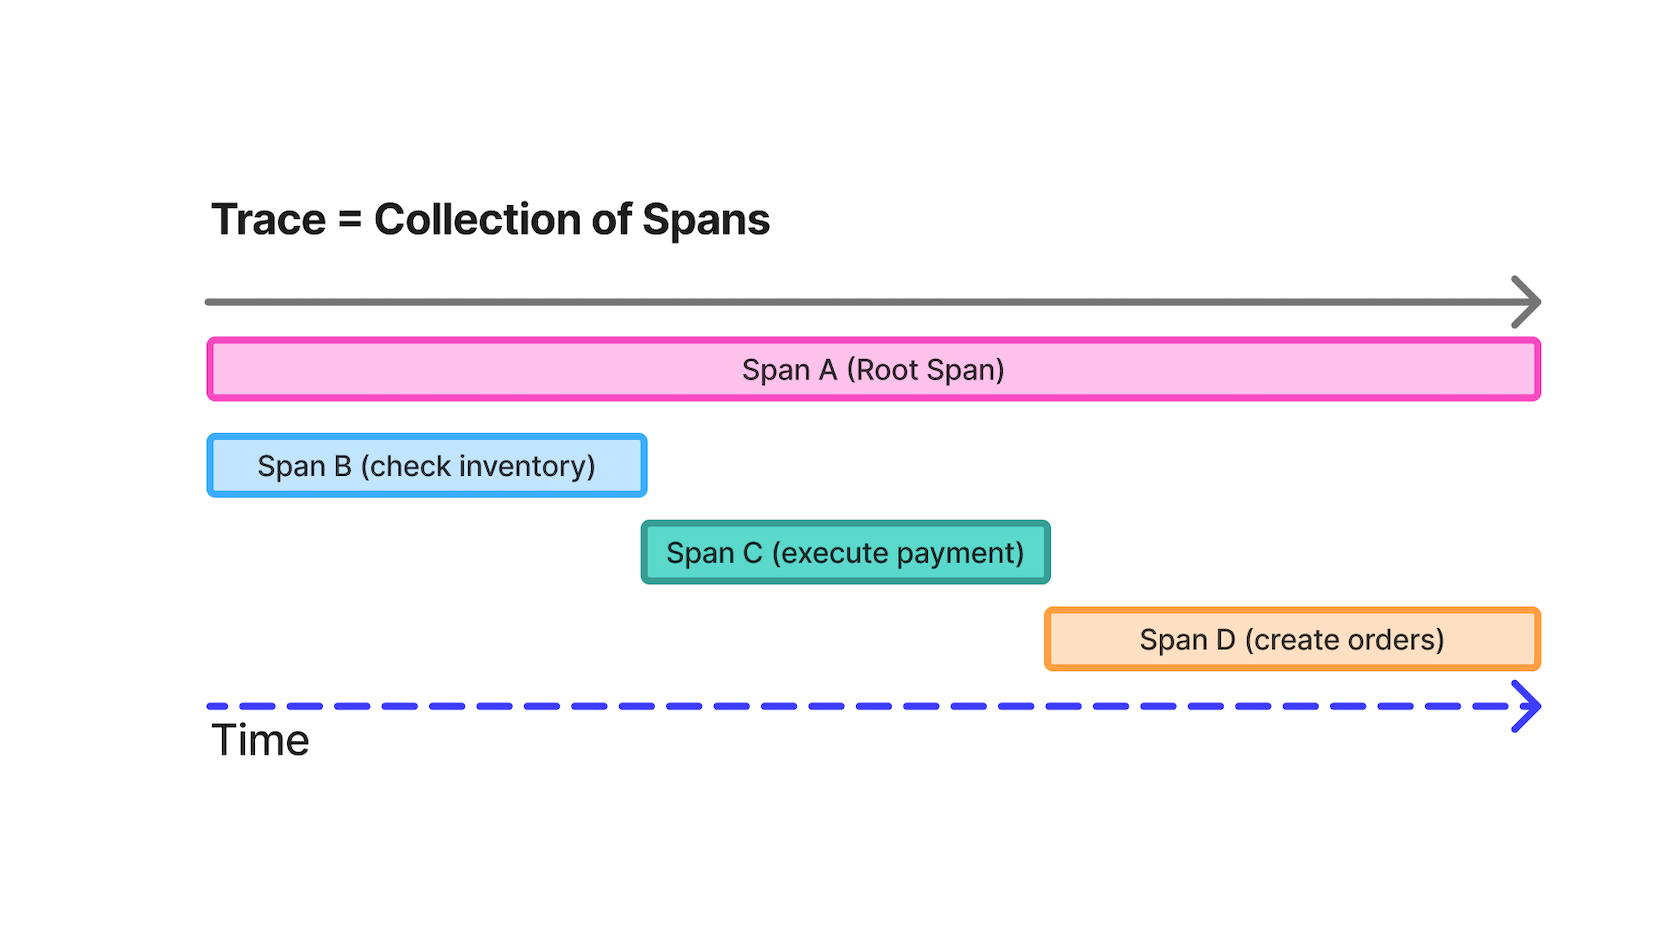
Rather than treating a request as a black box, the checkout flow is intentionally broken into discrete stages, each represented by its own span. This makes it possible to reason about performance and failures at a business level rather than just a technical one.
Connecting OpenTelemetry to OCI Application Performance Monitoring
On OCI, OpenTelemetry acts as the instrumentation standard, while OCI APM provides the managed analysis, visualization, and operational context required to reason about distributed systems at scale. Pre-requisites for OCI APM are available here.
Step 1: Create an OCI APM Domain
- In the OCI Console, go to:
Observability & Management → Application Performance Monitoring → Administration. - Click Create APM Domain and fill:
- Name
- Description
- Once created, note:
- Data Upload Endpoint (used for OTLP trace ingestion)
- APM Private Data Key (used for authorization)
These values are required to authenticate and send trace data to OCI APM.
Step 2: Store APM Endpoint and Authorization in a Kubernetes Secret
To avoid embedding credentials in application or Collector configuration files, the OCI APM endpoint and authorization key are stored in a Kubernetes Secret and injected into the OpenTelemetry Collector at runtime.
Create the secret using the following command:
# Ensure namespace exists first
kubectl create namespace <namespace name> --dry-run=client -o yaml | kubectl apply -f -

# Create the secret with the explicit /private/ path
kubectl create secret generic apm-collector \
  -n demo-obs \
  --from-literal=APM_TRACES_ENDPOINT="https://<domain-id>.apm-agt.<region>.oci.oraclecloud.com/20200101/opentelemetry/private/v1/traces" \
  --from-literal=APM_AUTH="dataKey <your-private-key>"
This secret contains:
APM_TRACES_ENDPOINT– the OCI APM OTLP ingestion endpointAPM_AUTH– the HTTP Authorization header required by OCI APM
Configure the OpenTelemetry Collector to Export Traces to OCI APM
In this architecture, application services export traces to an in-cluster OpenTelemetry Collector, which acts as a gateway between the application and OCI Application Performance Monitoring (APM). The Collector is responsible for exporting traces to OCI APM using the OTLP/HTTP protocol, while application pods remain unaware of OCI-specific endpoints or credentials. On OCI, this Collector-based approach makes it easy to enrich traces with OKE metadata and later correlate traces with Logging Analytics and Monitoring signals. This Collector-based approach reflects how OpenTelemetry is typically deployed in production Kubernetes environments and aligns well with OCI’s managed observability services.
Collector-as-gateway architecture
Step 1: Application exports traces to the in-cluster OTel Collector
In the application deployment manifest, point the OTLP exporter to the Collector service:
- name: OTEL_EXPORTER_OTLP_PROTOCOL
  value: http/protobuf
- name: OTEL_EXPORTER_OTLP_TRACES_ENDPOINT
  value: http://otel-collector.<namespace>.svc.cluster.local:4318/v1/traces
Step 2: Collector exports traces to OCI APM using OTLP/HTTP + Authorization header
In the Collector config (eg: otel-collector.yaml), configure an OTLP/HTTP exporter to OCI APM:
otlphttp/apm:
        traces_endpoint: ${APM_TRACES_ENDPOINT}
        headers:
          Authorization: ${APM_AUTH}
        compression: none
        timeout: 10s
Step 3: Verify the Runtime Configuration
To verify that the Collector received the correct OCI APM configuration at runtime:
kubectl exec -n <namespace> deploy/otel-collector -- env | grep APMDefine Service Identity and Resource Attributes for OCI APM
After configuring OpenTelemetry to collect and send traces to OCI APM, the next step is making those traces searchable and meaningful in APM by defining consistent service identity and resource attributes.
Step 1: Application-level resource attributes
Service identity comes first. In OCI APM, the service.name resource attribute determines how spans are grouped into services. Additional attributes such as environment and version become filterable dimensions in Trace Explorer. This can be repeated in each microservices’ deployment manifest with its own details. I am sharing snippet from retail-api service.
- name: OTEL_SERVICE_NAME
  value: retail-api
- name: OTEL_RESOURCE_ATTRIBUTES
value: service.namespace=retail-obs,service.version=${IMAGE_TAG_OR_BUILD_ID},deployment.environment=retail-obs-demo,demo.name=retail-obs-2026- OTEL_SERVICE_NAME will appear as
service.name: the primary grouping key in OCI APM (how services appear in Trace Explorer and service maps) service.namespace: logical grouping (useful when you have multiple related services or multiple demos)service.version: enables version-aware troubleshooting (e.g., comparing v1 vs v2 latency)deployment.environment: separates dev/test/prod or demo environments so traces don’t blend
Note: When using this code block, replace all values with your own service related values.
Step 2: Collector-level resource processors
The Collector is the right place to add global tags and platform context because it centralizes configuration across services. This avoids duplicating attributes in every application deployment and keeps credentials and routing logic outside application pods. Below is code from OTel collector configuration file.
processors:
      # 1) Stamp route = collector (so you can filter in APM)
      resource/route:
        attributes:
          - key: telemetry.route
            action: upsert
            value: collector

      # 2) Add your business tags from env (set in Deployment below)
      resource/default:
        attributes:
          - key: demo.name
            action: insert
            value: ${DEMO_NAME}

      # 3) Enrich with Kubernetes context (namespace/pod/node/deployment/container)
      k8sattributes:
        auth_type: serviceAccount
        pod_association:
        - sources:
          - from: connection
        extract:
          metadata:
            - k8s.namespace.name
            - k8s.pod.name
            - k8s.pod.uid
            - k8s.node.name
            - k8s.deployment.name
- k8s.container.nameresource/route(upsert): ensures every span hastelemetry.route=collector, which helps you filter traces based on ingestion path or pipelineresource/default(insert): addsdemo.nameonly if the application didn’t set it (so Collector can safely apply defaults)k8sattributes: enriches spans with pod/node/deployment metadata so traces can be correlated to runtime context in Kubernetes
Note: If an attribute is set both in the application and the Collector, the Collector configuration determines whether it overwrites or preserves the application value.
Instrumenting the Application to Generate Meaningful Traces
With the trace pipeline and service identity in place, the final step is instrumenting application code so that traces capture not just request boundaries, but meaningful business stages that can be analyzed in OCI APM Trace Explorer.
In this section, we start by enabling programmatic (library-based) instrumentation in the retail-api service. This provides a high-value baseline of spans across HTTP requests, downstream calls, and database operations—before adding any manual business logic spans.
Prerequisites: This example uses the OpenTelemetry Python SDK and the Flask/Requests/SQLite3 instrumentors. Ensure your environment includes the following packages (versions shown here match this demo):
pip install \
opentelemetry-api==1.28.0 opentelemetry-sdk==1.28.0 opentelemetry-exporter-otlp==1.28.0 \
opentelemetry-instrumentation==0.49b0 \
opentelemetry-instrumentation-flask==0.49b0 \
opentelemetry-instrumentation-requests==0.49b0 \
opentelemetry-instrumentation-sqlite3==0.49b0 \
opentelemetry-instrumentation-logging==0.49b0
Step 1: Programmatic Instrumentation (Library-Based Spans)
Programmatic instrumentation gives you always-on baseline traces with minimal code changes. In the retail-api service, enabling the Flask, Requests, and SQLite3 instrumentors automatically captures:
- Inbound HTTP server spans for Flask routes
- Outbound HTTP client spans for downstream service calls
- Database spans for SQLite queries
- Log correlation context, allowing logs to be tied back to traces
This baseline is foundational for using OCI APM Trace Explorer effectively: you can quickly identify slow endpoints, determine whether latency comes from application logic or dependencies, and follow a request end-to-end across services before introducing manual business spans.
Programmatic Instrumentation Bootstrap
The following code bootstraps OpenTelemetry for the application. It initializes a TracerProvider with resource attributes, configures an OTLP exporter to send spans to the in-cluster OpenTelemetry Collector, and enables framework and library instrumentations.
Implementation note: In practice, this code lives in a small utility module (for example, telemetry.py) and is invoked from the main application entrypoint. This keeps business logic clean while ensuring instrumentation is initialized exactly once at startup. Below is the module telemetry.py.
import os
import logging

from opentelemetry import trace
from opentelemetry.sdk.resources import Resource
from opentelemetry.sdk.trace import TracerProvider
from opentelemetry.sdk.trace.export import BatchSpanProcessor

from opentelemetry.exporter.otlp.proto.http.trace_exporter import OTLPSpanExporter
from opentelemetry.instrumentation.logging import LoggingInstrumentor
from opentelemetry.instrumentation.flask import FlaskInstrumentor
from opentelemetry.instrumentation.requests import RequestsInstrumentor
from opentelemetry.instrumentation.sqlite3 import SQLite3Instrumentor

_bootstrapped = False

def _build_resource() -> Resource:
    """
    Reads OTEL_RESOURCE_ATTRIBUTES + OTEL_SERVICE_NAME from env via detectors.
    Only fills a hard safety default if missing.
    """
    res = Resource.create()
    if not res.attributes.get("service.name"):
        res = res.merge(Resource.create({"service.name": "retail-api"}))
    return res

def bootstrap(app):
    """
    Call once after Flask app is created (before serving requests).
    """
    global _bootstrapped
    if _bootstrapped:
        return
    _bootstrapped = True

    # ---- provider + exporter ----
    resource = _build_resource()
    provider = TracerProvider(resource=resource)
    trace.set_tracer_provider(provider)

    exporter = OTLPSpanExporter(
        endpoint=os.getenv("OTEL_EXPORTER_OTLP_TRACES_ENDPOINT"),
    )
    provider.add_span_processor(BatchSpanProcessor(exporter))

    # ---- programmatic-instrumentation ----
    FlaskInstrumentor().instrument_app(app)
    RequestsInstrumentor().instrument()

    # sqlite3 auto spans
    SQLite3Instrumentor().instrument()

    # ---- log correlation (optional) ----
    LoggingInstrumentor().instrument(set_logging_format=False)
    logging.getLogger("opentelemetry").setLevel(logging.WARNING)
Step 2: Initializing Instrumentation at Application Startup
Programmatic instrumentation must be initialized after the Flask application object is created but before the application begins handling requests. The telemetry.py import and bootstrap(app) call should happen as early as possible in app.py, ideally before any other logic imports. Below is the code from app.py.
from api_telemetry import annotate_response, current_trace_span_ids, bootstrap

app = Flask(__name__)
# programmatic instrumentation
bootstrap(app)
Step 3: Configuration via Environment Variables (Kubernetes-Friendly)
The Python code above runs inside the application container, while OpenTelemetry configuration is injected by Kubernetes at deployment time. Together, they form a complete instrumentation pipeline without hardcoding endpoints or credentials into the application. Below is the env block from deployment manifest for retail-api service.
env:
- name: SERVICE_VERSION
  value: ${IMAGE_TAG_OR_BUILD_ID}
- name: OTEL_SERVICE_NAME
  value: retail-api
- name: OTEL_RESOURCE_ATTRIBUTES
  value: service.namespace=retail-obs,service.version=${IMAGE_TAG_OR_BUILD_ID},deployment.environment=retail-obs-demo,demo.name=retail-obs-2026

# Sampling + propagation
- name: OTEL_TRACES_SAMPLER
  value: always_on
- name: OTEL_PROPAGATORS
  value: tracecontext,baggage

# Log correlation
- name: OTEL_PYTHON_LOG_CORRELATION
  value: "true"

# Hide healthz in traces
- name: OTEL_PYTHON_FLASK_EXCLUDED_URLS
  value: /(healthz?|live|ready)/?
- name: OTEL_PYTHON_WSGI_EXCLUDED_URLS
  value: /(healthz?|live|ready)/?

# Exporter -> Collector via OTLP/HTTP
- name: OTEL_EXPORTER_OTLP_PROTOCOL
  value: http/protobuf
- name: OTEL_EXPORTER_OTLP_TRACES_ENDPOINT
  value: http://otel-collector.demo-obs.svc.cluster.local:4318/v1/traces
| Variable | Purpose | Example |
|---|---|---|
OTEL_SERVICE_NAME | Service identity in OCI APM | retail-api |
OTEL_RESOURCE_ATTRIBUTES | Filterable dimensions in Trace Explorer | service.namespace=…, service.version=…, deployment.environment=… |
OTEL_TRACES_SAMPLER | Sampling strategy | always_on |
OTEL_PROPAGATORS | Cross-service context propagation | tracecontext,baggage |
OTEL_EXPORTER_OTLP_PROTOCOL | OTLP transport | http/protobuf |
OTEL_EXPORTER_OTLP_TRACES_ENDPOINT | Collector endpoint | http://otel-collector.<ns>.svc.cluster.local:4318/v1/traces |
OTEL_PYTHON_LOG_CORRELATION | Log/trace correlation | true |
Why propagators matter: tracecontext,baggage ensures W3C-compliant context propagation. When the frontend calls the backend, the trace ID is carried across HTTP boundaries so OCI APM can stitch the request into a single distributed trace. Without propagation, each service would appear as an isolated trace. While tracecontext propagates the Trace ID, baggage allows you to pass custom metadata (like a Customer ID or Order Type) across services so it’s available in every span of the request.
In distributed environments, not all traffic is equal. Exclusion logic allows you to filter out high-frequency “noise” generated by infrastructure, ensuring your telemetry remains focused on actual user transactions. I use the following variables to manage this:
OTEL_PYTHON_FLASK_EXCLUDED_URLS: Specifically tells the Flask instrumentor which endpoints to ignore.
OTEL_PYTHON_WSGI_EXCLUDED_URLS: Provides a secondary layer of filtering at the WSGI level.
Kubernetes clusters frequently ping services with liveness (/live) and readiness (/ready) probes to verify health. Without exclusion logic, these pings would flood OCI APM Trace Explorer
with thousands of identical, low-value spans, making it difficult to find real application errors or performance bottlenecks. By using a regex pattern like /(healthz?|live|ready)/?, I effectively “silence” these infrastructure signals and keep your OCI APM dashboards clean and actionable.
What You’ll See in OCI APM Trace Explorer
Once this instrumentation is enabled and traces are flowing to OCI APM, each checkout request appears as a single distributed trace in Trace Explorer:
- A top-level Flask server span representing the incoming request
- Nested client spans for downstream HTTP calls to other services
- Child database spans representing SQLite query execution
- Clear parent–child relationships that show how time is spent across the request lifecycle
This structure makes it easy to identify latency bottlenecks, compare service behavior across environments or versions, and reason about system performance without reading application logs.
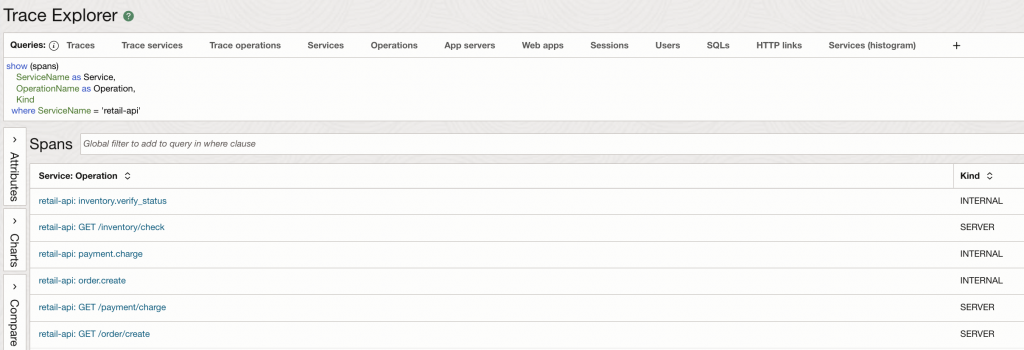
Once the application is deployed with the OTEL_SERVICE_NAME set to retail-api, we can verify the data in the OCI APM Trace Explorer. By switching the query scope from traces to spans, we can isolate the specific operations performed by our microservice.
As seen in the results, the ServiceName dimension correctly reflects our configured identity. Furthermore, we can see two distinct types of spans:
- SERVER Spans: These represent the entry points into our API (e.g.,
GET /inventory/check), showing that the automatic instrumentation is capturing inbound HTTP traffic. - INTERNAL Spans: These represent the custom business logic we instrumented (e.g.,
inventory.verify_status), proving that our manual spans are being correctly parented and exported.
Manual Instrumentation for Business-Level Visibility (retail-web)
Programmatic instrumentation provides a strong baseline, but it cannot capture business intent. To understand why a checkout is slow—or which stage of the checkout flow failed—we need to add manual spans that represent meaningful business steps.
In the retail-web service, manual instrumentation is used to model the checkout workflow itself. These spans sit on top of the programmatic baseline and make the trace readable in terms of inventory verification, payment processing, and order creation.
Pro-Tip: Initialization Order Matters
OpenTelemetry instrumentation must be initialized as early as possible in the application lifecycle.
Important: Import your telemetry module and call bootstrap(app) immediately after creating the Flask application and before importing business logic or making library calls (such as requests). This ensures instrumentors can correctly wrap libraries and capture spans.
In practice, this means:
Keeping tracing setup in a small utility module (for example, telemetry.py)
Calling bootstrap(app) at the top of app.py, right after creating the Flask app
Why Manual Spans Matter
Manual spans allow you to:
- Define business stages that align with how teams reason about the system
- Measure latency at each stage of a workflow (not just per endpoint)
- Quickly identify where failures occur within a request
- Create a trace structure that is immediately understandable in OCI APM Trace Explorer
When combined with programmatic spans, manual spans provide a layered view:
infrastructure and dependencies at the bottom, business intent at the top.
Step 1: Define the Tracer Once (Avoid NameError)
Define a tracer once at module level. Below is the code from retail-web application file
from opentelemetry import trace

tracer = trace.get_tracer(__name__)
Step 2: Anchoring the Checkout Workflow with a Parent Span
The HTTP server span for POST /checkout/execute is created automatically by Flask instrumentation. In retail-web, I add a manual parent span named checkoutprocess.execute to represent the checkout workflow as a single unit of work.
This snippet from application file shows how the code attaches a shared retail.flow=checkout attribute to both the server span and the workflow span:
@app.post("/checkout/execute")
def checkout_execute():
    t0 = time.time()

    # The server span for POST /checkout/execute is created automatically (Flask instrumentor)
    server_span = trace.get_current_span()

    # Manual parent span that anchors the business workflow
    with tracer.start_as_current_span("checkoutprocess.execute") as span_checkout:
        span_checkout.set_attribute("retail.flow", "checkout")
        server_span.set_attribute("retail.flow", "checkout")
        try:
            ...
Why this helps in OCI APM: the checkout workflow span becomes a readable “business wrapper” under the HTTP request span, making Trace Explorer timelines easier to interpret than raw endpoint spans alone. It also helps in differentiating between the time taken by just the code vs time taken by any overhead processes recorded by the Flask HTTP span.
Step 3: Modeling Business Stages as Child Spans (Inventory → Payment → Order)
Next, we represent each stage of checkout as its own child span:
inventory.verify_statuspayment.chargeorder.create
In addition to span names, the code consistently sets a retail.stage attribute and adds a lightweight event breadcrumb (stage) on the server span. This makes the workflow easy to scan in the trace UI.
Inventory verification
with tracer.start_as_current_span("inventory.verify_status") as s1:
    stage = "check_inventory"
    s1.set_attribute("retail.stage", stage)
    server_span.set_attribute("retail.stage", stage)
    server_span.add_event("stage", {"retail.stage": stage})

    inv_t0 = time.time()
    inv_r = requests.get(
        f"{API_BASE}/inventory/check",
        timeout=5,
        headers={"Accept": "application/json"},
    )
    inv_ms = int((time.time() - inv_t0) * 1000)
Payment charge
with tracer.start_as_current_span("payment.charge") as s3:
    stage = "charge_payment"
    s3.set_attribute("retail.stage", stage)
    server_span.set_attribute("retail.stage", stage)
    server_span.add_event("stage", {"retail.stage": stage})

    pay_t0 = time.time()
    pay_r = requests.get(
        f"{API_BASE}/payment/charge",
        timeout=5,
        headers={"Accept": "application/json"},
    )
    pay_ms = int((time.time() - pay_t0) * 1000)
Order creation
with tracer.start_as_current_span("order.create") as s2:
    stage = "create_order"
    s2.set_attribute("retail.stage", stage)
    server_span.set_attribute("retail.stage", stage)
    server_span.add_event("stage", {"retail.stage": stage})

    order_t0 = time.time()
    order_r = requests.get(
        f"{API_BASE}/order/create",
        timeout=5,
        headers={"Accept": "application/json"},
    )
    order_ms = int((time.time() - order_t0) * 1000)
Note: Span naming conventions
- Use lowercase, dot-separated names
- Start with the business domain (
inventory.*,payment.*,order.*) - Use action-oriented verbs (
verify_status,charge,create)
Note: Attributes vs. Baggage
In this guide:
- Span attributes (like
retail.flowandretail.stage) are attached to spans and are useful for filtering and grouping in OCI APM Trace Explorer. - Baggage (enabled via
OTEL_PROPAGATORS=tracecontext,baggage) is different: it allows selected metadata to flow automatically across service boundaries (for example, fromretail-webtoretail-api) so downstream spans can access the same context.
For this demo, we use attributes to keep business context visible in the trace UI. Baggage is enabled to support cross-service metadata propagation when you need it.
Surfacing Failures Correctly (and Making Them Visible in OCI APM)
A major benefit of manual instrumentation is precise error attribution. In retail-web, errors are recorded on both:
- the workflow span (
checkoutprocess.execute) and - the HTTP server span (
POST /checkout/execute)
This ensures OCI APM clearly flags the request as failed and shows the error at the right point in the trace.
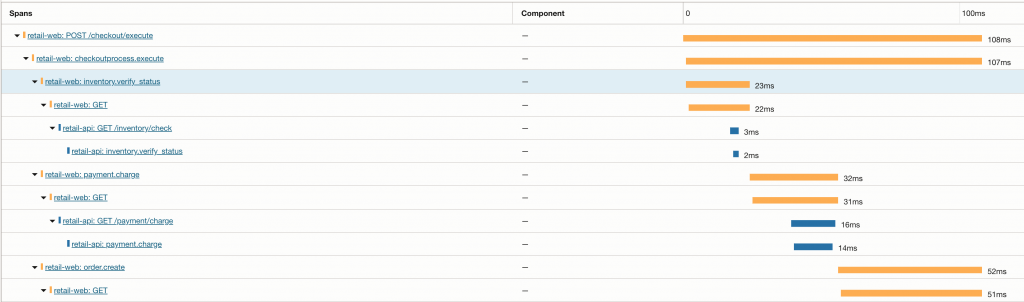
What This Looks Like in OCI APM Trace Explorer
A single checkout request appears in OCI APM as:
An HTTP server span for POST /checkout/execute
Workflow span: checkoutprocess.execute (manual parent span)
Stage Spans: inventory.verify_status, payment.charge, order.create
Nested downstream spans under each stage (from Requests instrumentation), showing calls into retail-api.
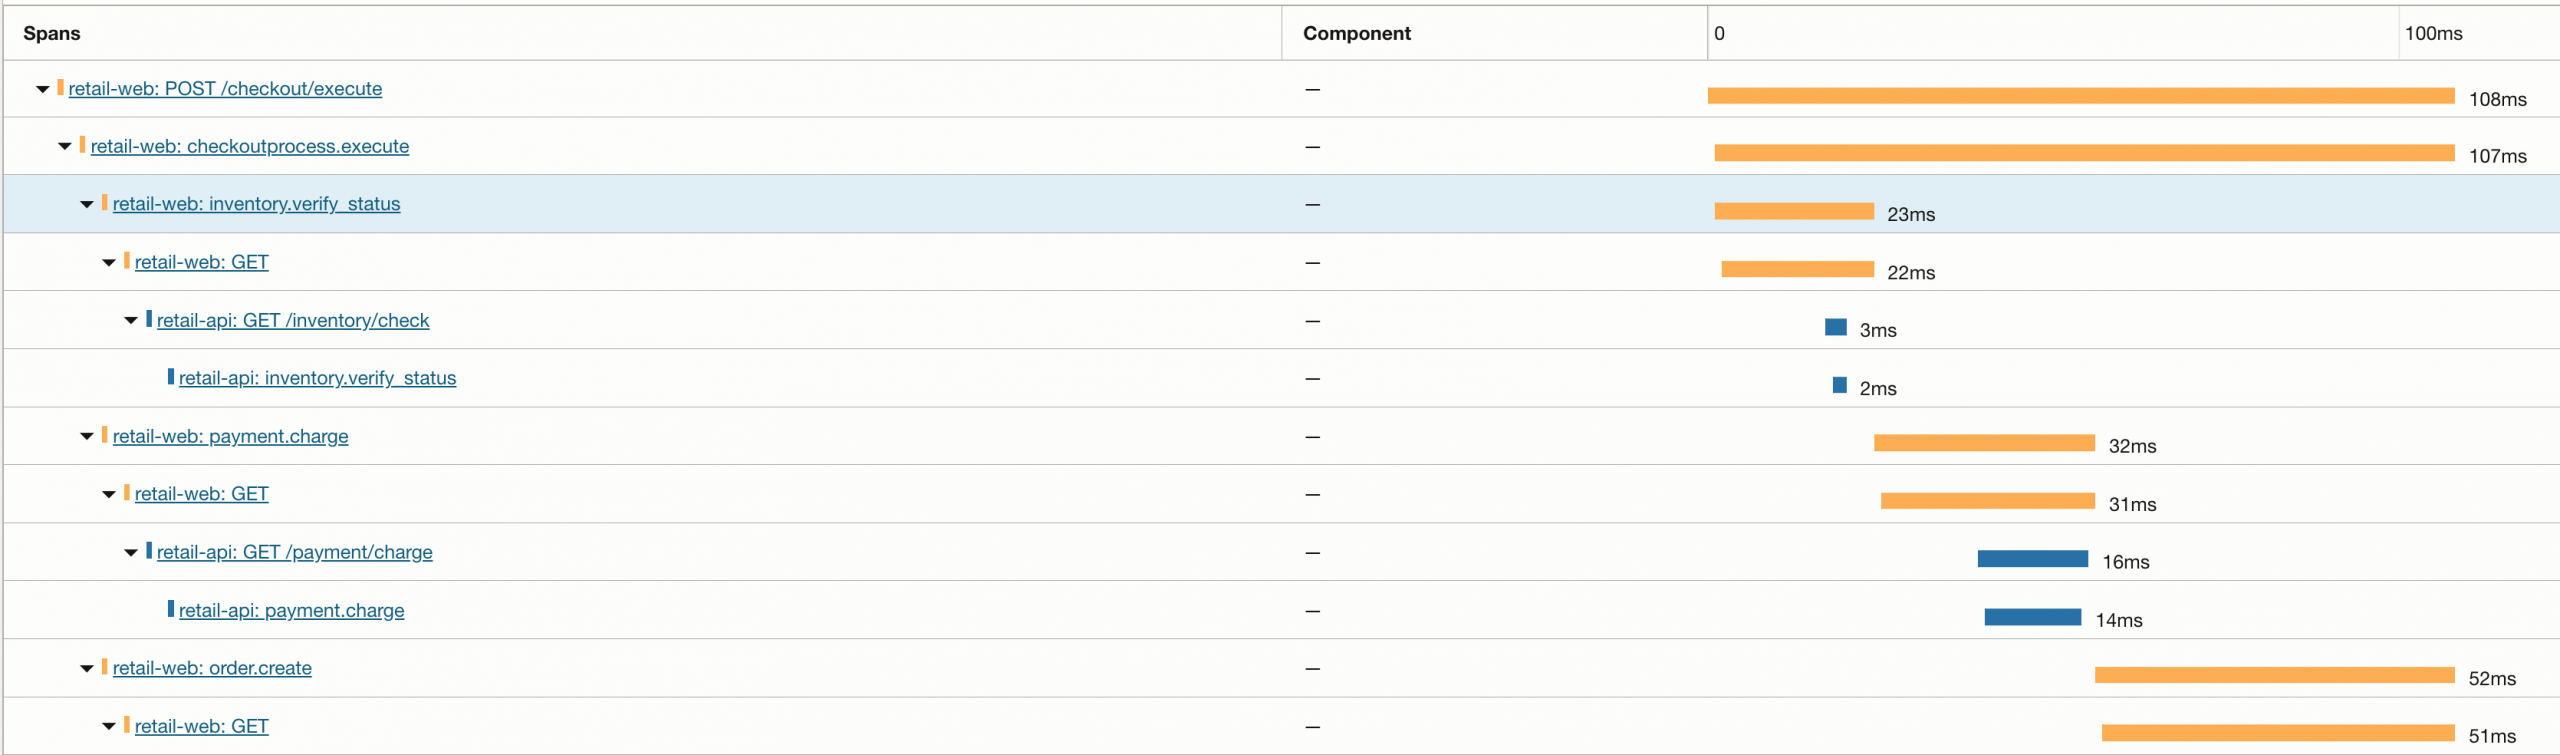
This gives you an end-to-end trace that’s easy to interpret in business terms, while still retaining the detailed dependency timing provided by programmatic instrumentation.
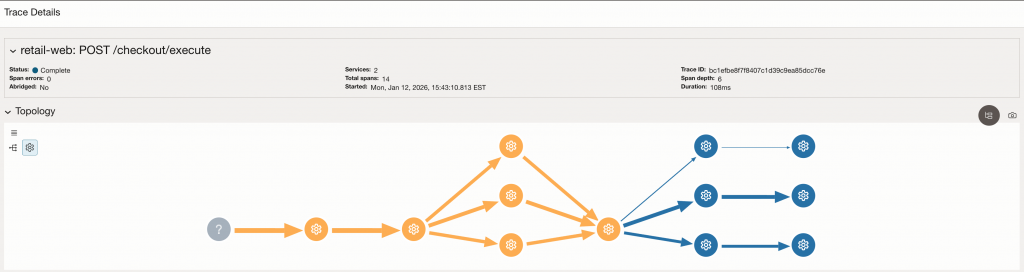
Manual business spans layered on top of programmatic instrumentation.
The checkout workflow span (checkoutprocess.execute) groups business stages (inventory.verify_status, payment.charge, order.create). Each stage contains automatically generated HTTP client spans and downstream service spans from retail-api, creating a complete end-to-end trace across services.
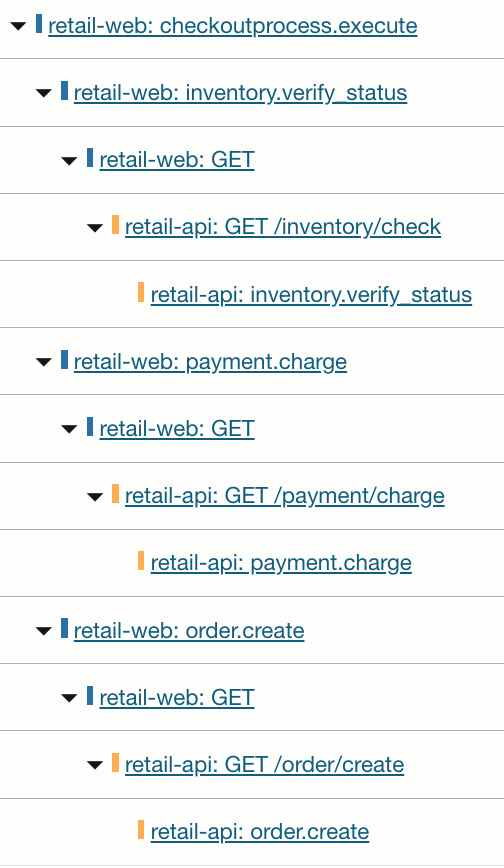
Notice how each business stage in retail-web fans out into downstream HTTP calls and backend processing in retail-api. This is the core value of combining manual and programmatic instrumentation: business logic remains readable, while dependency details remain visible without extra code.
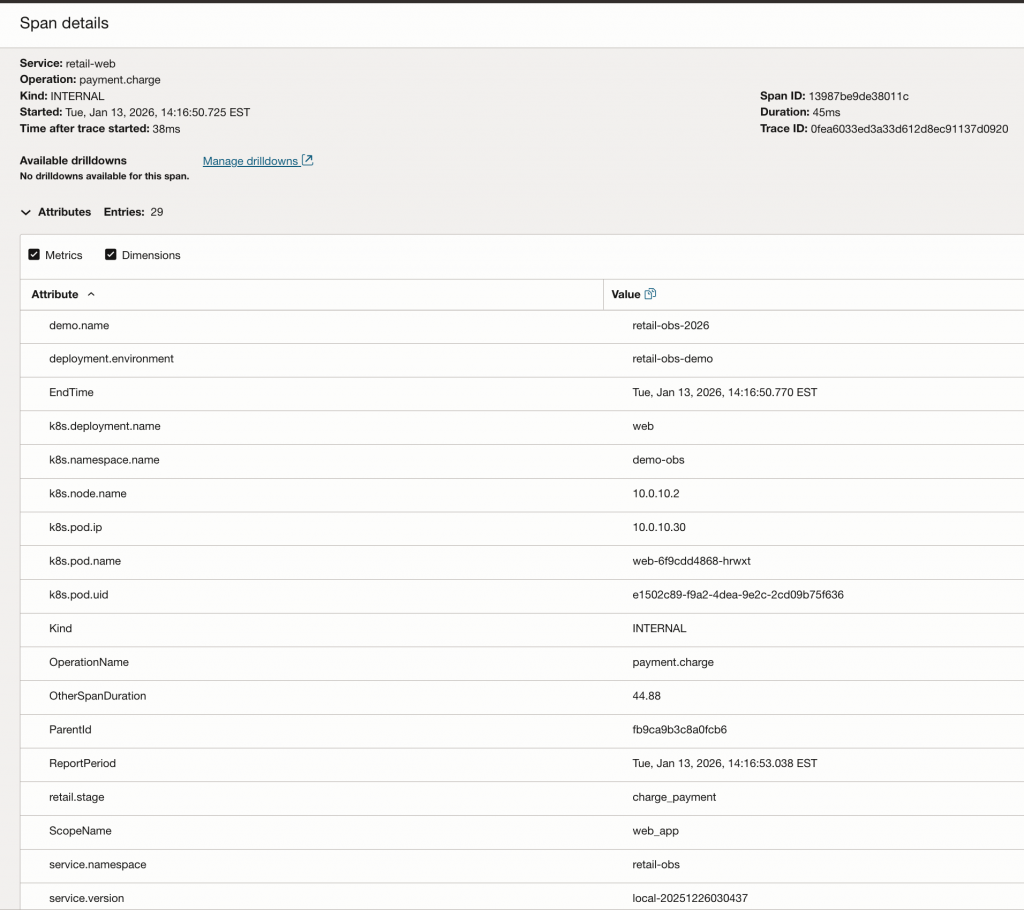
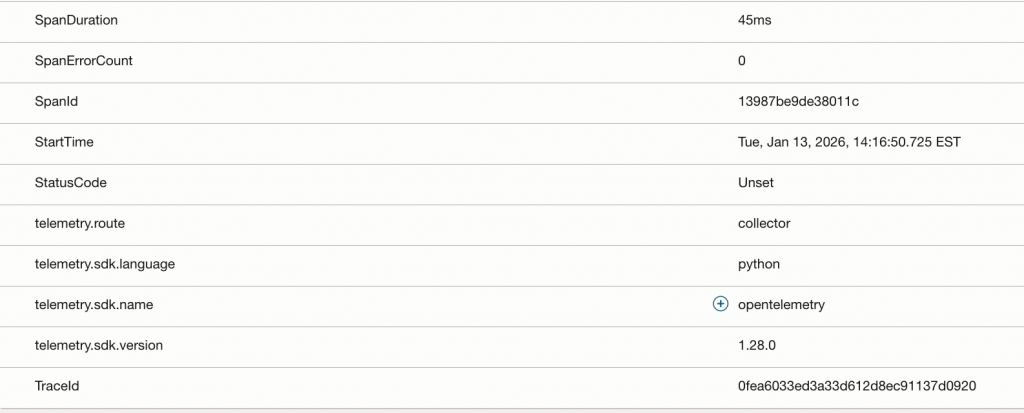
Inspecting a Manual Span in OCI APM
The Span Detail view in OCI Application Performance Monitoring (APM) reveals the rich metadata context we’ve engineered into our spans. Notice how business-level attributes like retail.stage: charge_payment (from manual instrumentation) sit alongside infrastructure metadata like k8s.pod.name and k8s.deployment.name (enriched by the OTel Collector). This convergence allows a developer to immediately see not just what failed, but exactly where it was running in the Kubernetes cluster at that moment.
Conclusion
In the first part of this series, we moved from the theory of intentional observability to a practical, end-to-end implementation on Oracle Cloud Infrastructure. By instrumenting a microservices-based retail application with OpenTelemetry, we’ve successfully bridged the gap between raw framework events and meaningful business logic.
Through the combination of programmatic and manual instrumentation, your checkout requests are no longer a black box; they are now rich, searchable traces in OCI Application Performance Monitoring. You now have the foundational visibility needed to pinpoint exactly where latency occurs—whether it’s in a specific Kubernetes cluster pod or a downstream database query.
What’s Next?
While application-level tracing provides the “what” and “where” of a request, understanding the “why” often requires looking deeper into the underlying infrastructure and the processes that deployed it. In Part 2, we will expand our observability strategy to include Kubernetes Observability.