Introduction
Welcome to Part 3 of our blog series, where we move beyond simply collecting Fusion Applications audit logs and start putting them to use for practical, real-world monitoring of your organization’s Fusion security and operational health.
After setting up Fusion Applications audit logs ingestion in OCI Log Analytics (Parts 1 and 2), organizations need to transform raw log data into actionable insights. This blog post demonstrates how to leverage OCI Log Analytics dashboards and LoganAI to gain comprehensive visibility into Fusion Applications ESS jobs, security events, and audit activities. We’ll explore dashboard visualizations, compare Fusion native interfaces with OCI Log Analytics capabilities, and showcase AI-powered analysis for proactive monitoring and threat detection.
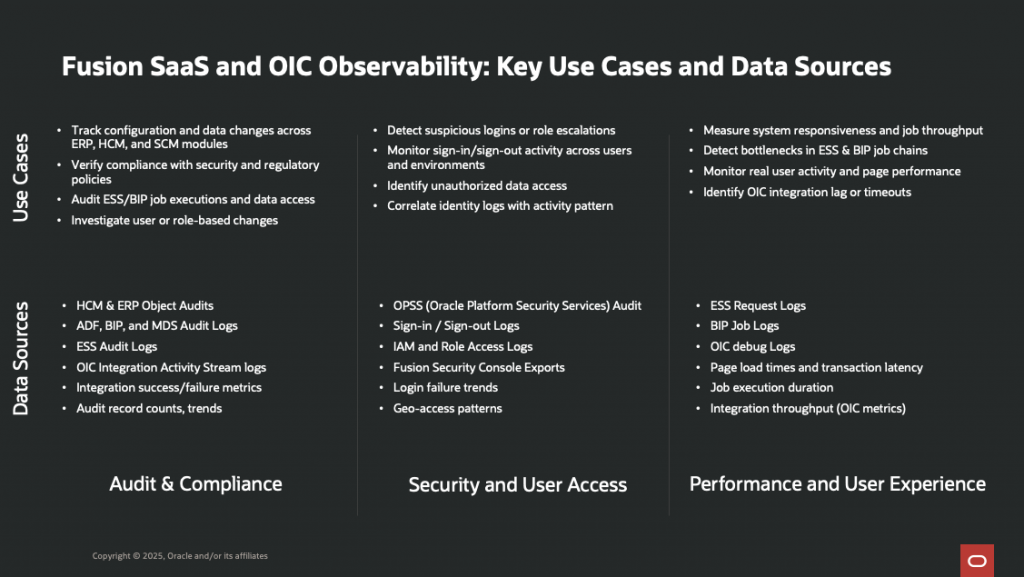
Fusion Audit Log Key Use Cases Overview:
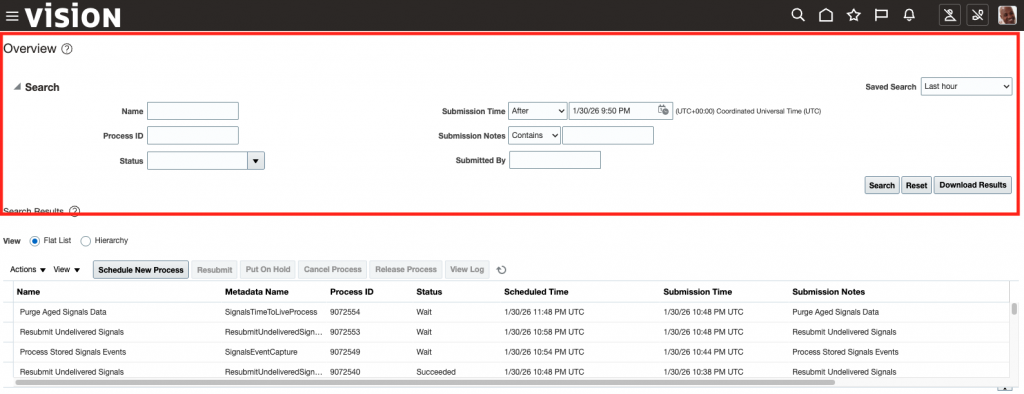
While Oracle Fusion offers basic native tools for tracking scheduled jobs and audit events, those interfaces are often limited: you might find it hard to review historical trends, correlate security activities across modules, or customize dashboards for stakeholders. Most importantly, as your monitoring needs evolve, you will need deeper analytics and a more proactive approach.
Historically, to answer critical questions like below, organizations have developed a set of dashboards and reports, set up rule-based alerts, and sifted through log records to identify patterns.
- What patterns do you see in off-hours logins?
- Which users have logged in from geographically distant locations in the past 24 hours?
- Show me users with unusual login patterns that might indicate compromised accounts
- Are there patterns in job delays or recurring errors across modules?
- What ESS jobs are failing most frequently, and why?
- Identify any unusual patterns in ESS job execution that might indicate performance degradation
- Which ESS jobs are at risk of failure based on recent trends?
- What is causing ESS job performance degradation in the CRM module?
At Oracle, we have collective knowledge domain expertise in Fusion Applications and OCI Log Analytics, and we have developed a set of dashboards and reports that provide a comprehensive view of Fusion Applications audit logs and security events. We have published these dashboards as out-of-the-box in the Log Analytics Dashboards section, or you can find more technical content in the Oracle o11y solutions GitHub repository.
- Oracle Fusion Apps ESS Analysis: Provides a comprehensive view of Enterprise Scheduler Service (ESS) job execution status, including total jobs run, success and failure rates, historical trends, and quick identification of failed or delayed jobs.
- Oracle Fusion Apps User Access Analysis: Offers in-depth insight into Fusion user access events, including login/logout activity, unique user counts, client locations, failed login attempts, and suspicious sign-in/out patterns across modules.
- Oracle Fusion Apps OPSS Audit Analysis: Focuses on OPSS (Oracle Platform Security Services) audit events, surfacing privileged account use, policy changes, and security-related configuration activity for compliance and incident investigation.
- Oracle Fusion Apps SOA: Tracks key SOA (Service-Oriented Architecture) process activity, identifying integration errors, process execution status, and bottlenecks in connected systems.
- Oracle Fusion Apps Data Service (MDS) Unified: Unifies visibility into Fusion Metadata Services (MDS) activities, surfacing configuration changes and important metadata management events across modules.
- Oracle Human Capital Management Business Objects: Monitors critical transactions and access patterns related to HCM business objects, including changes, workflows, and sensitive personnel data activity.
- Oracle Fusion Apps OIC Process Monitoring: Monitors Oracle Integration Cloud (OIC) process executions, integration flows, and failures relevant to Fusion Apps, providing operational assurance for cloud-based integrations.
Understanding the Oracle Fusion Apps Enterprise Scheduler Service (ESS) Analysis Dashboard
The ESS Analysis Dashboard is a comprehensive view of ESS job execution status that provides proactive monitoring and rapid troubleshooting capabilities. It aggregates ESS audit log data ingested via the Management Agent REST API source (configured in Part 2) and presents it through multiple visualization widgets. The following screenshot shows the ESS Analysis Dashboard:
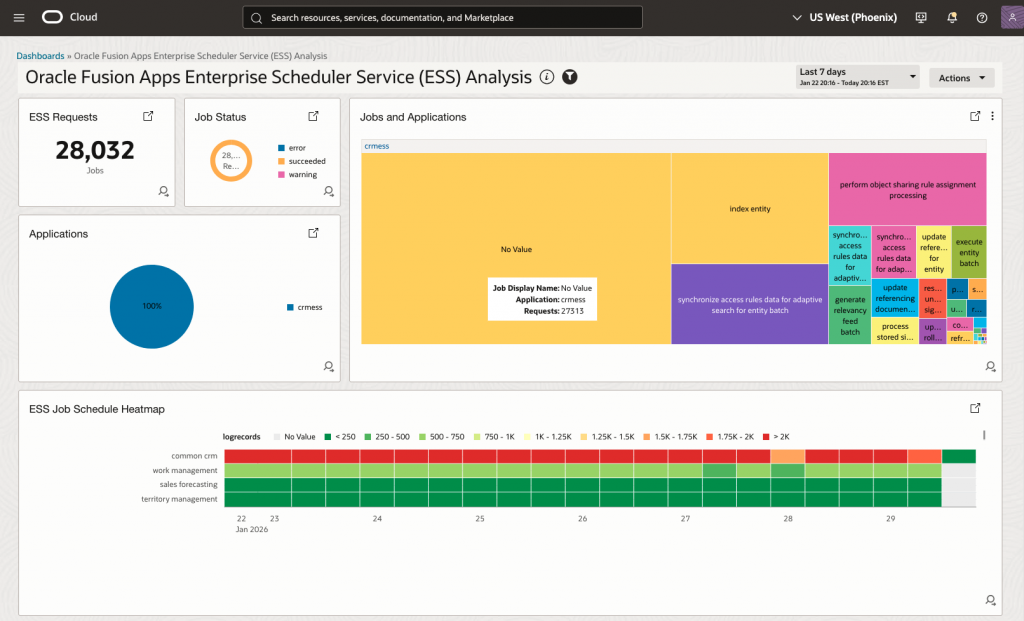
Each widget serves a specific monitoring purpose:
- Real-time Job Status Monitoring: Instantly see the overall health of ESS jobs, including total jobs, success rates, and failures, without digging into each job.
- Historical Trend Analysis: View long-term trends and patterns in job performance to spot slowdowns or recurring issues over time.
- Cross-Module Job Correlation: See ESS job data from all Fusion modules together, making it easy to identify problems that span multiple modules.
- Performance Degradation Detection: Quickly find jobs that are running slower than usual so you can fix problems before failures occur.
- Schedule Optimization Insights: Use heatmaps to spot busy periods and scheduling conflicts, so you can better plan and spread out job workloads.
The ESS Analysis Dashboard provides several key advantages for day-to-day operations:
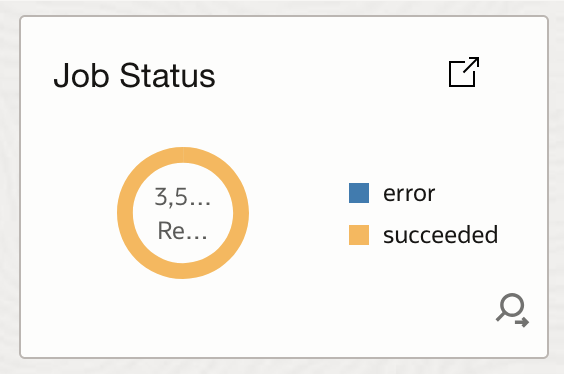
- At-a-Glance Health Monitoring: Administrators can quickly assess overall ESS job health for a period of time without navigating through multiple Fusion screens or manually aggregating data. The dashboard’s summary widgets (counters, donut charts, status distributions) provide immediate visibility into job execution status.
'Log Source' = 'Oracle Fusion Apps: Enterprise Scheduler Service' | stats distinctcount('Request ID') as Requests by 'State Description'
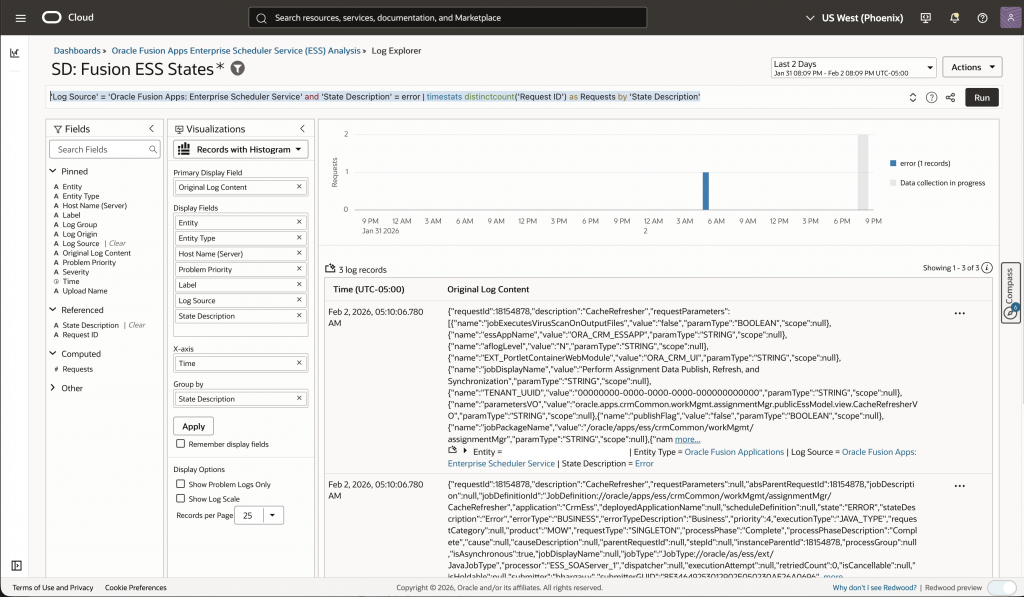
- Rapid Failure Identification: By clicking the number of failed jobs, the log explorer will open another tab with the failed jobs details and the corresponding query. The query is as follows:
'Log Source' = 'Oracle Fusion Apps: Enterprise Scheduler Service' and 'State Description' = error | timestats distinctcount('Request ID') as Requests by 'State Description'
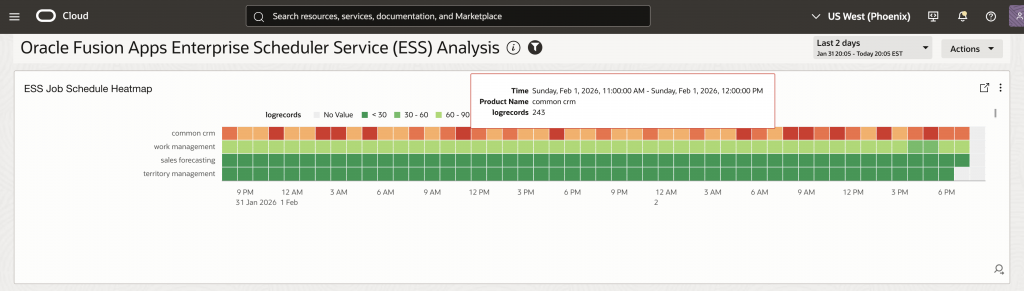
- Schedule Conflict Prevention: The ESS Job Schedule Heatmap (Widget 5) visualizes execution patterns across time periods, helping administrators identify and resolve scheduling conflicts before they impact job execution.
'Log Source' = 'Oracle Fusion Apps: Enterprise Scheduler Service' | stats distinctcount('Request ID') as Requests by hour('Start Time')
- Performance Trend Awareness: Historical trend analysis helps administrators identify jobs that are gradually slowing down, allowing proactive optimization before failures occur. Widgets like “ESS Job Execution Duration Analysis” (Widget 4) and “Jobs with Execution Time Degradation” (Widget 7) surface these trends automatically.
'Log Source' = 'Oracle Fusion Apps: Enterprise Scheduler Service' | timestats avg(ElapsedTime) as 'Avg Duration', max(ElapsedTime) as 'Max Duration' by 'Job Display Name'
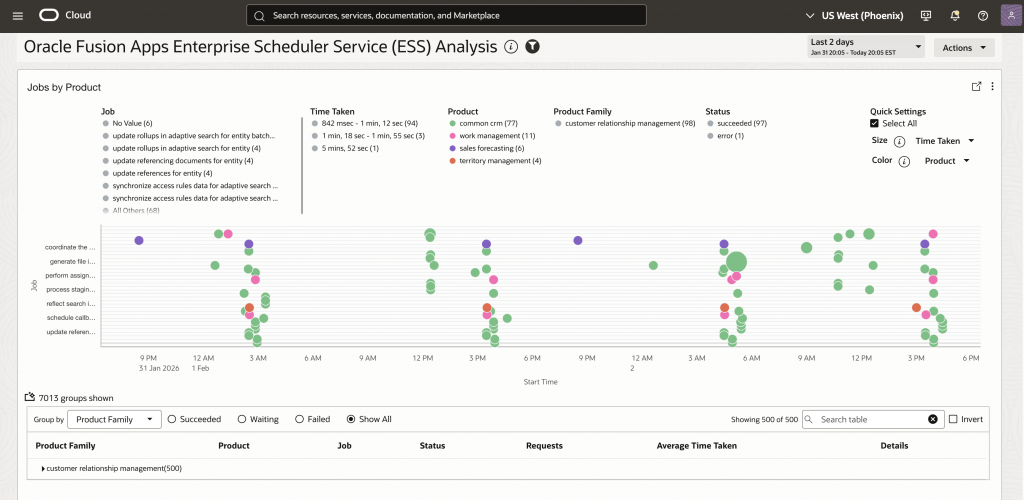
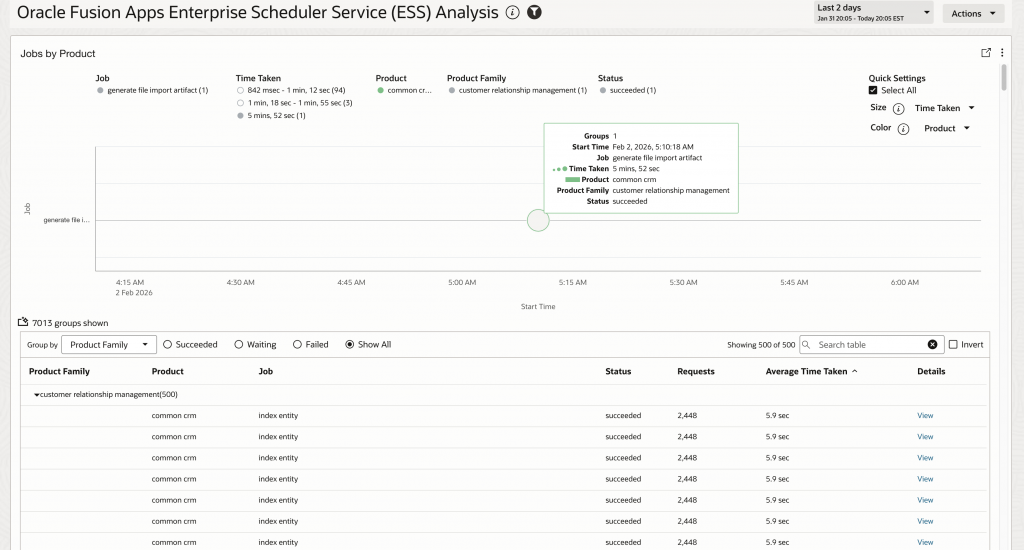
- Cross-Module Impact Assessment: When investigating job failures or performance issues, administrators can quickly see which Fusion modules are affected and correlate issues across different application areas. This unified view is essential for understanding the broader impact of ESS job problems.
'Log Source' = 'Oracle Fusion Apps: Enterprise Scheduler Service' | stats distinctcount('Request ID') as Requests, avg(ElapsedTime) as 'Avg Duration' by 'Product Family'
Understanding the Oracle Fusion Apps User Access Analysis Dashboard
The User Access Analysis Dashboard is a comprehensive view of Fusion user access events that provides proactive monitoring and rapid troubleshooting capabilities. It aggregates Fusion user access audit log data ingested via the Management Agent REST API source (configured in Part 2) and presents it through multiple visualization widgets.
Note: Sign-in/Sign-out REST API is deprecated and no longer available after Fusion Identity Upgrade, starting Oracle Fusion 25B or higher. You will have to use the OCI Audit Logs as per KB181606. Please refer to Identity Upgrade Overview.
The following screenshot shows the User Access Analysis Dashboard:
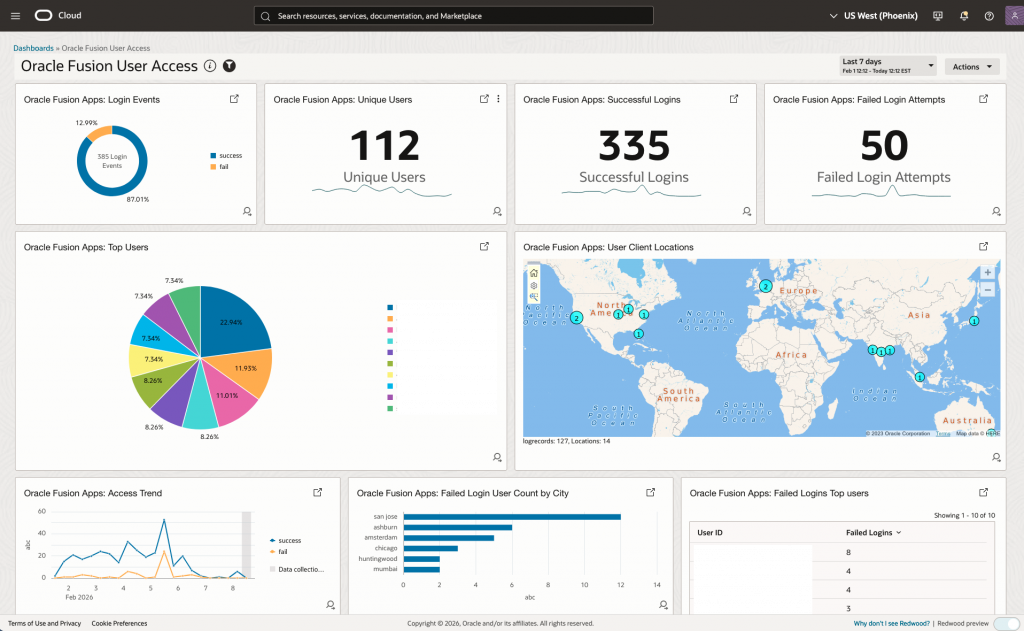
Each widget serves a specific monitoring purpose:
- Real-time Login Activity Monitoring: Instantly see the overall health of Fusion user access, including total login events, success and failure rates, without digging into each login event.
- Historical Trend Analysis: View long-term trends and patterns in login activity to spot slowdowns or recurring issues over time.
- Cross-Module Login Correlation: See Fusion user access data from all Fusion modules together, making it easy to identify problems that span multiple modules.
- Geographic Anomaly Detection: Identify unusual geographic access patterns that may indicate account compromise or unauthorized access.
- Failed Login Analysis: Track and analyze failed login attempts to identify potential security threats and brute-force attacks.
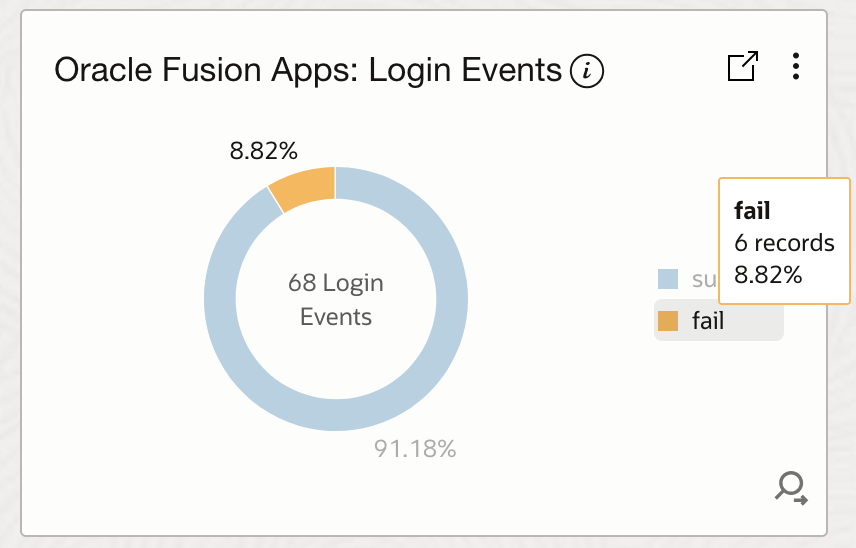
- Fusion User Access Login Events Analysis: This widget displays login event counts by status (Success, Failed), providing an overview of authentication activity and helping identify authentication failures that may indicate security threats.
'Log Source' = 'Fusion Apps: Sign In - Sign Out Activity Logs' and 'User ID' != rats_monitor and 'User ID' != fusion_apps_osn_integ_appid | stats count as 'Login Events ' by Status | sort -Status
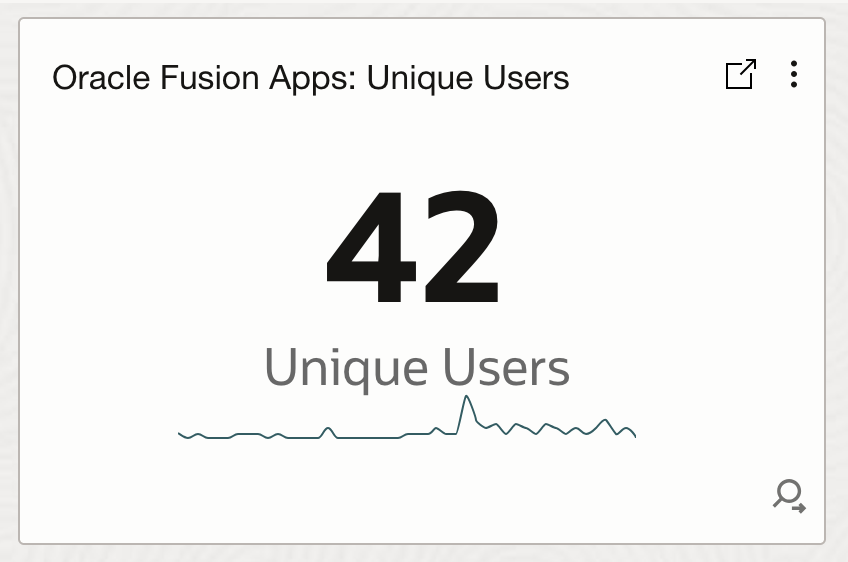
- Fusion User Access Unique Users Analysis: This widget tracks the number of unique users accessing Fusion Applications over time, enabling administrators to monitor user activity trends and detect unusual spikes or drops in user engagement.
'Log Source' = 'Fusion Apps: Sign In - Sign Out Activity Logs' and 'User ID' != rats_monitor and 'User ID' != fusion_apps_osn_integ_appid | stats distinctcount('User ID') as 'Unique Users', trend(distinctcount('User ID'))
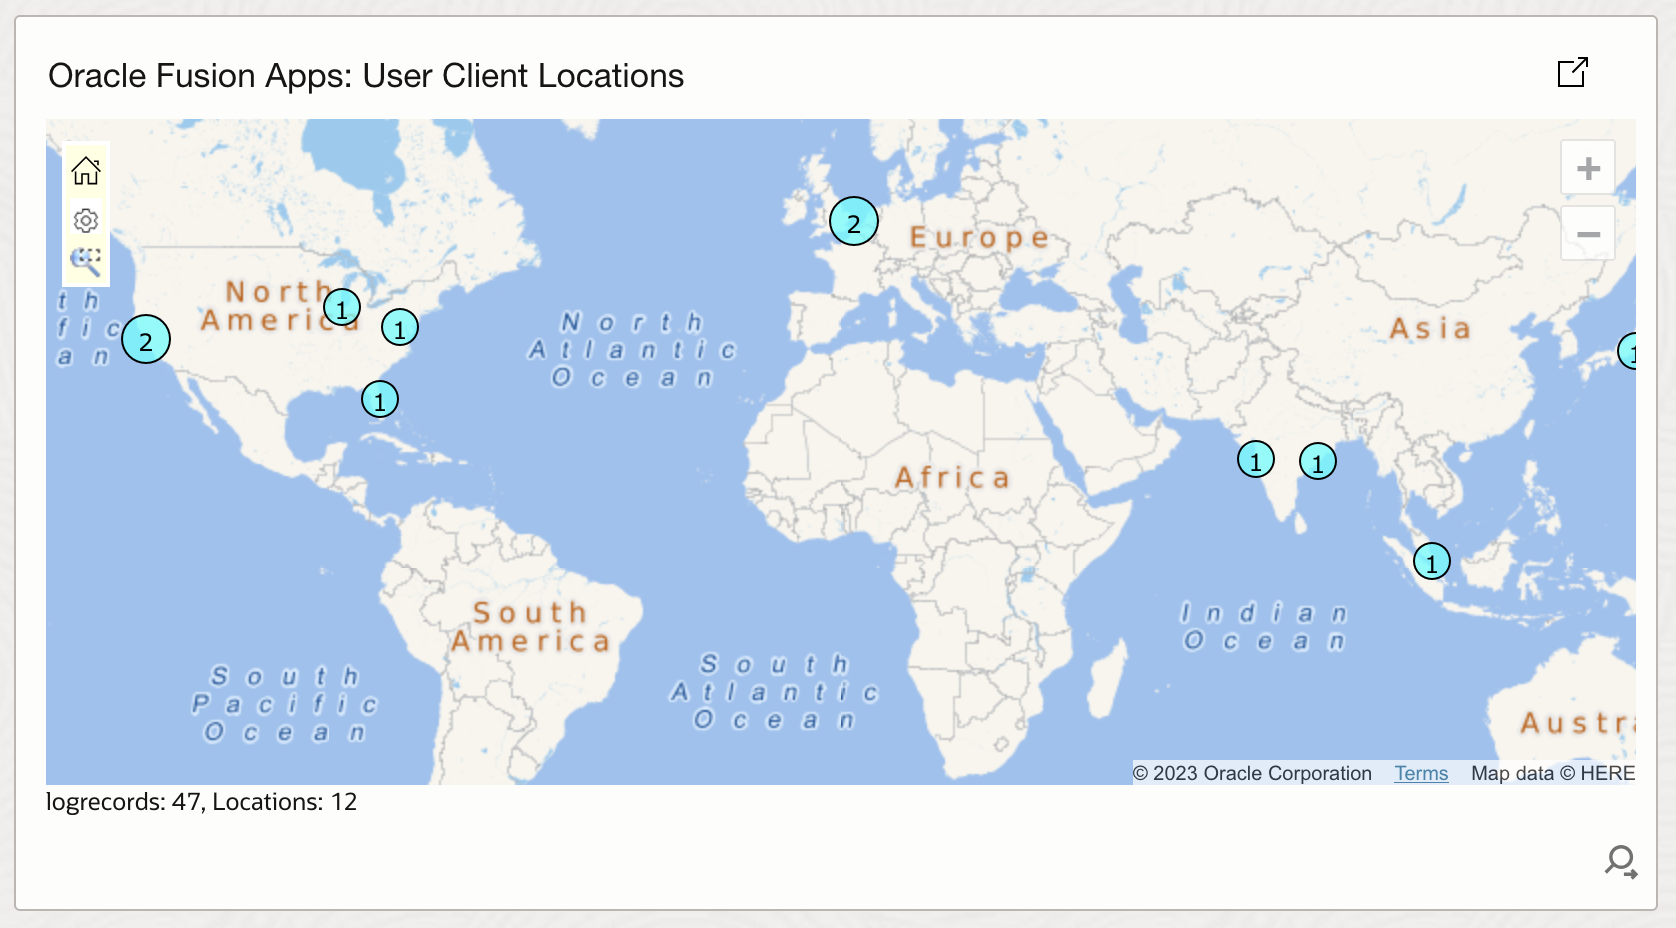
- Fusion User Access Geographic Client Locations Analysis: This widget visualizes user access by geographic location on a world map, helping identify impossible travel scenarios and unusual geographic access patterns that may indicate account compromise or unauthorized access.
<copy> 'Log Source' = 'Fusion Apps: Sign In - Sign Out Activity Logs' and 'User ID' != rats_monitor and 'User ID' != fusion_apps_osn_integ_appid | stats distinctcount('User ID') as 'Unique Users' by 'Client Host Country', 'Client Host City'
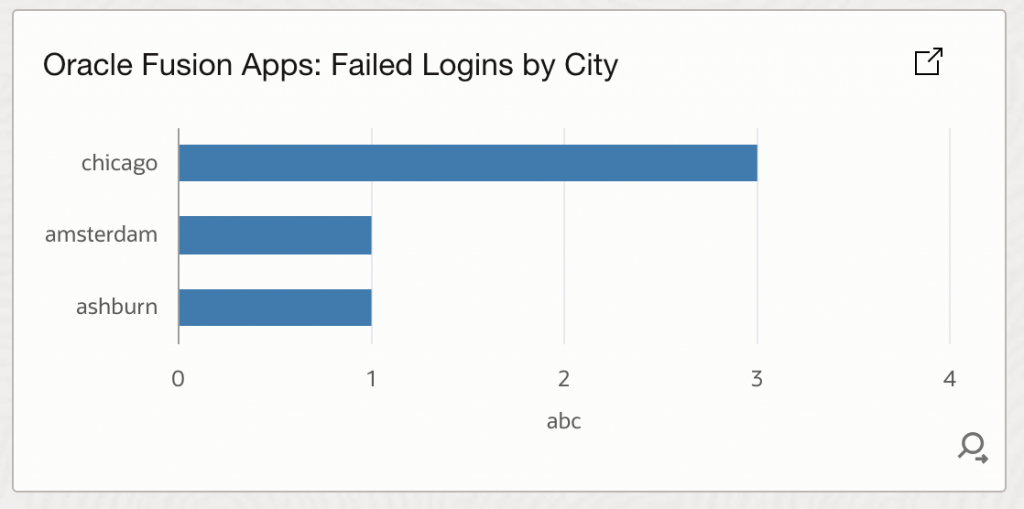
- Fusion Apps: Failed Login User by City: This widget shows failed login attempts grouped by city, helping identify geographic hotspots for authentication failures that may indicate brute-force attacks or compromised credentials.
'Log Source' = 'Fusion Apps: Sign In - Sign Out Activity Logs' and 'User ID' != rats_monitor and 'User ID' != fusion_apps_osn_integ_appid and 'Status' = 'Failed' | stats count as FailedLoginCount by 'Client Host City'
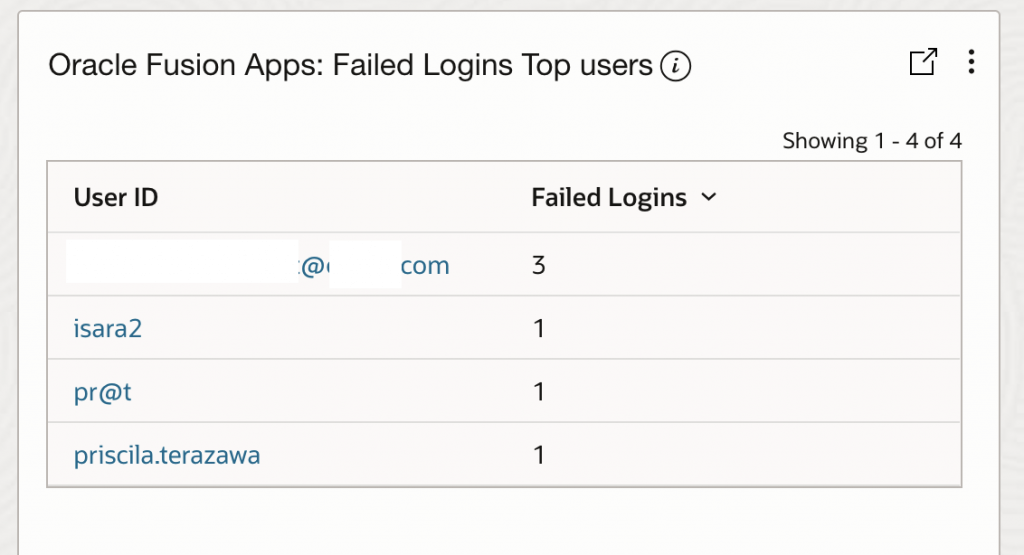
- Fusion Apps: Failed Login Top Users: This widget identifies users with the highest number of failed login attempts, helping prioritize investigation of potentially compromised accounts or brute-force attack targets.
'Log Source' = 'Fusion Apps: Sign In - Sign Out Activity Logs' and 'User ID' != rats_monitor and 'User ID' != fusion_apps_osn_integ_appid and 'Status' = 'Failed' | stats count as FailedLoginCount by 'User Name'
- Fusion Apps: Failed Login multi-dimensional Analysis: This widget provides a multi-dimensional view of failed logins by country and city, enabling correlation analysis to identify coordinated attacks across geographic regions.
'Log Source' = 'Fusion Apps: Sign In - Sign Out Activity Logs' and 'User ID' != rats_monitor and 'User ID' != fusion_apps_osn_integ_appid and 'Status' = 'Failed' | stats count as FailedLoginCount by 'Client Host Country', 'Client Host City'
Enriching Fusion Log Analytics with GenAI-Powered Insights
With the introduction of the GenAI-powered LoganAI feature in Log Analytics, this process is dramatically enhanced. Now, administrators and security teams can simply ask their questions in plain language—LoganAI automatically leverages the underlying log data as context for the large language model (LLM). This means you can get clear, actionable answers to complex operational and security queries in real time, without manually writing queries or manually preparing the data. By leveraging LoganAI’s GenAI capabilities, you move from static metrics to dynamic, AI-driven observability—enabling faster, deeper insights into both ESS job processing and Fusion user access, all by simply providing your logs as context to the LLM.
This section showcases how LoganAI elevates Fusion operational and security monitoring with GenAI-powered, context-aware intelligence and a conversational approach, making advanced log analytics accessible and actionable for everyone.
Prerequisite: Enabling LoganAI for AI-Powered Analysis
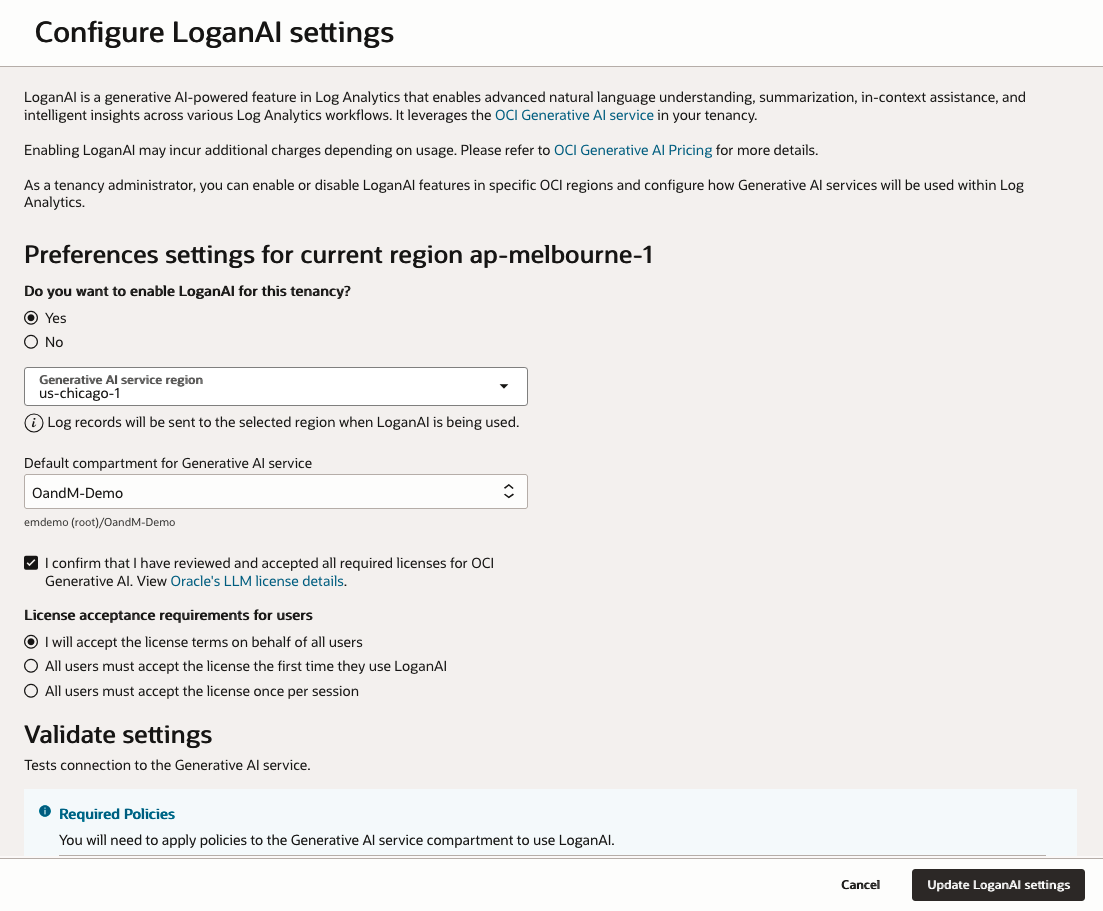
LoganAI is a generative AI-powered feature in Log Analytics that enables advanced natural language understanding, summarization, in-context assistance, and intelligent insights across various Log Analytics workflows. It leverages the OCI Generative AI service in your tenancy. Enabling LoganAI may incur additional charges depending on usage. Please refer to OCI Generative AI Pricing for more details. As a tenancy administrator, you can enable or disable LoganAI features in specific OCI regions and configure how Generative AI services will be used within Log Analytics.
That’s where OCI Log Analytics and AI-based augmentation (with LoganAI) make a significant difference. With these tools, you can:
- Visualize and monitor ESS job health, failures, and performance in dynamic dashboards.
- Detect security threats as they emerge, leveraging both built-in analytics and customizable real-time alerts.
- Unlock long-term and cross-module visibility for audit logs and security events—far beyond the short history available in native Fusion screens.
- Take advantage of AI-powered features such as natural language queries and anomaly detection to find patterns or issues you might otherwise miss.
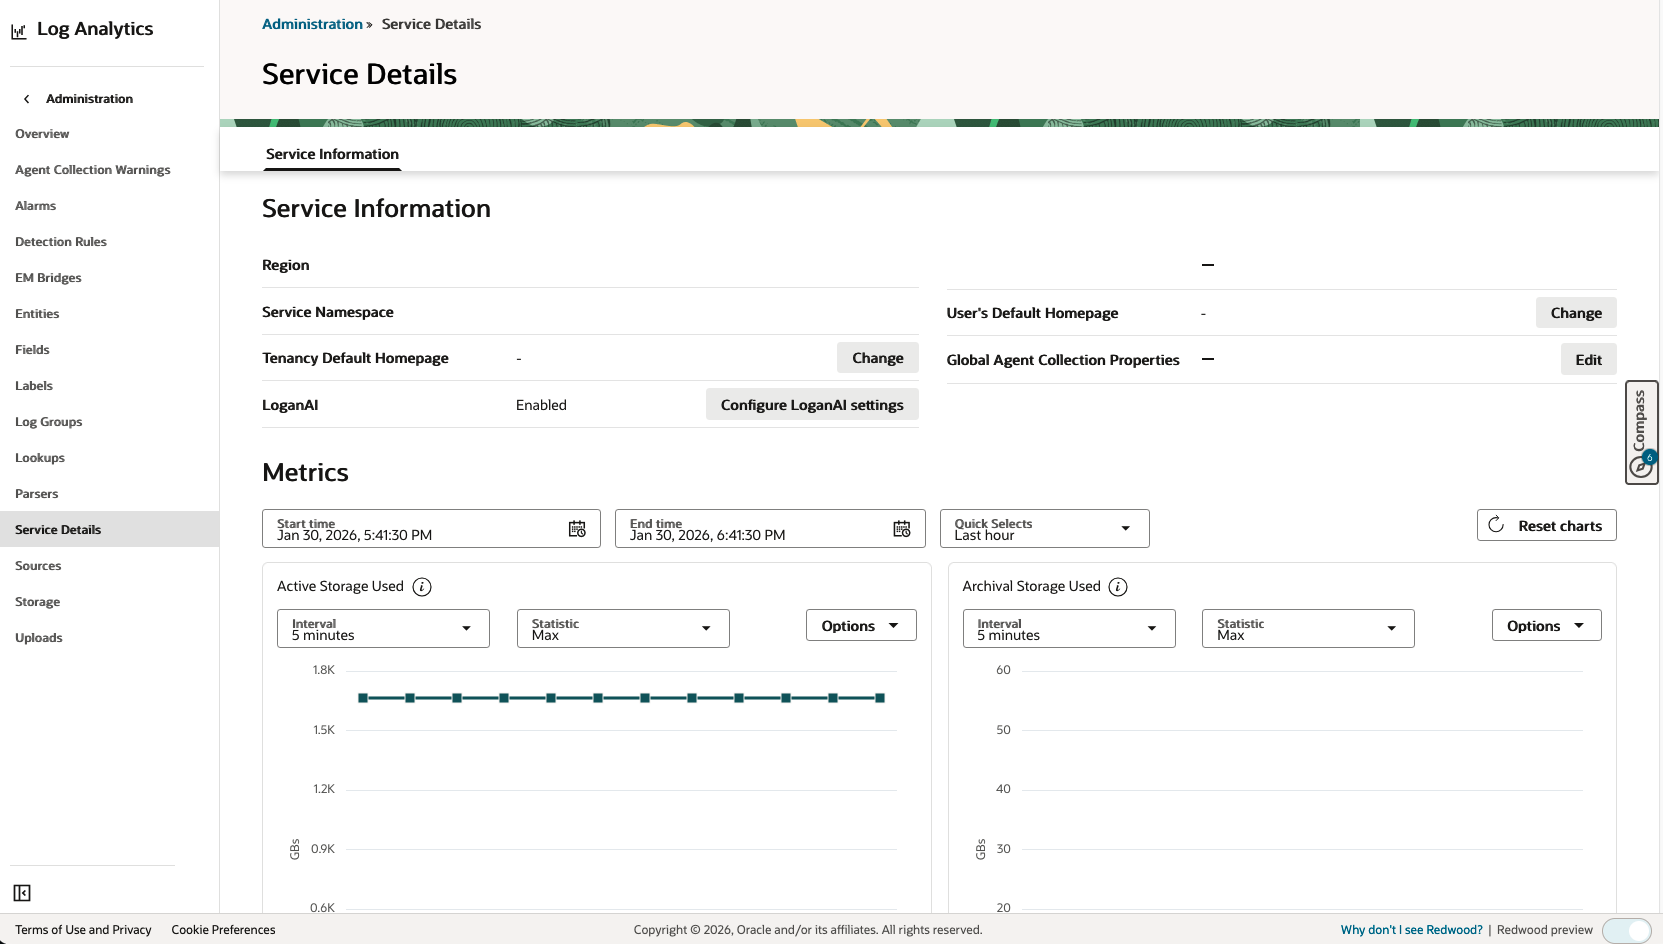
Step 1: Enable LoganAI
- Navigate to Log Analytics Administration:
- Go to OCI Console > Observability & Management > Log Analytics
- Click Administration in the left navigation menu
- Click Service Details in the left navigation menu
- Click Configure LoganAI Settings in Logan AI section
- Update the Preference settings for current region
- Confirm the setting to Enable LoganAI for the tenancy
- Confirm the Oracle LLM license details
- Select License acceptance requirements for users
- Add the required policies in IAM Policies section
allow group Log-Analytics-Users to use generative-ai-chat in compartment id ocid1.compartment.oc1..aaaaaaaawaaaaaaaaaaazma allow group Log-Analytics-Users to read generative-ai-model in compartment id ocid1.compartment.oc1..aaaaaaaawaaaaaaaaaaazma allow group Log-Analytics-Users to read generative-ai-endpoint in compartment id ocid1.compartment.oc1..aaaaaaaawaaaaaaaaaaazma- Click Update LoganAI Settings to save the changes
Step 2: Using LoganAI in Log Explorer
Once enabled, LoganAI is available throughout Log Explorer. The Explain feature uses artificial intelligence to summarize log messages and charts, transforming complex log data into actionable insights. To access LoganAI Explain, click the AI icon ![]() wherever it appears throughout Log Explorer. The AI icon is available in various visualizations that present log records. LoganAI Explain can be utilized in the following ways:
wherever it appears throughout Log Explorer. The AI icon is available in various visualizations that present log records. LoganAI Explain can be utilized in the following ways:
LoganAI Explain Use Cases
Single Log Explain: Click the AI icon next to any log record to instantly receive a concise summary of that entry. Ask follow-up questions or review conversation history for deeper insights—ideal for quickly understanding errors or suspicious events.
Multi-log Explain: Summarize and analyze multiple log entries at once by clicking the AI icon above the log records. LoganAI automatically highlights key patterns and anomalies across your selection, helping you spot trends or root causes without manual review.
Cluster Explain: Use Cluster Explain to review large volumes of similar logs. With one click, AI summarizes patterns, outliers, and potential issues within log clusters—supporting rapid identification of systemic problems or anomalies in operational data.
Chart Explain: In Link chart visualizations, click the AI icon below the chart to get an AI-generated summary of key patterns, trends, and anomalies. You can target specific data subsets by selecting chart bubbles for focused analysis.
For more details, visit the Oracle Log Analytics documentation.
Let’s see the LoganAI Explain in action with sample queries:
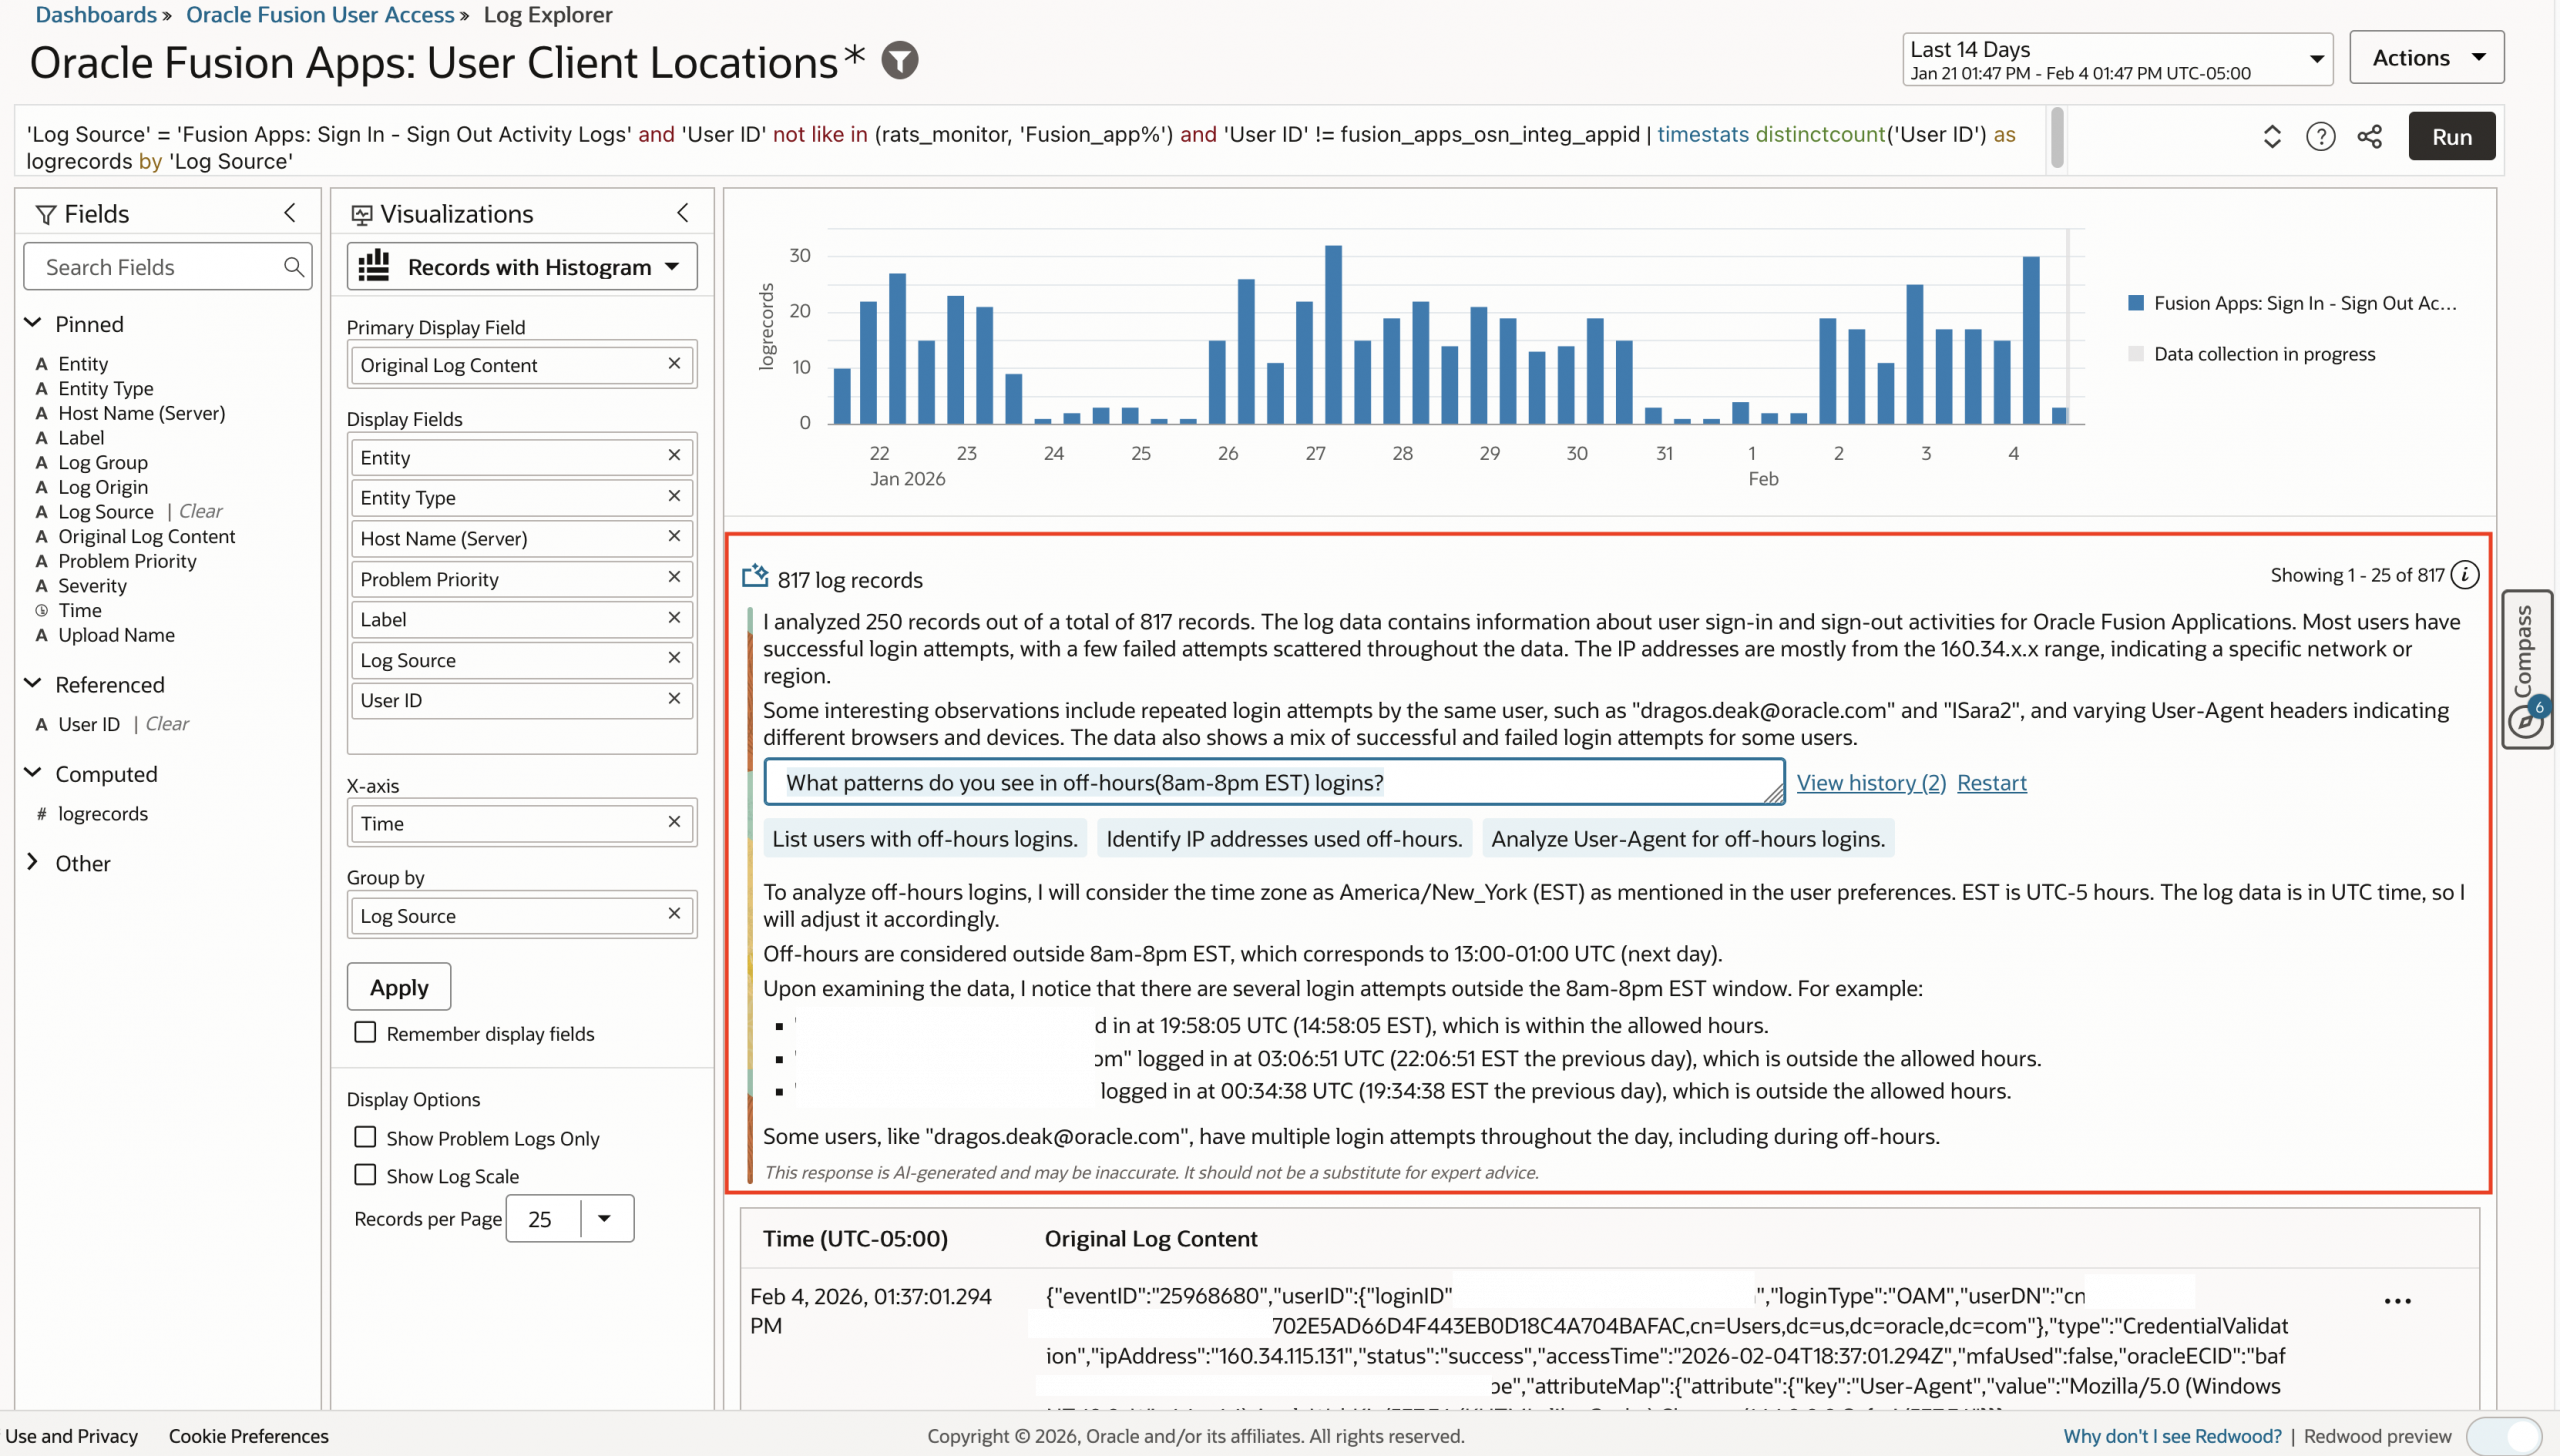
- LoganAI Cluster Explain Insights: What patterns do you see in off-hours (8am-8pm EST) logins?
- Query: ‘Log Source’ = ‘Fusion Apps: Sign In – Sign Out Activity Logs’ and ‘User ID’ not like in (rats_monitor, ‘Fusion_app%’) and ‘User ID’ != fusion_apps_osn_integ_appid | timestats distinctcount(‘User ID’) as logrecords by ‘Log Source’
- LoganAI explain:
- Visualization: Records with Histogram
- Time Range: Last 14 days
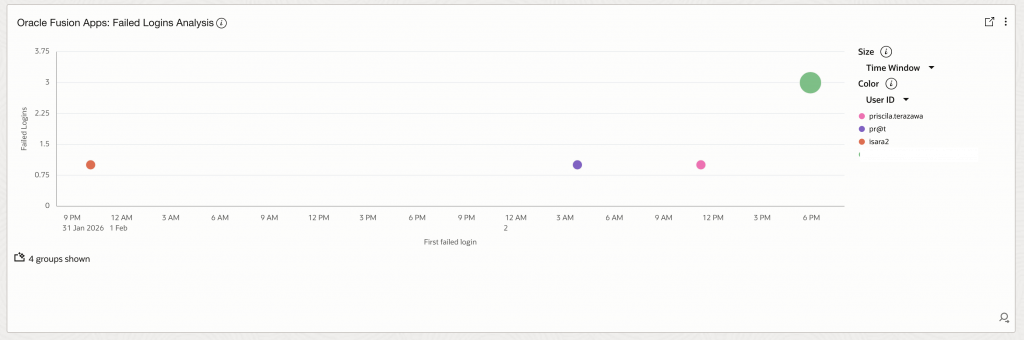
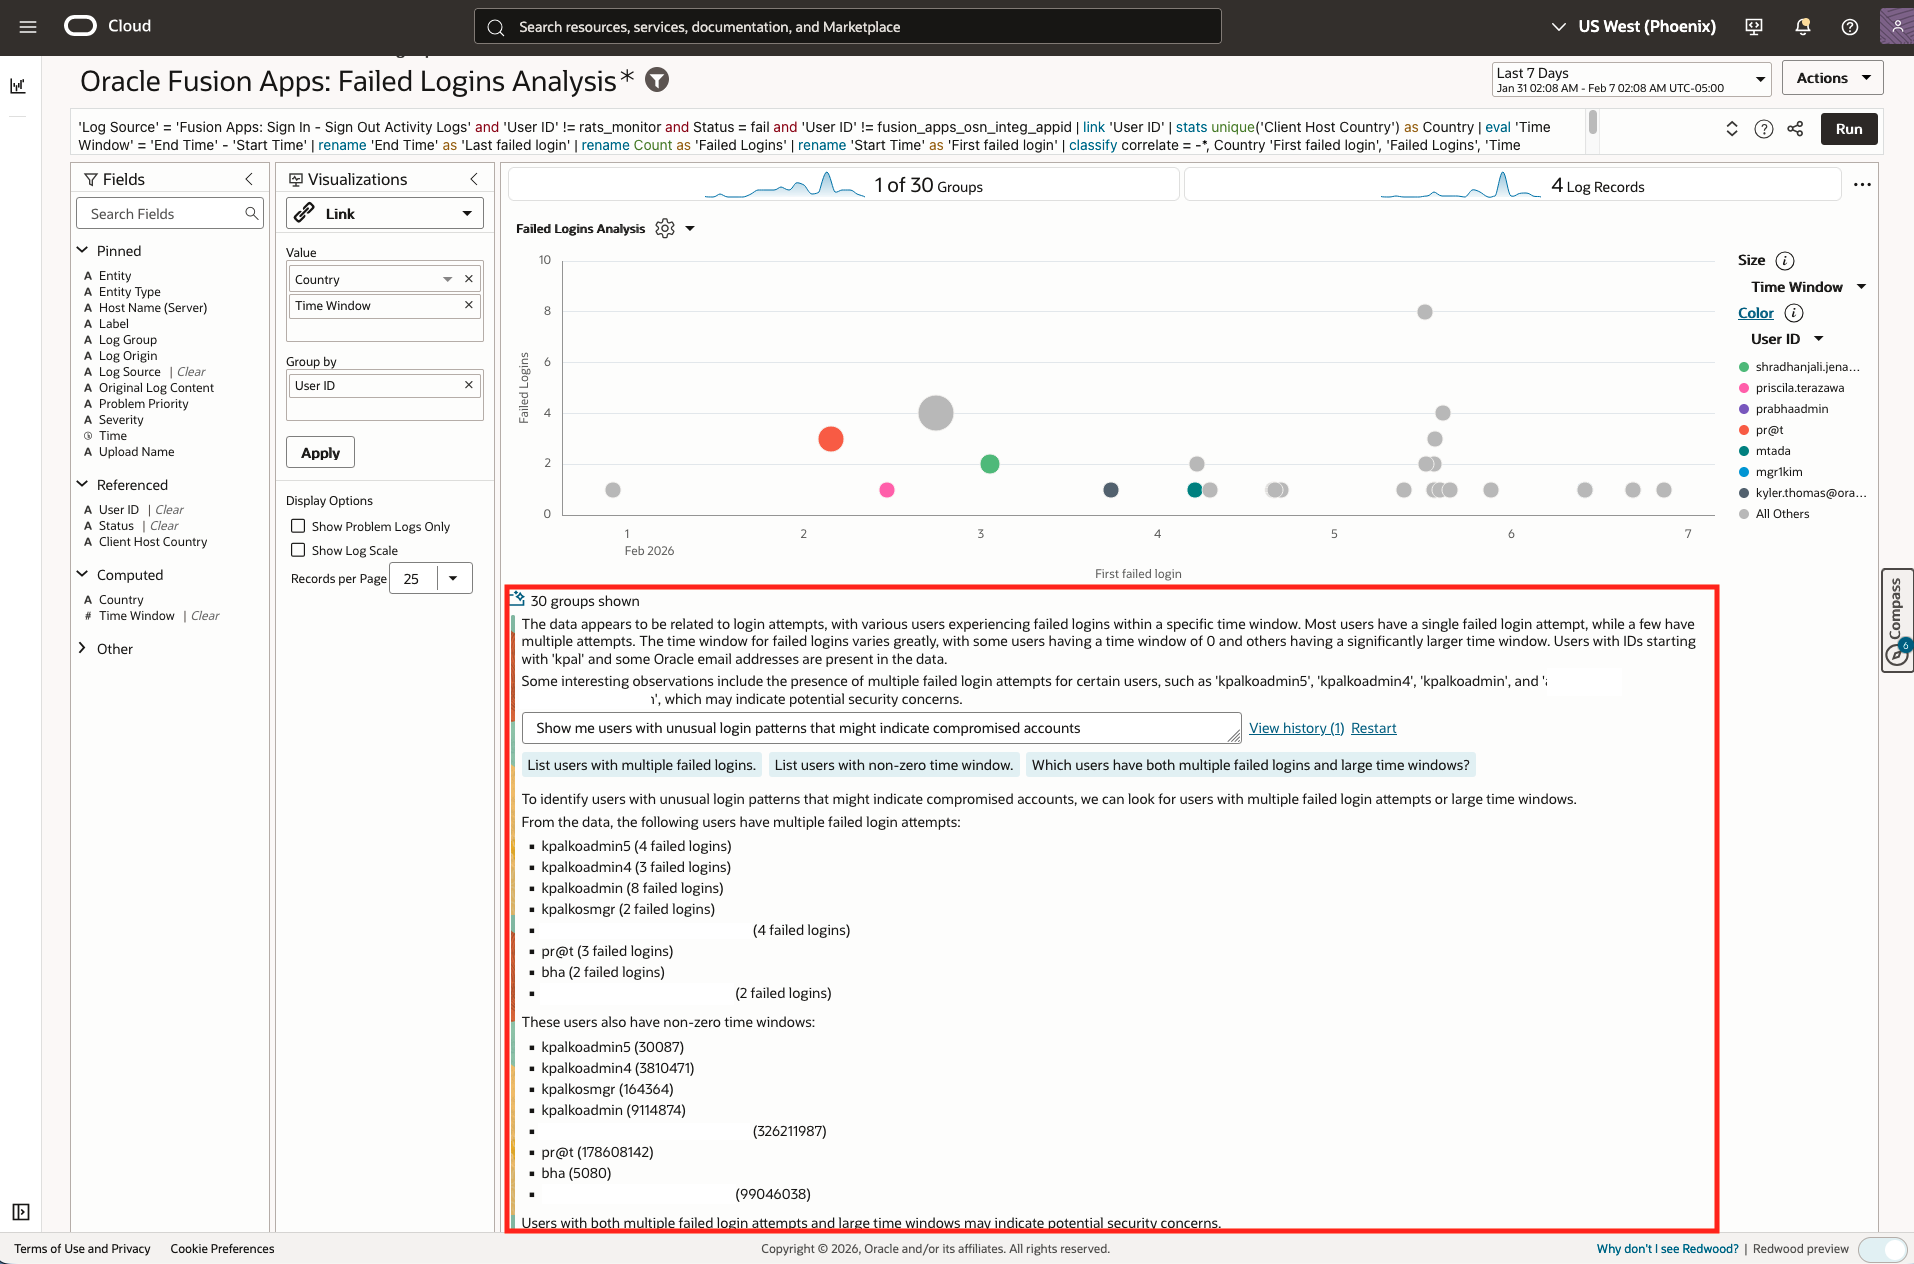
- LoganAI Chart Explain Insights: Show me users with unusual login patterns that might indicate compromised accounts
- Query: ‘Log Source’ = ‘Fusion Apps: Sign In – Sign Out Activity Logs’ and ‘User ID’ != rats_monitor and Status = fail and ‘User ID’ != fusion_apps_osn_integ_appid | link ‘User ID’ | stats unique(‘Client Host Country’) as Country | eval ‘Time Window’ = ‘End Time’ – ‘Start Time’ | rename ‘End Time’ as ‘Last failed login’ | rename Count as ‘Failed Logins’ | rename ‘Start Time’ as ‘First failed login’ | classify correlate = -*, Country ‘First failed login’, ‘Failed Logins’, ‘Time Window’, ‘User ID’ as ‘Failed Logins Analysis’
- LoganAI explain:
- Visualization: Link
- Time Range: Last 7 days
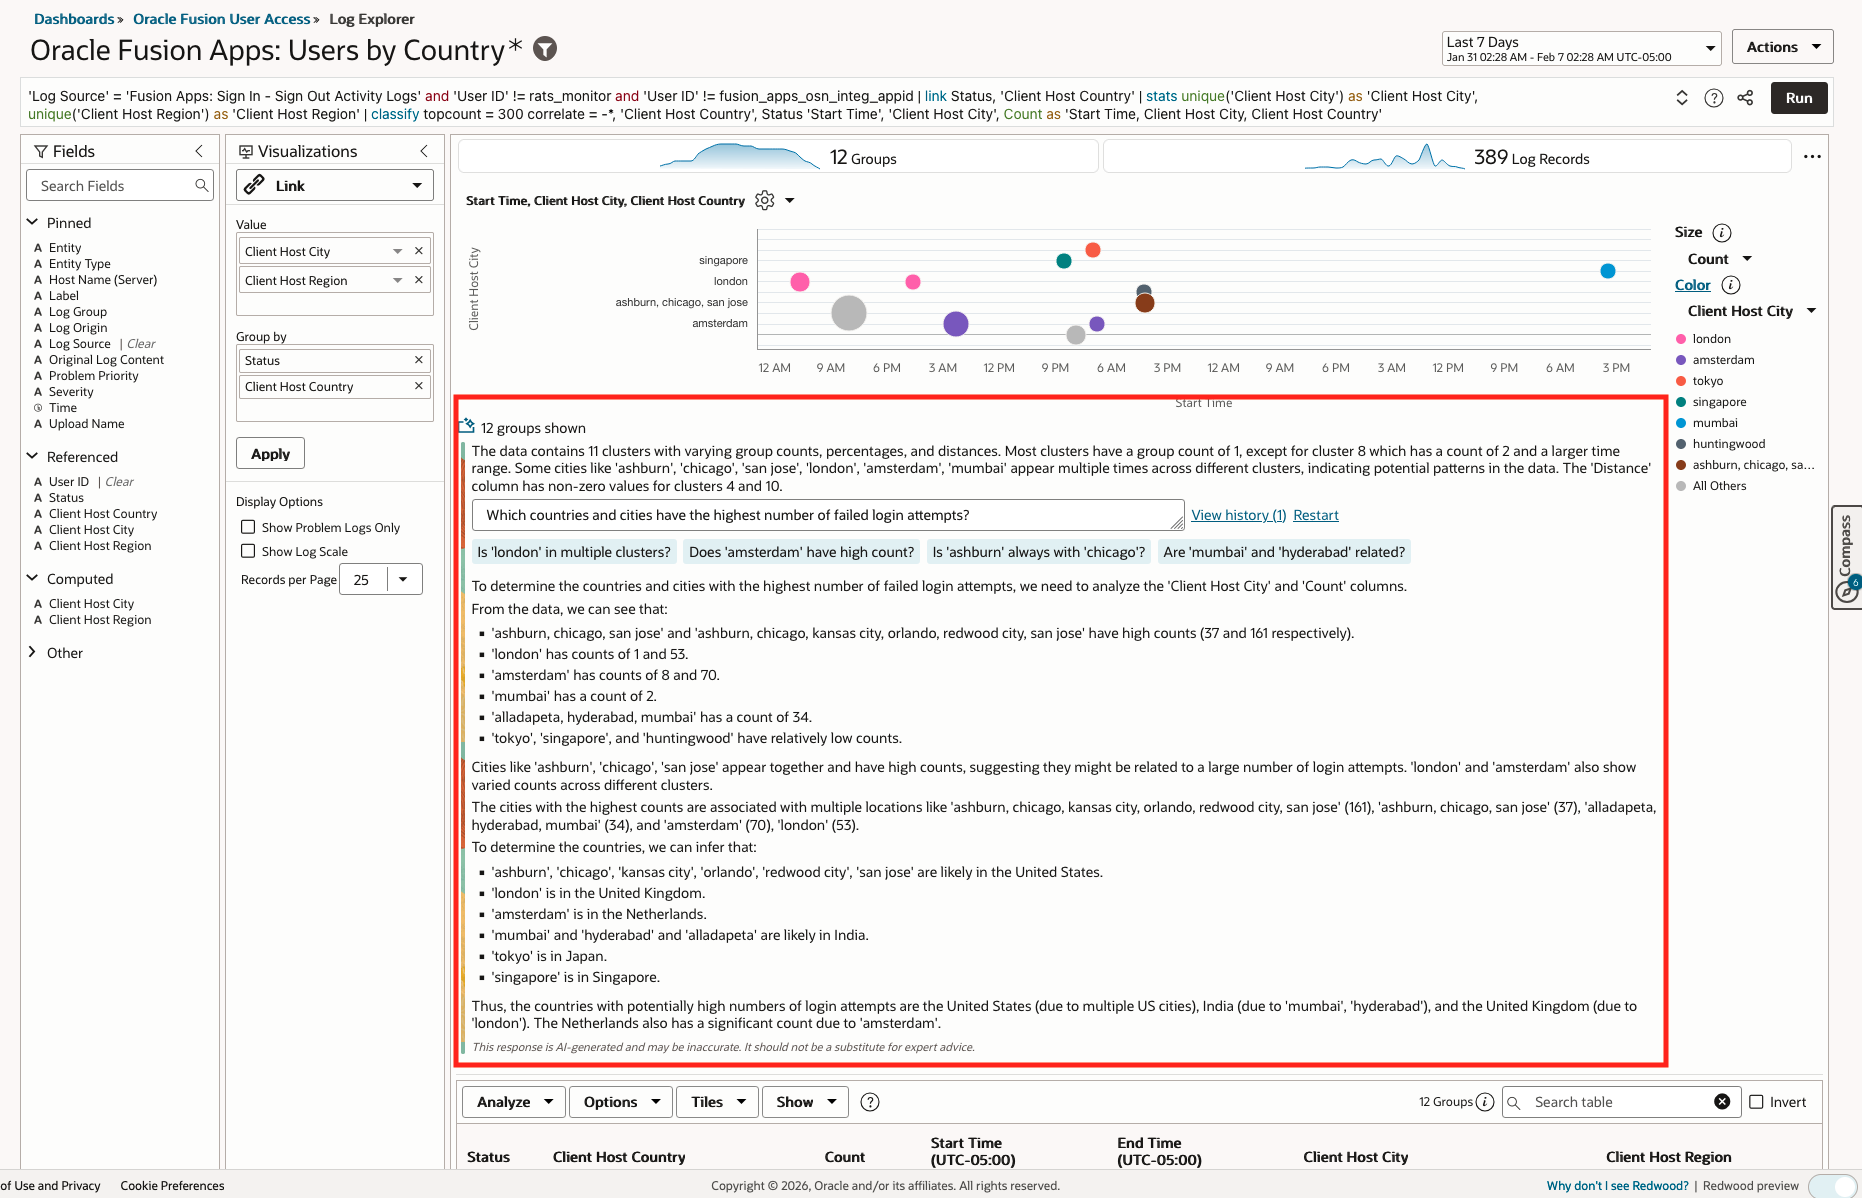
- LoganAI Chart Explain Insights: Which countries and cities have the highest number of failed login attempts?
- Query: ‘Log Source’ = ‘Fusion Apps: Sign In – Sign Out Activity Logs’ and ‘User ID’ != rats_monitor and ‘User ID’ != fusion_apps_osn_integ_appid | link Status, ‘Client Host Country’ | stats unique(‘Client Host City’) as ‘Client Host City’, unique(‘Client Host Region’) as ‘Client Host Region’ | classify topcount = 300 correlate = -*, ‘Client Host Country’, Status ‘Start Time’, ‘Client Host City’, Count as ‘Start Time, Client Host City, Client Host Country’
- LoganAI explain:
- Visualization: Link
- Time Range: Last 7 days
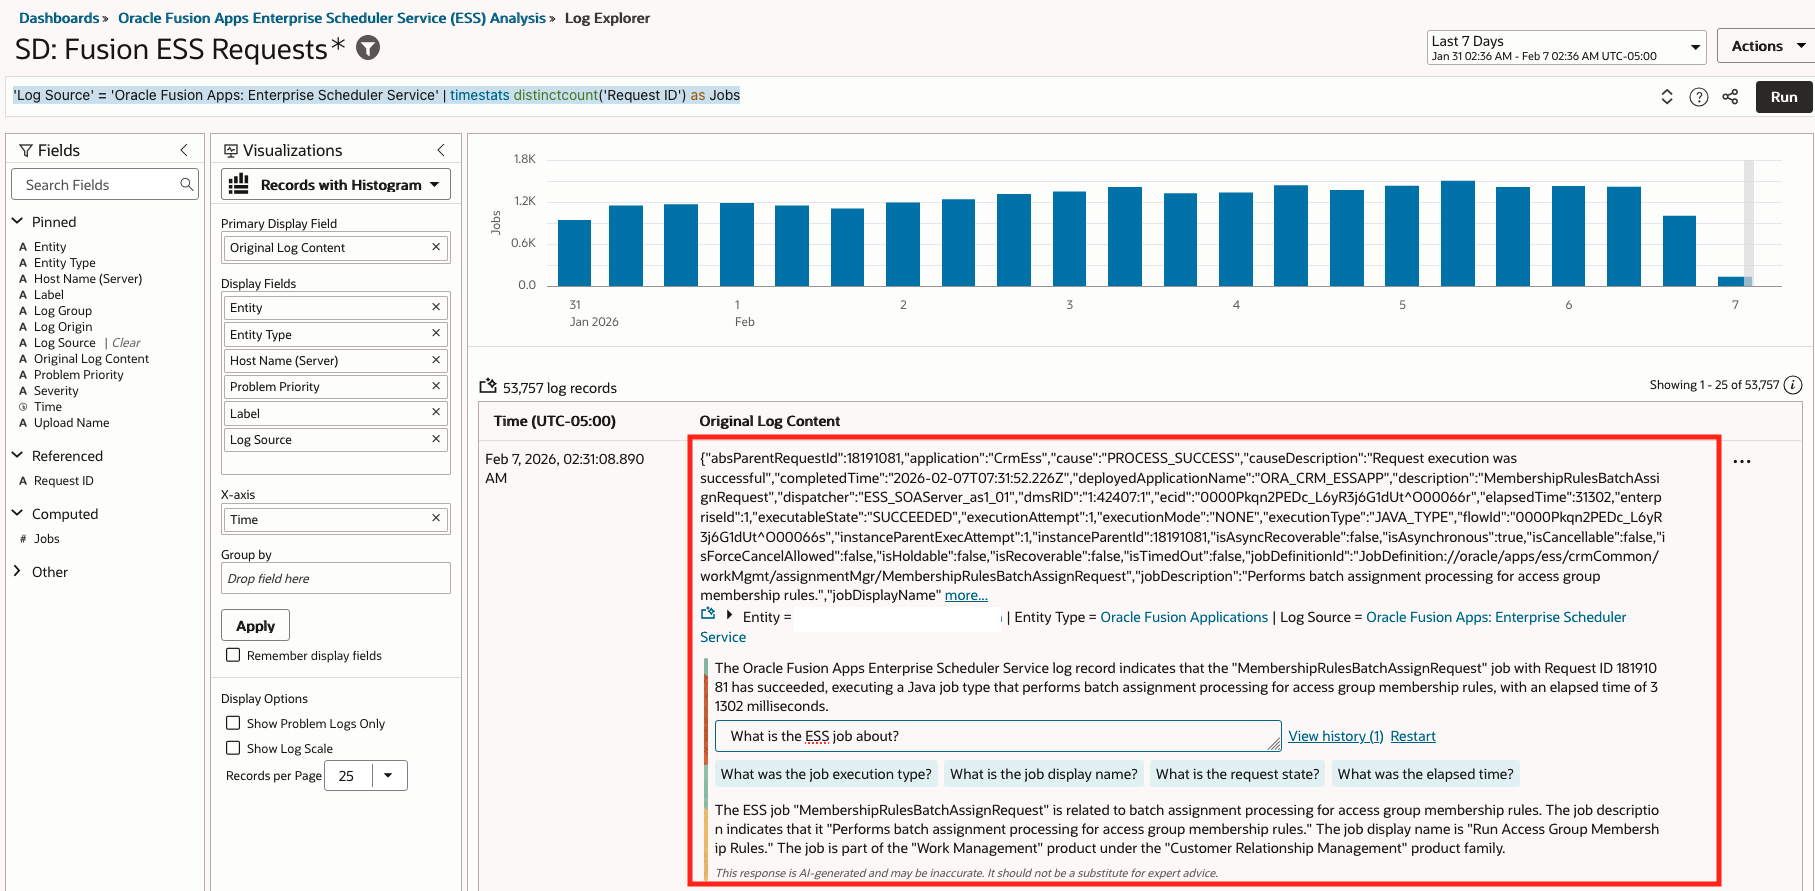
- LoganAI Single Log Explain Insights: What is the ESS job about?
- Query: ‘Log Source’ = ‘Oracle Fusion Apps: Enterprise Scheduler Service’ | timestats distinctcount(‘Request ID’) as Jobs
- LoganAI explain:
- Visualization: Records with Histogram
- Time Range: Last 7 days
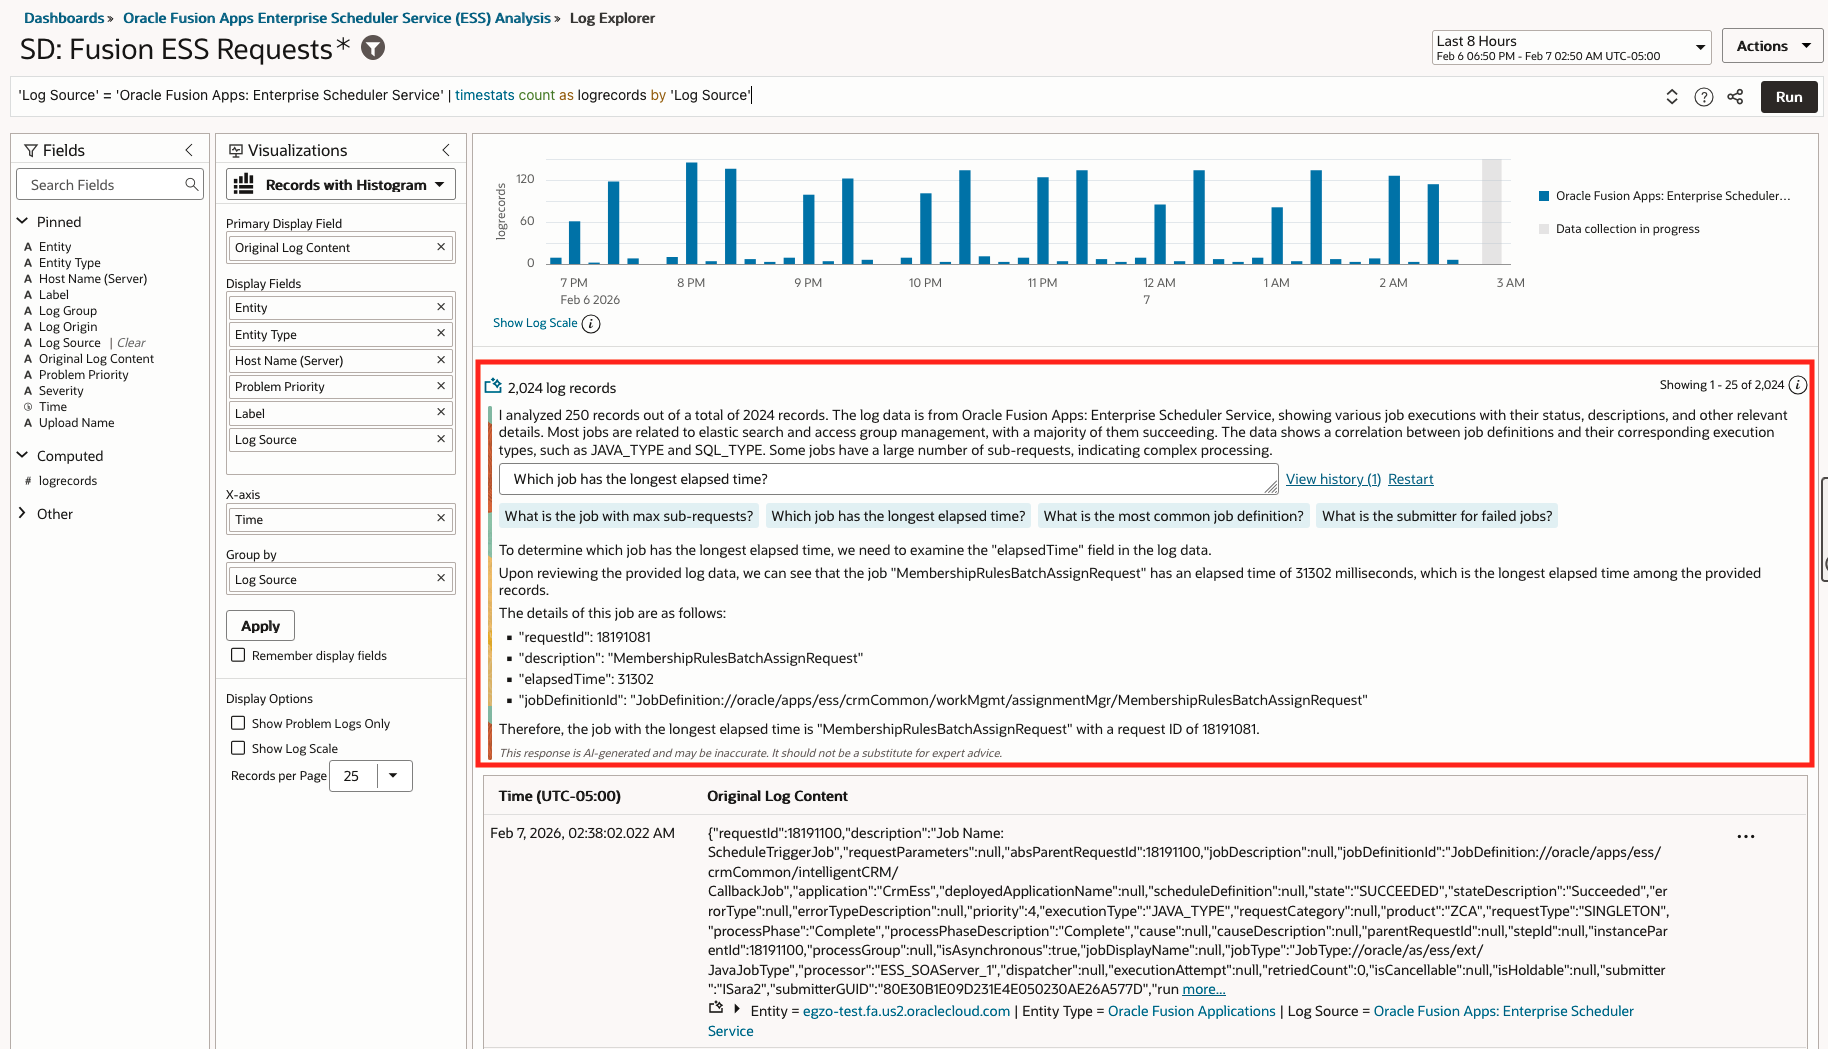
- LoganAI Multiple Log Explain Insights: Which job has the longest elapsed time?
- Query: ‘Log Source’ = ‘Oracle Fusion Apps: Enterprise Scheduler Service’ | timestats count as logrecords by ‘Log Source’
- LoganAI explain:
- Visualization: Records with Histogram
- Time Range: Last 8 hours
- LoganAI Chart Explain Insights: What ESS jobs are failing most frequently, and what are the primary reasons for the failure?
- Query: ‘Log Source’ = ‘Oracle Fusion Apps: Enterprise Scheduler Service’ | link ‘Request ID’ | stats unique(Application) as Application, avg(ElapsedTime) as E, unique(‘Instance Parent Id’) as ‘Parent ID’, unique(‘Job Display Name’) as Job, unique(‘Parent Request ID’) as ‘Parent Req ID’, unique(‘Product Name’) as Product, unique(‘Product Family’) as ‘Product Family’, latest(‘State Description’) as Status, unique(Submitter) as Submitter | eval ‘Time Taken’ = unit(E, ms) | eval U = url(‘https://oracle.com‘, View) | eventstats distinctcount(‘Request ID’) as Requests, avg(E) as AE, latest(U) as Details by Product, Job, Status | eval ‘Average Time Taken’ = unit(AE, ms) | createtable name = ‘Job Summary’ select Product, ‘Product Family’, Job, Status, Requests, ‘Average Time Taken’, Details | classify ‘Start Time’, Job, ‘Time Taken’, Product, ‘Product Family’, Status as ‘ESS Jobs Analysis’ | fields -E, -AE
- LoganAI explain:
- Visualization: Link
- Time Range: Last 7 days

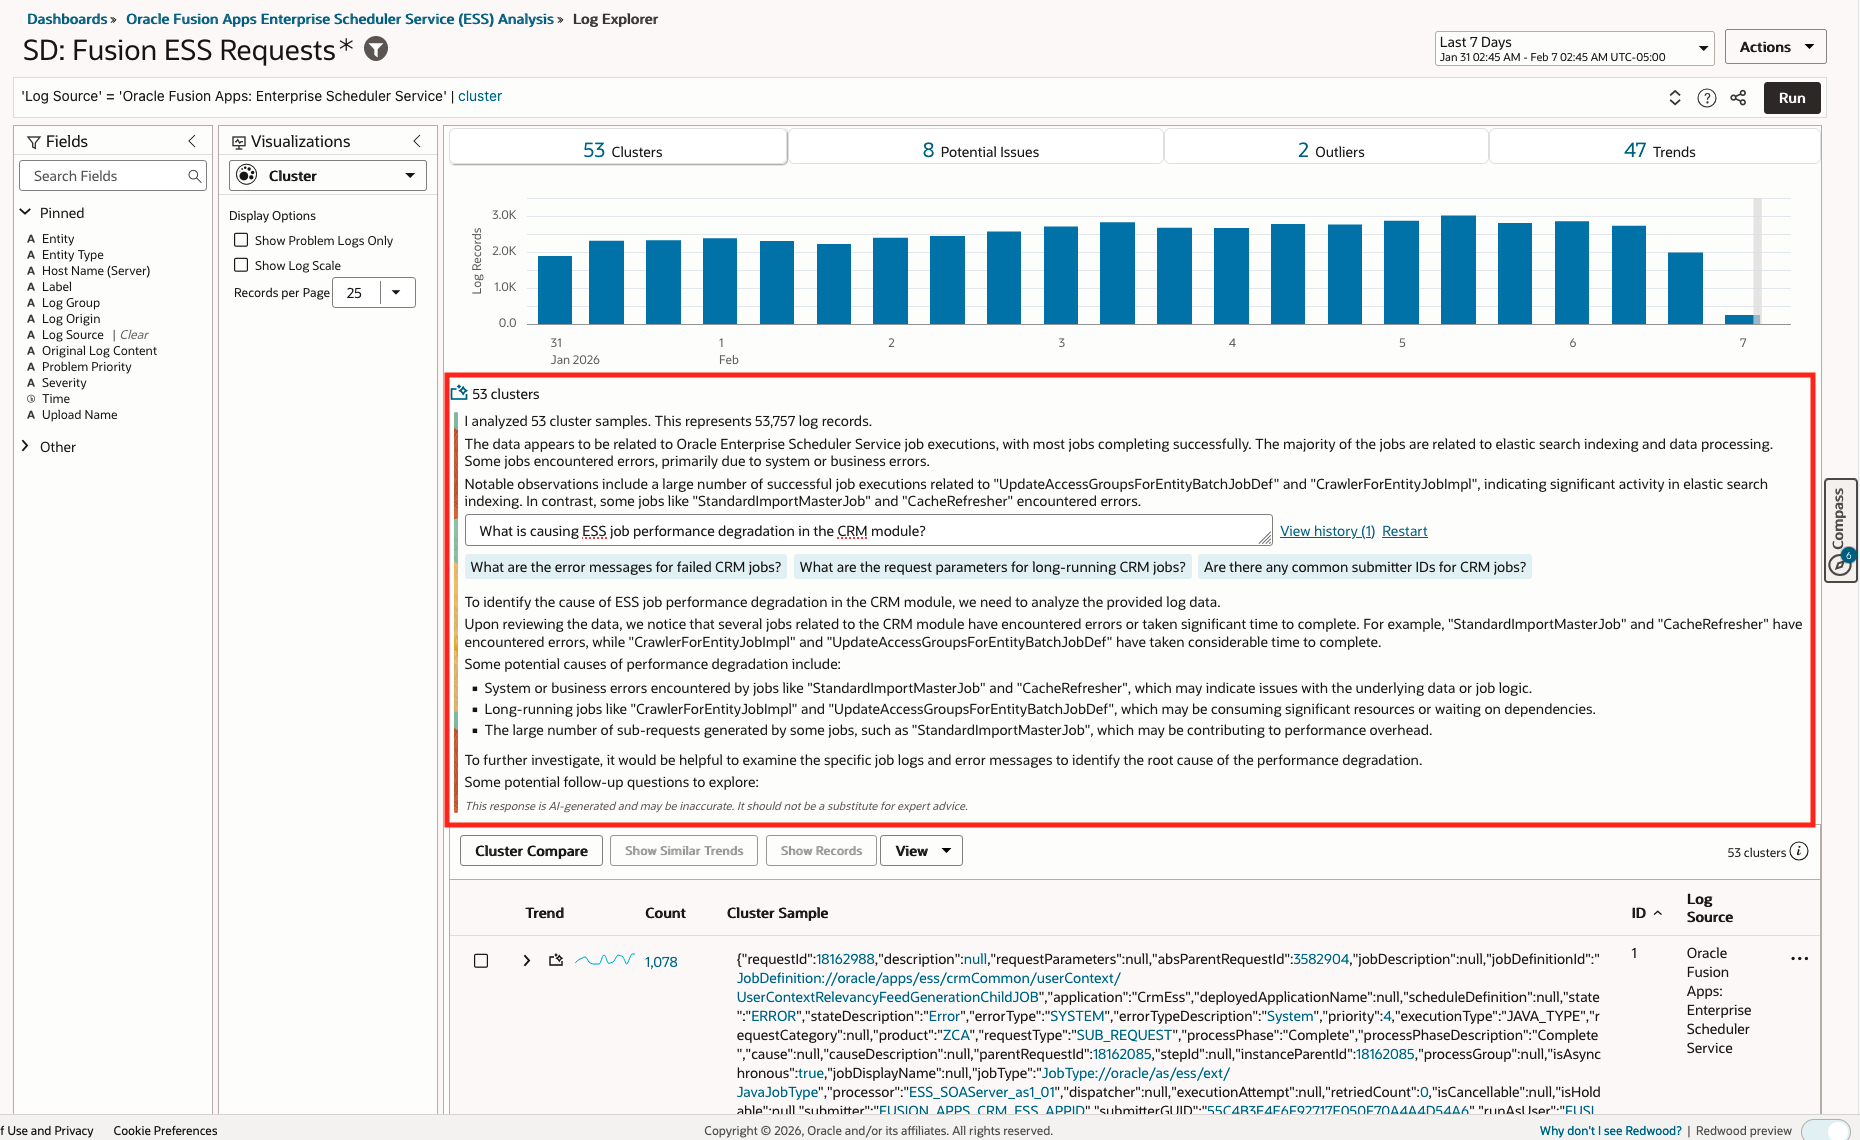
- LoganAI Chart Explain Insights: What is causing ESS job performance degradation in the CRM module?
- Query: ‘Log Source’ = ‘Oracle Fusion Apps: Enterprise Scheduler Service’ | cluster
- LoganAI explain:
- Visualization: Cluster
- Time Range: Last 7 days
Best Practices for Maximizing LoganAI Explain
To fully leverage LoganAI’s advanced AI-driven analysis capabilities within OCI Log Analytics, adopt these best practices:
- Use ‘Log Source’ or ‘Entity’ Filtering with Cluster Visualization
Always apply appropriate ‘Log Source’ or ‘Entity’ filters before using Cluster visualization. This ensures that the AI summary is both relevant and focused, and enables context-rich follow-up queries for deeper insight. Precise filtering reduces noise and guides LoganAI to more actionable conclusions. - Select the Proper Time Range for the Right Level of Analysis
For a high-level overview or trend discovery, set broader time ranges when clustering data. For detailed, tactical analysis—such as troubleshooting or anomaly investigation—narrow the time window and use Records with Histogram visualization. Matching your time range to your investigation depth yields optimal insights and avoids information overload. - Be Aware of Cluster Group Context Window Limit (500 Items)
LoganAI Cluster analysis works best with smaller, well-scoped data sets. The maximum context window for a cluster group is 500 records; if your data approaches or exceeds this, the AI may hallucinate or miss important context details. For accurate root cause analysis and precise recommendations, focus on filtering to smaller, meaningful log groups. - Leverage Link Visualization and Charts for AI-Augmented Context
Use Link visualization and custom charts to enrich your analysis. By combining AI-derived insights with visual context, you gain a clearer picture of relationships (e.g., between users, locations, and event statuses) and subtle patterns not easily detected by raw log inspection alone. - Utilize the Custom Action Menu to Add and Augment Datasets
Take advantage of LoganAI in the custom action menu to bring additional datasets into your investigation. This multi-source context augments the analysis, uncovering trends or anomalies that might span modules or log types, and yielding holistic, cross-source insights. - Monitor and Manage Generative AI Usage and Cost
Each LoganAI Explain action consumes resources from OCI Generative AI Services, and costs are based on how often you use Explain, the size and complexity of the data, and the number of follow-up analyses. These charges are separate from standard OCI Log Analytics costs. Review the OCI Pricing guide under Generative AI Services, and plan your usage accordingly to balance insights value and budget considerations.
By following these best practices, you can maximize both the technical and business value of LoganAI in your security, compliance, and operational monitoring workflows—gaining sharper insights, accelerating investigations, and optimizing your OCI resource usage.
Conclusion
Robust log collection, when combined with AI-driven analytics, unlocks transformative security monitoring, observability, and compliance for Oracle Fusion Applications customers. With the right permissions and access in place, organizations can efficiently ingest and analyze log data using Log Analytics and advanced tooling like LoganAI. This enables deep visibility into operations, rapid threat detection, and identification of anomalous behaviors and attack patterns—all from within unified dashboards and automated workflows.
LoganAI is more than a feature—it’s a leap forward in log intelligence. It makes troubleshooting faster, insights clearer, and log analytics more accessible. Whether you’re an engineer, analyst, or business stakeholder, LoganAI transforms how you understand and act on your log data.
References
- Configure Fusion Applications Audit and Security Logs Ingestion – Part 1
- Configure Fusion Applications Audit and Security Logs Ingestion – Part 2
- AI-Driven IAM Audit Analysis for Oracle SaaS
- Beyond Monitoring: AI-Driven Fusion ESS Job Health Risk Observatory
- Enable LoganAI
- Create Dashboards
- Log Explorer Query Language
- Create Detection Rules
- Create Alerts for Detected Events
- Fusion Applications Observability: Collecting ESS Logs
- Oracle o11y Solutions GitHub Repository
- Methods and Ways to Extract Session Information Using OCI Audit