Introduction
Enterprise Scheduler Service (ESS) is the backbone of batch and background processing in Oracle Fusion applications. Monitoring ESS jobs is critical to ensure business continuity, data freshness, SLA adherence, and operational confidence.
Enterprise customers rely on thousands of Oracle Fusion ESS jobs to run payroll, financial close, integrations, billing, and compliance workloads.
Traditional ESS monitoring techniques include:
- ESS Scheduled Processes UI (reactive, manual)
- ESS Scheduler REST APIs (operational but limited analytics)
- Database queries on ESS history tables (powerful but not operationalized)
However, these approaches lack trend detection & analysis and proactive risk detection, failures are detected after business impact, performance degradation goes unnoticed for weeks, SLA breaches are reactive, not preventable.
This leads to outages, escalations, audit risks.
Objective
The objective of the ESS Job Health & Risk Observatory is to provide an industry-aligned, proactive, and decision-oriented monitoring framework.
- Detect failures, delays, and anomalies early
- Provide SLA and performance intelligence
- Reduce noise and focus on actionable risks
The ESS Job Health & Risk Observatory changes Fusion ESS monitoring from simple job tracking into actionable operational intelligence. Instead of reacting to failures, customers gain clear visibility into current job health, emerging risks, and future failure trends using identified key operational metrics (E.g… Average runtime, Success Rate, Failure Rate, Runtime volatility, Failure probability, SLA breach probability, Stuck Job probability, Job Regression, Job risk score).
With more than 30 purpose-built widgets and queries, the dashboard reveals patterns that are not visible in standard ESS views. These include runtime drift, recurring failures, schedule congestion, SLA exposure, and abnormal execution behavior.
A key capability of the observatory is its rule-based detection and alarm framework. Using Detection rules for any event or risk condition, such as repeated failures, abnormal duration spikes, missed schedules, SLA breaches. These rules drive automatic alerts and alarms, ensuring teams are notified early and consistently when risk thresholds are crossed.
By combining real-time execution signals with historical trends and behavioral analysis, teams can detect issues early, reduce alert noise, and focus only on what matters. This enables a shift from firefighting to prevention, with better confidence in scheduling, capacity planning, and SLA commitments.
When enriched with OCI Log Analytics AI (LoganAI), the same insights support anomaly detection and faster root-cause analysis
This dashboard delivers derived intelligence, not raw data, giving customers foresight instead of hindsight.
In this blog, we explain how this dashboard can be designed and implemented using the underlying tools and analytical techniques that make predictive ESS observability possible.
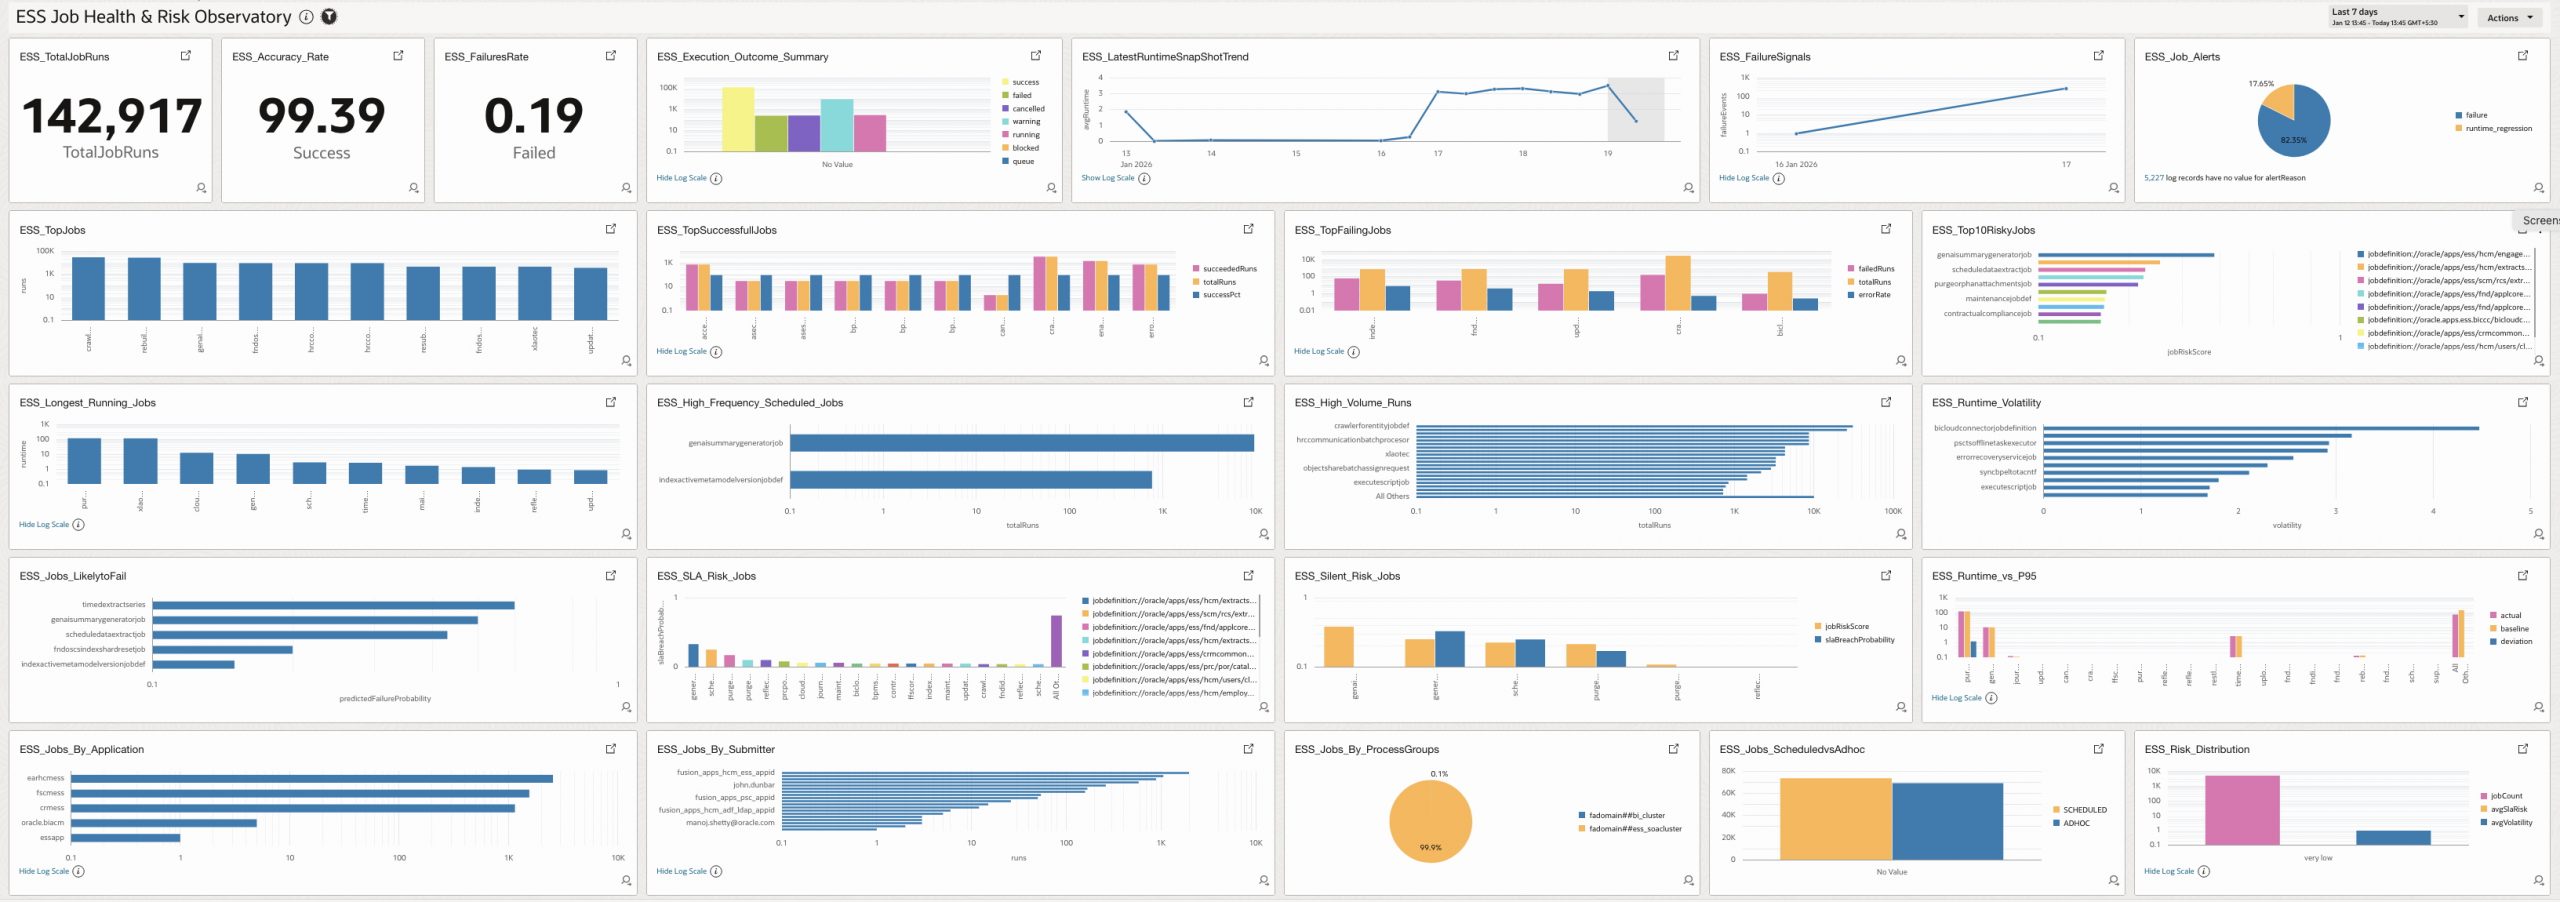
ESS Job Health & Risk Observatory
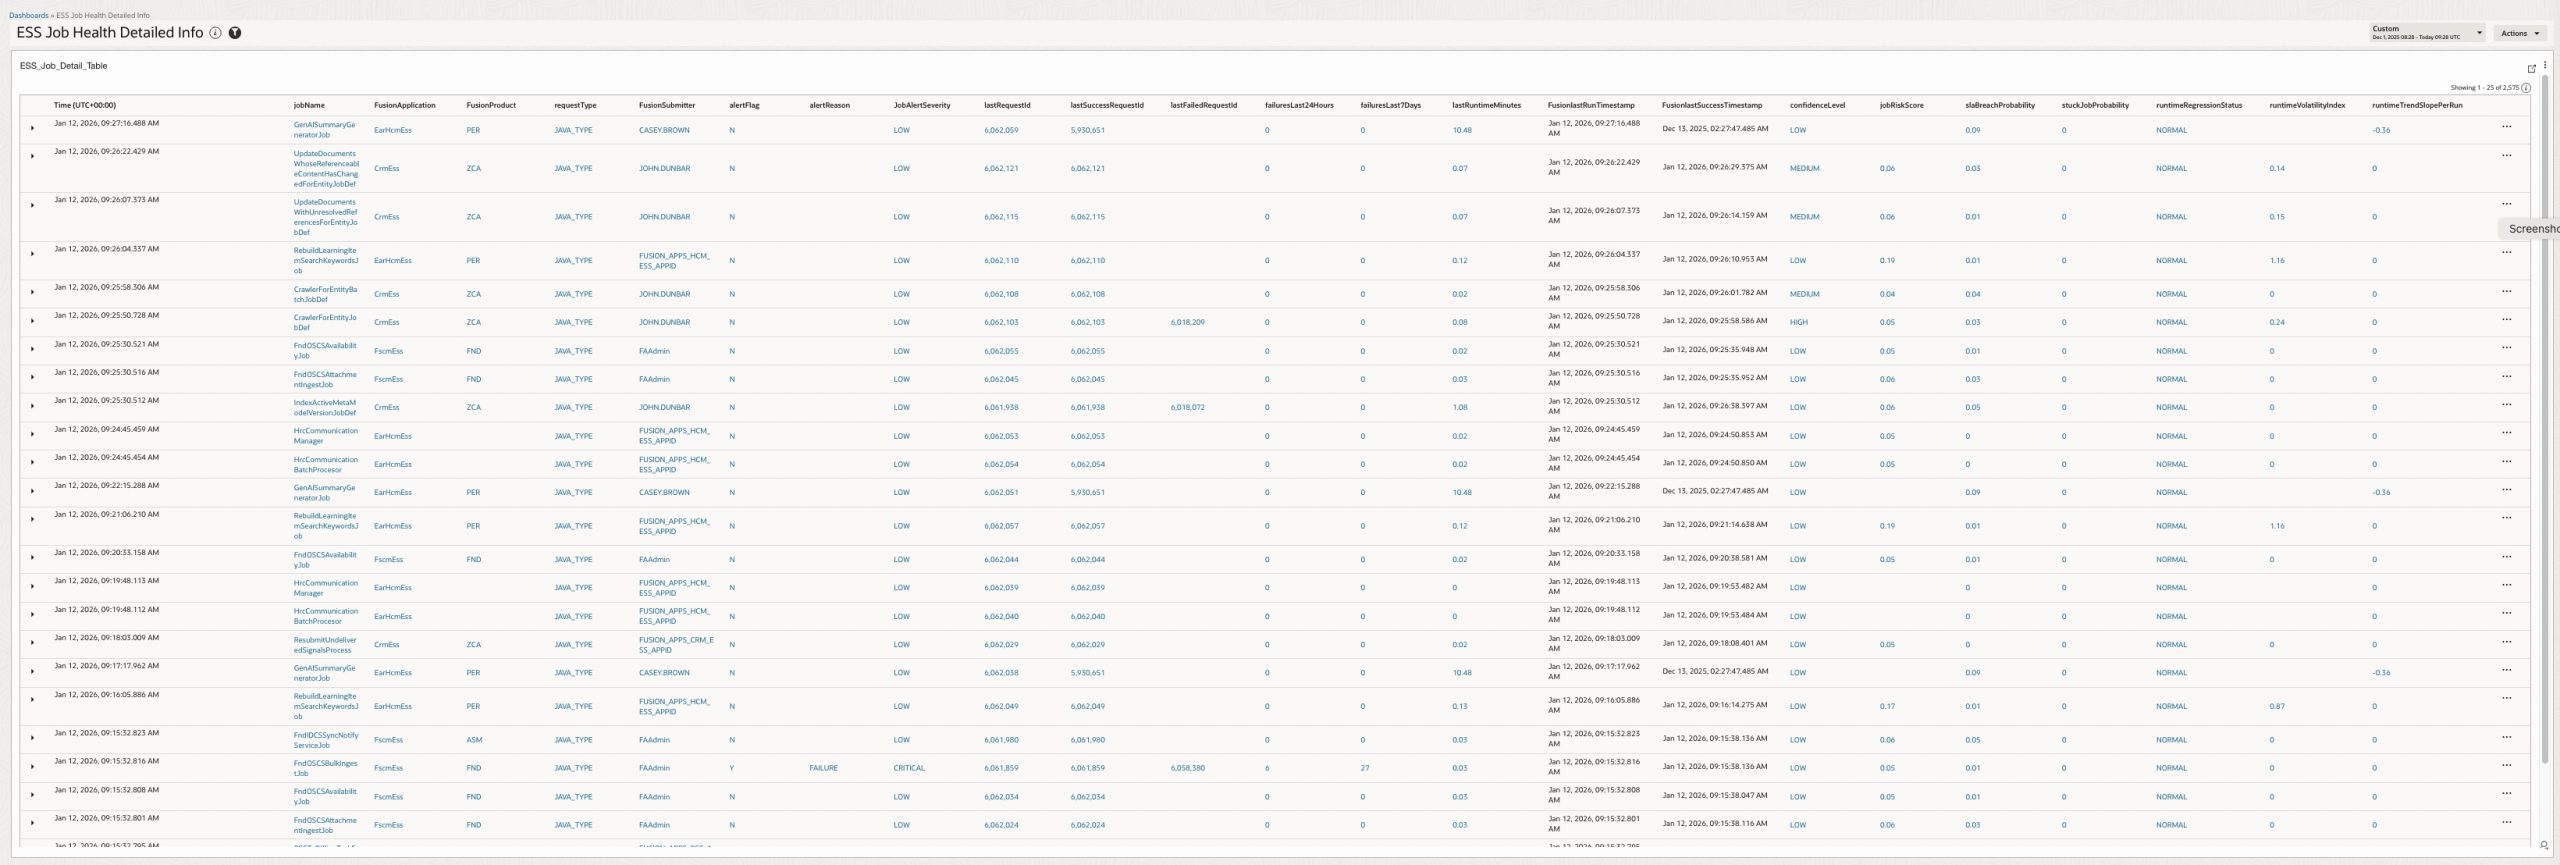
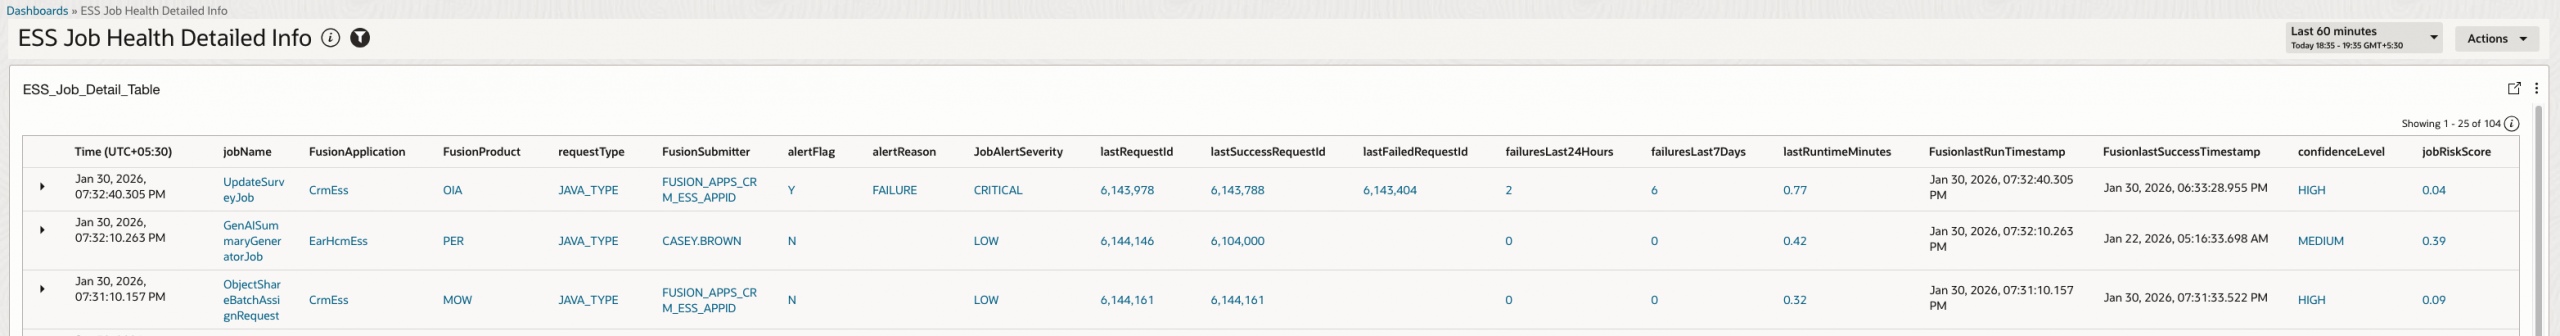
ESS Job Health Detailed Info (Drill Down Report)
Key Metrics
Each metric answers a concrete operational question and maps directly to an action, this is explained in details in section 1.3 ESS Job Health Signal Calculation
| Metric | What It Represents | Why It Is Useful for Customers |
| Average Run time Minutes | Average runtime of successful executions within the monitoring window. | Short-term performance tracking Drift detection |
| Standard Deviation Run time Minutes | Standard deviation of job runtimes within the monitoring window. | It measures how much a job’s runtime varies from run to run. If a job always takes about the same time, this value is low If a job sometimes runs fast and sometimes very slow, this value is high It tells you runtime consistency, not speed. |
| Average Run time Baseline Minutes | Typical job runtime – Long-term historical average runtime. | Baseline for planning and benchmarking |
| P95 Run time Minutes | Expected worst-case runtime – Upper runtime bound for normal behavior. | SLA design, alert thresholds, capacity sizing |
| Runtime Trend Slope | Direction and strength of runtime change over time – Is the job getting slower over time? | • Detects gradual degradation not visible in single runs • Early warning before SLAs or failures occur • Essential for predictive observability |
| Runtime Volatility Index | Degree of runtime variability for a job – Is runtime becoming unpredictable? | • High volatility = unstable job behavior • Helps explain why SLAs are breached intermittently • Critical for confidence scoring and alert trustworthiness |
| Run Time Regression Status | Detects performance degradation between consecutive runs. | Early signal of data growth Detects degradation before SLA breach |
| Predicted Failure Probability | Likelihood that the next execution of an ESS job will fail | • Predicts risk before failure happens • Avoids reacting only after incidents • Helps prioritize proactive remediation for high-risk jobs even if last run succeeded |
| SLA Breach Probability | Probability that a job’s runtime exceeds its historical SLA baseline | How likely is this job to run longer than what is considered normal for it? • Identifies jobs that are silently drifting toward SLA breaches • Useful for capacity planning and SLA governance |
| Stuck Job Probability | Probability that a currently running job is “stuck” | • Highlights jobs that may never complete • Enables early termination or escalation • Prevents resource starvation and cascading delays |
| Composite Job Risk Score | Unified risk indicator combining multiple failure dimensions – Single number summarizing job health | • Single, explainable risk number for dashboards • Enables sorting, bucketing, and alert thresholds • Avoids alert fatigue by combining signals |
| Confidence Score Weighted | A numeric confidence score (0–1) used internally for: Threshold tuning, Alert gating, Observability & dashboards | Allows fine-grained analysis beyond LOW / MEDIUM / HIGH Enables future adaptive thresholds |
| Confidence Level (LOW / MEDIUM / HIGH) | Trustworthiness of computed metrics – How reliable the prediction is ? | • Prevents false alerts on sparse data • Allows alerts only when signals are reliable • Increases customer trust in observability outputs |
High Level Architecture
- BI Analytics report to compute, aggregate & extract ESS metrics data from Fusion tables
- Create Integration (OIC) to Expose BI metrics report as JSON
- Configure OCI Logging Analytics to ingest metrics from OIC Integration
- Design OCI Dashboard widgets & OCI Dashboard – ESS Job Health & Risk Observatory
- Define Detection Rules using alert flags and thresholds
- Configure OCI Alarms for proactive notifications
- Additionally – Analyze data using LoganAI
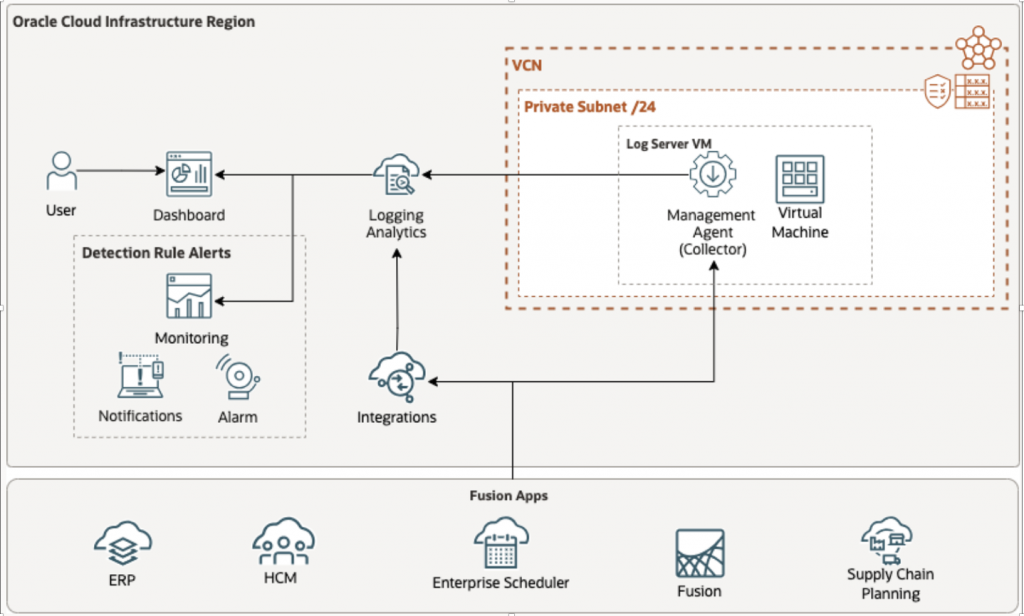
Data Flow
Fusion Applications → BI Publisher → OIC REST API → OCI Management Agent → OCI Log Analytics → Widgets/Dashboards → Detection Rules → Alarms !
Prerequisites
Ensure the following prerequisites are available before starting the setup:
OCI Services
- Oracle Integration Cloud (OIC) – active instance
- OCI Log Analytics – enabled
- OCI IAM – for OAuth, policies, and groups
- OCI Compute – for Management Agent
- OCI Monitoring & Notifications – for alarms
Access Requirements
- OCI user with:
- Tenancy Admin or permissions to manage IAM, OIC, Log Analytics, and Compute
- Ability to create:
- IAM policies, groups, and confidential OAuth applications
Fusion Applications
- Access to Fusion instance
- BI Publisher (BIP) enabled
- Service account with roles:
- BIConsumer
- ESSMonitor
Detailed Steps
1 – BI-Layer
The BI Analytics–driven approach is intentionally chosen because it enables historical baselining with statistical modeling.
This solution does not replace ESS APIs instead, it elevates ESS monitoring from reactive status checks to predictive job health intelligence.
BI is explicitly designed to bring aggregate Job data at controlled intervals and return only pre-computed summaries, ensuring negligible performance impact on Fusion therefore data volume remains low which brings –
- Time-series analytics
- Historical analysis
- Scheduled batch data access
- Derived metrics
- Distribution modeling
- Weighted scoring
- Confidence calculation
The ESS Job Health & Risk Observatory is designed as a job-centric intelligence layer, not a raw request audit report, In a given time window:
- There may be 100 request executions
- But only 10 unique job definitions
Instead of extracting all 100 request rows, the BI model intentionally:
- Collapses execution data into distinct job-level entities
- Derives statistical metrics per job
- Anchors on the latest execution context
- Preserves historical distribution for modeling
This ensures the system produces health intelligence, not raw noise, this minimizes SaaS load, ensures modeling stability, and produces actionable signals rather than transactional noise, because the goal is statistical job intelligence, not transaction replication. Pulling all requests increases system load and reduces model stability without improving predictive value.
Each job record already contains key metrics defined here
This is compressed intelligence, OCI Log Analytics then becomes – Visualization layer, Alert engine & AI query layer, this also protects: Fusion performance, OIC throughput & OCI ingestion volume
Follow Quick Links to jump over topics
- Report columns
- Query parameters
- ESS Job Health signal calculations
- Alert engine
- Report design & development (Data model query & layout)
1.1- Report Columns
Column Legend – Computation Scope
- Windowed → Uses
:P_FROM_TIMESTAMP→:P_TO_TIMESTAMP - Cumulative (as of TO) → Uses data up to
:P_TO_TIMESTAMP - Derived → Parsed / inferred metadata
- Calculated → Computed using formulas, statistics, or rules
| Job Identity & Metadata | ||||
| Column Name | Description | How It Is Used | Computation Scope | Calculation / Derivation |
| JOB_IDENTIFIER | Unique ESS job technical key | Primary identifier, joins | Derived | ESS_REQUEST_HISTORY.DEFINITION |
| JOB_NAME | Human-readable job name | UI display | Derived | Extracted from definition path |
| APPLICATION | Fusion application | App filtering | Derived | ESS metadata |
| PRODUCT | Fusion product | Product analytics | Derived | ESS metadata |
| REQUEST_TYPE | Job request type | Execution classification | Derived | ESS request type |
| PROCESSGROUP | ESS process group | Capacity analysis | Derived | ESS metadata |
| SUBMITTER | Job submitter | Audit & RCA | Derived | ESS metadata |
| SCHEDULED | Scheduled vs ad-hoc | Execution behavior | Derived | ESS flag |
| JOB_DEDUPE_KEY | Unique job-run key | Alert deduplication | Derived | Request ID || DEFINITION |
| Execution Timing & Request Details | ||||
| Column Name | Description | How It Is Used | Computation Scope | Calculation / Derivation |
| LAST_RUN_TIMESTAMP | Latest execution start | Freshness checks | Windowed | Max PROCESSSTART |
| LAST_RUN_END_TIME | Latest execution end | Runtime calc | Windowed | PROCESSEND |
| REQUEST_START_TIME | Requested start time | Schedule adherence | Windowed | REQUESTEDSTART |
| REQUEST_EVENT_TIME | Analytics event time | Incremental ingestion | Windowed | Alias of last run time |
| REQUEST_COMPLETE_TIME | Completion timestamp | SLA checks | Windowed | COMPLETEDTIME |
| REQUESTID | Latest request ID | Drill-down | Windowed | Highest request ID |
| PARENTREQUESTID | Parent request | Job hierarchy | Derived | ESS metadata |
| Success & Runtime History | ||||
| Column Name | Description | How It Is Used | Computation Scope | Calculation / Derivation |
| LAST_SUCCESS_TIMESTAMP | Most recent success | Reliability signal | Cumulative (as of TO) | Max success COMPLETEDTIME |
| LAST_RUNTIME_MINUTES | Last success runtime | Performance tracking | Cumulative | (END − START) × 1440 |
| PREVIOUS_RUNTIME_MINUTES | Prior success runtime | Regression detection | Cumulative | 2nd latest success |
| RUNTIME_REGRESSION_STATUS | Runtime degradation | Predictive alerts | Calculated | Compares last vs previous using regression factor |
| Baseline & Statistical Metrics | ||||
| Column Name | Description | How It Is Used | Computation Scope | Calculation / Derivation |
| AVG_RUNTIME_BASELINE_MIN | Historical mean runtime | SLA baseline | Cumulative | AVG(success runtimes) |
| P95_RUNTIME_BASELINE_MIN | 95th percentile runtime | SLA threshold | Cumulative | PERCENTILE_CONT(0.95) |
| AVG_RUNTIME_MINUTES | Avg runtime (window) | Trend analysis | Windowed | AVG(success only) |
| STDDEV_RUNTIME_MINUTES | Runtime deviation | Stability analysis | Windowed | STDDEV(success only) |
| RUNTIME_VOLATILITY_INDEX | Runtime instability | Risk scoring | Calculated | STDDEV / AVG |
| RUNTIME_TREND_SLOPE_PER_RUN | Runtime trend | Capacity planning | Cumulative | Linear regression slope |
| Execution & Failure Metrics | ||||
| Column Name | Description | How It Is Used | Computation Scope | Calculation / Derivation |
| TOTAL_RUNS_CUMULATIVE | Total executions | Job criticality | Windowed | COUNT(1) |
| FAILED_RUNS | Failures | Reliability | Windowed | STATE IN (10,15,18,19) |
| SUCCEEDED_RUNS | Success count | Confidence | Windowed | STATE IN (12, 17) |
| RUNNING_RUNS | Active runs | Load | Windowed | STATE = 3 |
| BLOCKED_RUNS | Blocked jobs | Dependency | Windowed | STATE = 5 |
| CANCELLED_RUNS | Cancelled | Operational | Windowed | STATE IN (7,9) |
| WARNING_RUNS | Warning | Confidence | Windowed | STATE = 11 |
| QUEUE_PRESSURE | Queue | Reliability | Windowed | STATE IN (1,2,6,13,14,20) |
| FAILURES_LAST_24_HOURS | 24h failures | Immediate alerting | Calculated | Rolling 24h window |
| FAILURES_LAST_7_DAYS | 7-day failures | Trend analysis | Calculated | Rolling 7-day window |
| ADHOC_COUNT | Adhoc Count | Load distribution | Windowed | Jobs executed by Adhoc Submissions |
| SCHEDULE_COUNT | Scheduled Count | Load distribution | Windowed | Jobs executed by Scheduled Submissions |
| Running & Stuck Job Indicators | ||||
| Column Name | Description | How It Is Used | Computation Scope | Calculation / Derivation |
| CURRENTLY_RUNNING_COUNT | Active job count | Capacity | Cumulative | Count of active states |
| MAX_RUNNING_DURATION_HOURS | Longest runtime | Hung job detection | Calculated | Elapsed runtime |
| STUCK_JOB_PROBABILITY | Stuck likelihood | Critical alerts | Calculated | Compared vs P90 / P95 |
| Predictive & Risk Analytics | ||||
| Column Name | Description | How It Is Used | Computation Scope | Calculation / Derivation |
| PREDICTED_FAILURE_PROBABILITY | Next-run failure risk | Proactive alerting | Calculated | Bayesian smoothing |
| SLA_BREACH_PROBABILITY | SLA violation chance | SLA alerts | Calculated | % runs > P95 |
| JOB_RISK_SCORE | Composite risk score | Alert prioritization | Calculated | Weighted multi-factor formula |
| CONFIDENCE_LEVEL | Signal reliability | Noise suppression | Calculated | Run count + volatility + trend |
| CONFIDENCE_SCORE_WEIGHTED | Numeric confidence | Threshold tuning | Calculated | Weighted scoring formula |
| Scheduling Intelligence | ||||
| Column Name | Description | How It Is Used | Computation Scope | Calculation / Derivation |
| SCHEDULE_START_TIME | Schedule start | SLA alignment | Derived | Parsed from XML |
| SCHEDULE_END_TIME | Schedule end | Overdue detection | Derived | Parsed from XML |
| SCHEDULE_FREQUENCY | Frequency | Load analysis | Derived | Parsed from XML |
| SCHEDULE_INTERVAL | Interval | High-frequency detection | Derived | Parsed numeric |
| SCHEDULE_ENDED_FLAG | Schedule ended | Alert suppression | Calculated | ESS terminal state |
| SCHEDULE_OVERDUE_FLAG | Schedule overdue | Critical alert | Calculated | End < now & not ended |
| HIGH_FREQUENCY_SCHEDULE_FLAG | Very frequent jobs | Load/cost alerts | Calculated | MINUTELY / HOURLY ≤ 60 |
| Request Diagnostics | ||||
| Column Name | Description | How It Is Used | Computation Scope | Calculation / Derivation |
| LAST_REQUEST_ID | Latest request | Drill-down | Cumulative | MAX(requestid) |
| LAST_SUCCESS_REQUEST_ID | Last success | RCA | Cumulative | MAX success |
| LAST_FAILED_REQUEST_ID | Last failure | RCA | Cumulative | MAX failure |
| LONGEST_RUNNING_REQUEST_ID | Longest active run | Hung job debug | Calculated | Max runtime |
| Alert Decision Outputs | ||||
| Column Name | Description | How It Is Used | Computation Scope | Calculation / Derivation |
| ALERT_FLAG | Alert decision | OCI alarms | Calculated | Rule engine |
| ALERT_REASON | Root reason | Operator clarity | Calculated | Failure / SLA / Risk |
| ALERT_SEVERITY | Severity level | Escalation | Calculated | Risk-based severity |
| Meta Fields | ||||
| Column Name | Description | How It Is Used | Computation Scope | Calculation / Derivation |
| META_FROM_TIMESTAMP | Query start | API traceability | Input | Parameter |
| META_TO_TIMESTAMP | Query end | API traceability | Input | Parameter |
| META_GENERATED_AT | Execution time | Audit | Calculated | SYSTIMESTAMP UTC |
| META_RECORD_COUNT | Record count | Pagination | Calculated | COUNT(*) OVER() |
1.2 – Query Parameters
The ESS Job Health & Risk Observatory uses a small set of tunable control parameters to balance sensitivity, accuracy, and operational noise.
These parameters do not change raw execution data , they influence how predictive intelligence and alerts are derived from it.
They can be adjusted to align with specific risk appetite, job criticality, and data maturity.
Below Parameters have default value but can be set as per specific needs, these parameters do not affect job execution, they do not increase ESS or Fusion load, they operate on aggregated, periodic snapshots ,this design ensures predictive intelligence without performance impact on Fusion applications.
| Parameter | Description | Default | Meaning / Impact | How Used in Query |
| :P_FROM_TIMESTAMP | Monitoring window start | Required | Defines time window lower bound | Filters windowed metrics |
| :P_TO_TIMESTAMP | Monitoring window end | Required | Snapshot time for metrics | Anchor for all calculations |
| :P_REGRESSION_FACTOR | Runtime regression sensitivity | 1.5 | Detects runtime degradation | Last vs previous runtime |
| :P_MIN_SUCCESS_RUNS | Minimum success runs | 3 | Confidence eligibility | Confidence calculation |
| :P_STUCK_JOB_PROBABILITY | Stuck alert threshold | 0.8 | Hung job detection | Alert rules |
| :P_JOB_RISK_SCORE | Risk alert threshold | 0.6 | High-risk jobs | Alert rules |
| :P_SLA_BREACH_PROBABILITY | SLA alert threshold | 0.4 | SLA risk tolerance | Alert rules |
P_REGRESSION_FACTOR
Purpose: Controls sensitivity to runtime regressions between consecutive successful runs.
What it means:Defines how much slower a job must run (compared to its previous successful run) before it is classified as a runtime regression.
Default behavior: Default value (e.g. 1.5) means the job must run 50% longer than its previous run to be flagged.
When to tune:
- Lower value (e.g. 1.2):
Detects smaller performance degradations earlier (more sensitive). - Higher value (e.g. 2.0):
Flags only severe regressions (less noise). - Recommended usage: Keep default unless jobs are highly latency-sensitive.
P_MIN_SUCCESS_RUNS
Purpose: Ensures statistical confidence before applying predictive logic.
What it means:Minimum number of successful executions required before, Runtime trend analysis, Volatility calculation, Confidence scoring calculations are considered reliable.
Default behavior: Jobs with fewer than this number are marked LOW confidence.
When to tune:
- Lower value:
Useful in new environments with limited history. - Higher value:
Improves accuracy in mature, high-volume systems. - Recommended usage: Do not reduce below 3 unless absolutely necessary.
P_STUCK_JOB_PROBABILITY
Purpose: Threshold for flagging a running job as potentially stuck.
What it means:Represents how far current runtime has exceeded historical norms (P95 baseline).
Default behavior:Alerts triggered only when probability crosses a high threshold (e.g. 0.8).
When to tune:
- Lower value:
Early warning for long-running jobs. - Higher value:
Alerts only when jobs are clearly abnormal. - Recommended usage: Tune lower for business-critical batch windows.
P_JOB_RISK_SCORE
Purpose: Global threshold for composite job risk.
What it means:Defines when a job’s combined risk (failure probability + SLA risk + volatility + trend + stuck risk) becomes actionable.
Default behavior: Typical alert threshold around 0.6.
When to tune:
- Lower value:
Aggressive alerting, proactive operations. - Higher value:
Focus only on high-impact risks. - Recommended usage:Adjust per environment maturity and alert fatigue tolerance.
P_SLA_BREACH_PROBABILITY
Purpose: Controls when predicted SLA violations generate alerts.
What it means:Probability that a job’s runtime will exceed its historical SLA baseline (P95).
Default behavior:Alerts triggered when probability crosses a moderate threshold (e.g. 0.4).
When to tune:
- Lower value:
SLA-driven environments with strict deadlines. - Higher value:
Non-critical or flexible batch workloads. - Recommended usage:Align with business SLA definitions rather than technical limits.
1.3 – ESS Job Health Signal Calculations
This section explains how each analytical signal is derived, why it exists, and how it contributes to job health and alerting decisions.
1.3.1 – AVG_RUNTIME_MINUTES
Average runtime of successful executions within the monitoring window.
How It Is Calculated
AVG(runtime_minutes) WHERE state = SUCCESS AND PROCESSSTART between FROM and TO
Usage
- Short-term performance tracking
- Drift detection
1.3.2 – STDDEV_RUNTIME_MINUTES
Runtime variability within the window.
How It Is Calculated
STDDEV(runtime_minutes) WHERE state = SUCCESS
Usage
- Stability analysis
- Volatility detection
1.3.3 – AVG_RUNTIME_BASELINE_MIN
Long-term historical average runtime.
How It Is Calculated
AVG(runtime_minutes) WHERE state = SUCCESS AND PROCESSSTART <= TO_TIMESTAMP
Usage
- SLA baseline
- Performance expectations
1.3.4 – P95_RUNTIME_BASELINE_MIN
Upper runtime bound for normal behavior.
How It Is Calculated PERCENTILE_CONT(0.95) WITHIN GROUP (ORDER BY runtime_minutes)
Usage
- SLA thresholds
- Stuck job detection
- SLA breach probability
1.3.5 – RUNTIME_TREND_SLOPE_PER_RUN
Indicates whether job runtime is:
• Increasing
• Decreasing
• Stable
How It Is Calculated REGR_SLOPE(runtime_minutes, run_sequence)
Interpretation
| Slope | Meaning |
| ≈ 0 | Stable |
| > 0 | Runtime increasing |
| < 0 | Runtime improving |
Usage
- Detects slow degradation
- Enables capacity planning
DERIVED STABILITY & BEHAVIOR SIGNALS
1.3.6 – RUNTIME_VOLATILITY_INDEX
How unstable job runtime is over time.
How It Is Calculated STDDEV_RUNTIME / AVG_RUNTIME
• Normalized
• Capped at 1.0 in downstream usage
Interpretation
| Value | Meaning |
| < 0.2 | Very stable |
| 0.2 – 0.5 | Moderate variance |
| > 0.5 | Highly unstable |
1.3.7 – RUNTIME_REGRESSION_STATUS
Detects performance degradation between consecutive runs.
How It Is Calculated
IF previous_runtime IS NULL
→ INSUFFICIENT_HISTORY
ELSE IF
last_runtime > previous_runtime × regression_factor
→ RUNTIME_REGRESSION
ELSE → NORMAL
(Default regression factor = 1.5)
Usage
- Early signal of data growth
Detects degradation before SLA breach
PROBABILITY SIGNALS
1.3.8 – PREDICTED_FAILURE_PROBABILITY
Likelihood that the next execution will fail.
How It Is Calculated failed_runs / total_runs
1.3.9 – SLA_BREACH_PROBABILITY
Represents the likelihood that future executions of an ESS job will exceed its historical SLA threshold
SLA_BREACH_PROBABILITY Meaning
| Value | Meaning |
| < 0.1 | Healthy |
| 0.1 – 0.3 | Watch |
| 0.3 – 0.5 | High risk |
| > 0.5 | Very likely to breach |
How It Is Calculated
IF runtime_minutes > P95_RUNTIME_BASELINE_MIN → SLA breach
SLA_BREACH_PROBABILITY = (Number of successful runs exceeding P95) ÷(Total successful runs)
Usage
- Identifies jobs trending toward SLA failure
- Enables proactive scaling or scheduling changes
1.3.10 – STUCK_JOB_PROBABILITY
Probability that a currently running job is hung.
How It Is Calculated
Compares current runtime against historical percentiles:
| Condition | Probability |
| Runtime > P95 | 0.9 |
| Runtime > P90 | 0.6 |
| Else | 0.1 |
Usage
- Percentile-based (job-specific)
- No hard-coded SLA assumptions
1.3.11 – JOB_RISK_SCORE
A composite health risk score representing the probability that a job will:
• Fail
• Miss SLA
• Become unstable
• Get stuck
Components & Weights
| Signal | Weight |
| Failure probability | 35% |
| SLA breach probability | 25% |
| Runtime volatility | 15% |
| Runtime trend magnitude | 15% |
| Stuck job probability | 10% |
Formula (Conceptual)
JOB_RISK_SCORE = 0.35 × failure_probability+ 0.25 × sla_breach_probability+ 0.15 × volatility_index+0.15 × abs(runtime_trend_slope)+ 0.10 × stuck_probability
Usage
- Single, explainable health number
- Easy alert prioritization
- Works across job types and frequencies
CONFIDENCE SIGNAL
1.3.12 – CONFIDENCE_SCORE_WEIGHTED
A numeric confidence score (0–1) used internally for:
• Threshold tuning
• Alert gating
• Observability & dashboards
How It Is Calculated
LEAST(total_runs / 10, 1) * 0.5 + (1 – LEAST(stddev_runtime / avg_runtime, 1)) * 0.3 + CASE WHEN trend_exists THEN 0.2 ELSE 0 END
Here we are combing three independent reliability signals.
Component 1: Execution history depth (50% weight)
LEAST(JS_HIST.TOTAL_RUNS / 10, 1) * 0.5
Meaning:
- More executions = more statistically reliable
- Saturates after 10 runs
| Total Runs | Contribution |
| 2 | 0.10 |
| 5 | 0.25 |
| ≥10 | 0.50 (max) |
Why 50%?
Because volume of evidence matters most.
Component 2: Runtime stability (30% weight)
(1 – LEAST(STDDEV_RUNTIME / AVG_RUNTIME, 1)) * 0.3
This measures how predictable the job runtime is.
STDDEV / AVG≈ coefficient of variation- High variation → less trust
- Stable runtimes → higher trust
| Runtime Behavior | Contribution |
| Very noisy | ~0 |
| Moderate | ~0.15 |
| Very stable | 0.30 (max) |
Why inverted (1 − …) ?
Because lower volatility = higher confidence
Component 3: Trend availability (20% weight)
CASE WHEN TC.RUNTIME_TREND_SLOPE IS NOT NULL THEN 0.2 ELSE 0 END
This answers:
“Do we have enough data to detect a meaningful trend?”
- If yes → +0.2
- If no → 0
Why binary?
Because trend analysis is either:
- statistically valid
- or not present at all
No half credit.
1.3.13 – CONFIDENCE_LEVEL
Indicates how reliable the computed health signals are for a job.
Confidence Level is a weighted reliability score that measures how trustworthy ESS job risk signals are, based on execution history depth, runtime stability, and trend availability, ensuring customers act only on statistically meaningful insights.
This prevents false positives for:
• New jobs
• Infrequently run jobs
• Highly unstable runtime patterns
Confidence Components & Weights
| Component | Weight | Meaning |
| Execution history depth | 50% | More runs = higher confidence |
| Runtime stability | 30% | Lower variance = higher confidence |
| Trend availability | 20% | Trend present = higher confidence |
Score Range Mapping
| Score Range | CONFIDENCE_LEVEL |
| ≥ 0.75 | HIGH |
| 0.40 – 0.74 | MEDIUM |
| < 0.40 | LOW |
HIGH → Strong history + stable + trend-aware
MEDIUM → Usable but watch carefully
LOW → Informational only
Why This Works
- Ensures predictions are based on enough data
- Automatically adapts as job history grows
- Eliminates alert noise for new jobs
1.4 – Alert Engine – Decision Logic & Design
The ESS Job Alert Engine evaluates each job’s execution health using a rule-based decision framework enriched with predictive analytics.
The engine combines:
- Hard operational signals (failures, stuck jobs, overdue schedules)
- Soft predictive signals (runtime regression, risk score, SLA breach probability)
- Confidence gating to avoid false positives
The output is a single actionable signal:
- ALERT_FLAG = ‘Y’ → Attention required
- ALERT_FLAG = ‘N’ → Job considered healthy
Alert Engine Design Principles
- Hard signals always win
- If a job is failing or stuck, alert immediately
- Predictive alerts require confidence
- Noisy signals are suppressed when historical data is weak
- Single primary alert reason
- Operators should see why an alert fired
- Severity reflects operational impact
- Not all alerts deserve the same urgency
1.4.1 – ALERT_FLAG – How the Alert Is Triggered
ALERT_FLAG is set to 'Y' if ANY of the following conditions are met.
A. Hard Signals (Immediate Alert)
These signals indicate current operational impact and do not require confidence checks.
A.1 Recent Failures
FAILURES_LAST_24_HOURS>0
- Job has failed at least once in the last 24 hours
Alert Behavior Severity = CRITICAL
A.2 Stuck Job Detection
STUCK_JOB_PROBABILITY>=:P_STUCK_JOB_PROBABILITY
(Default threshold = 0.8)
Meaning
- Running job has exceeded historical P95 runtime
- estimates the likelihood that a currently running job is abnormally over-running relative to its historical behavior, indicating a real-time execution risk that may require operational intervention
- For a job that is currently running, how likely is it that it will never complete normally – real-time, forward-looking, and state-aware.
- Strong indicator of hung threads, deadlocks, or data issues
Alert Behavior Severity = CRITICAL
A.3 Overdue Schedule
SCHEDULE_OVERDUE_FLAG='Y'
Meaning
- Scheduled job did not complete before its defined end time
- SLA breach or missed business cutoff
Alert Behavior Severity = HIGH
B. Predictive / Soft Signals (Confidence-Gated)
These signals predict future or latent risk and require sufficient historical confidence.
B.1 Confidence Gate
CONFIDENCE_LEVELIN('MEDIUM','HIGH')
Meaning
- Prevents alerting on new or unstable jobs
- Reduces false positives
B.2 Runtime Regression
RUNTIME_REGRESSION_STATUS='RUNTIME_REGRESSION'
Meaning
- Last runtime exceeds previous runtime by a regression factor
- Early sign of data growth or performance degradation
Alert Behavior Alert only if confidence is MEDIUM or HIGH
B3. High Composite Risk Score
JOB_RISK_SCORE>=:P_JOB_RISK_SCORE
(Default threshold = 0.6)
Meaning
- Combined risk across failures, SLA, volatility, trends, and stuck probability
- Represents overall job health deterioration
B3. SLA Breach Probability
SLA_BREACH_PROBABILITY>=:P_SLA_BREACH_PROBABILITY
(Default threshold = 0.4)
- Significant likelihood that future runs will exceed SLA
- How often a job historically violates its expected runtime SLA, providing a stable indicator of long-term performance risk.
- Proactive alert before SLA violations occur
- How likely is this job to run longer than what is considered normal for it?
- Based on past successful executions, how often does this job exceed its expected SLA?
ALERT_FLAG Logic
ALERT_FLAG = ‘Y’
IF
FAILURES_LAST_24_HOURS > 0
OR STUCK_JOB_PROBABILITY >= threshold
OR SCHEDULE_OVERDUE_FLAG = ‘Y’
OR ( CONFIDENCE_LEVEL IN (‘MEDIUM’,’HIGH’)
AND (RUNTIME_REGRESSION_STATUS = ‘RUNTIME_REGRESSION’
OR JOB_RISK_SCORE >= threshold
OR SLA_BREACH_PROBABILITY >= threshold
)
) ELSE ‘N’
1.4.2 – ALERT_REASON
How the Primary Reason Is Selected, Only one reason is emitted to keep alerts actionable, The most operationally urgent reason is always selected first.
Precedence Order (Top Wins)
- FAILURE
- STUCK
- SCHEDULE_OVERDUE
- RUNTIME_REGRESSION
- HIGH_RISK_SCORE
- SLA_RISK
CASE
WHEN FAILURES_LAST_24_HOURS > 0 THEN ‘FAILURE‘
WHEN STUCK_JOB_PROBABILITY >= threshold THEN ‘STUCK‘
WHEN SCHEDULE_OVERDUE_FLAG = ‘Y’ THEN ‘SCHEDULE_OVERDUE‘
WHEN RUNTIME_REGRESSION_STATUS = ‘RUNTIME_REGRESSION‘ THEN ‘RUNTIME_REGRESSION’
WHEN JOB_RISK_SCORE >= threshold THEN ‘HIGH_RISK_SCORE‘
WHEN SLA_BREACH_PROBABILITY >= threshold THEN ‘SLA_RISK‘ END
1.4.3 – ALERT_SEVERITY
How Severity Is Determined – Severity reflects business impact and urgency.
| Condition | Severity |
| Recent failures | CRITICAL |
| Stuck job | CRITICAL |
| Schedule overdue | HIGH |
| Risk score ≥ 0.75 | HIGH |
| Risk score ≥ 0.60 | MEDIUM |
| Predictive signals only | MEDIUM |
| No alert | LOW |
CASE
WHEN FAILURES_LAST_24_HOURS > 0 THEN ‘CRITICAL‘
WHEN STUCK_JOB_PROBABILITY >= threshold THEN ‘CRITICAL‘
WHEN SCHEDULE_OVERDUE_FLAG = ‘Y’ THEN ‘HIGH‘
WHEN JOB_RISK_SCORE >= 0.75 THEN ‘HIGH‘
WHEN JOB_RISK_SCORE >= 0.6 THEN ‘MEDIUM‘
ELSE ‘LOW’ END
1.5 – Report Design
These signals intentionally combine short-term windowed behavior with long-term historical baselines, ensuring that alerts are both timely and statistically grounded.
1.5.1 – Create BI Report
- Create Data Model using BI Report Query
- Refer – Creating the Data Model for the BI Publisher Report Extract
https://docs.oracle.com/en/cloud/saas/enterprise-performance-management-common/diepm/integrations_erp_asyn_datamodel.html - Refer – BI Data Model Query
- Refer – Creating the Data Model for the BI Publisher Report Extract
- Create Report Using Data Model
- Refer – Creating the BI Publisher Report Extract on high level steps.
https://docs.oracle.com/en/cloud/saas/enterprise-performance-management-common/diepm/integrations_erp_async_publisher.html , Use XSL Template For Report Layout, so reports generate XML data.
- Refer – Creating the BI Publisher Report Extract on high level steps.
To Access ESS Job data Via BIP, you would need – Service Account to Connect to Fusion, Service Account must have below roles to run report
| Role Name | Role Code |
| BI Consumer Role | BIConsumer |
| ESS Monitor Role | ESSMonitor |
You can create a new role, add these roles as child & assign ESS_Monitor to Service account user – you want to use for ESS Monitoring.
Role Name- ESS_Monitor
Role Category – Common – Abstract Roles
Refer – Give Setup Users Permissions to See All Scheduled Processes
After Creating role – Run Job – Import User and Role Application Security Data, Same user will be used for Fetching ESS Monitoring Data & would also be used in OIC for Authorization Code Flow
2 – OIC Layer
- Expose BI report via REST facade
- Normalize output
- Enforce security

2.1 – Prerequisites
Fusion BIP Report
- Data model uses SQL query
- Report returns XML output
- Report is tested in Fusion UI
OIC Connectivity
Note – We have used OAuth2.0 as better Security posture, however same can be done via basic authentication.
- SOAP Adapter configured using OAuth2.0 mechanism for Fusion BIP Webservice
- For OIC in Fusion Application Domain Follow
- Enabling OAuth 2.0 JWT Authentication for Oracle SOAP Services in OIC Gen3
Refer – https://www.ateam-oracle.com/enabling-oauth-20-jwt-authentication-for-oracle-soap-services-in-oic-gen3 - Pick – Using OAuth 2.0 Authorization Code
- Enabling OAuth 2.0 JWT Authentication for Oracle SOAP Services in OIC Gen3
- For OIC in External Application/Non FA Domain Follow
- Simplifying OAuth for OIC to Fusion Integrations: Authorization Code Across IAM Domains
Refer – https://www.ateam-oracle.com/simplifying-oauth-for-oic-to-fusion-integrations-authorization-code-across-iam-domains - Follow Approach 1 (Recommended)
Pick – Using OAuth 2.0 Authorization Code Flow
- Simplifying OAuth for OIC to Fusion Integrations: Authorization Code Across IAM Domains
- For OIC in Fusion Application Domain Follow
- OAuth2.0 Client Confidential App to access OIC End points securely from OCI Log Analytics
- Follow – Invoking Oracle Integration Cloud (OIC) APIs Using OAuth 2.0 (Client Credentials and Authorization Code) Across IAM Domains
Refer – https://www.ateam-oracle.com/invoking-oracle-integration-cloud-oic-apis-using-oauth-2-0-client-credentials-and-authorization-code-across-iam-domains - Pick – Client Credentials
- Follow – Invoking Oracle Integration Cloud (OIC) APIs Using OAuth 2.0 (Client Credentials and Authorization Code) Across IAM Domains
Schemas Available
- XSD for:
- BIP SOAP response
- Stage File read operation
- JSON request/response
- Request parameters
- Response payload.
Step 2.2 : Create App Driven Integration
- Navigate to Integrations → Insight → Integrations
- Click Create → App Driven Orchestration
- Provide:
- Integration Name
- Identifier
- Package
- Enable REST Adapter as trigger
This REST endpoint becomes the public API for your BIP report, please keep note of this end point as this will be used as Log End Point URL when creating Source in Log Analytics.
Step 2.3 : Configure REST Trigger (GetESSHealthInfo)
Define REST Contract
- HTTP Method: POST
- Media Type: application/json
- Request parameters:
- Response schema:
Step 2.4: Map REST Request to BIP SOAP Request
- Add Map action after trigger
- Source: REST request
- Target: BIP runReport SOAP request
Mapping includes:
- Report Path
- Report Name
- Report Parameters
- Output Format = xml
- P_FROM_TIMESTAMP
- P_TO_TIMESTAMP
- P_REGRESSION_FACTOR
- P_MIN_SUCCESS_RUNS
- P_STUCK_JOB_PROBABILITY
- P_JOB_RISK_SCORE
- P_SLA_BREACH_PROBABILITY
Step 2.5: Invoke BIP SOAP Service
- Add Invoke action
- Use Fusion Applications Adapter defined in prerequisites
- Select BI Publisher Service
- Operation: runReport
SOAP response is returned with:
- reportBytes (Base64 encoded XML)
Step 2.6: Write SOAP XML to Stage File (Opaque Handling)
- Add Map → Stage File (Write)
- Provide:
- File name (dynamic or static)
- Directory
- Map:
- Base64 decoded reportBytes → file content
- Use Opaque Schema XSD, required because
- SOAP payload cannot be directly mapped
- OIC treats it as unstructured XML
- Refer – https://docs.oracle.com/en/cloud/paas/application-integration/integrations-user/use-stage-file-write-operation-opaque-schema.html
Step 2.7: Read Stage File using Structured XSD
- Add Stage File → Read File
- Associate Custom XSD that matches BIP XML structure
- OIC interprets XML as structured data
Step 2.8: Map BIP XML to REST Response
- Add Map action
- Source:
- Stage file read output (XSD-based)
- Target:
- REST response XSD
Step 2.9: Return REST Response
- Final map sends transformed payload back
- REST client receives:
- Clean JSON
Step 2.10: Activate Integration & Test API
- Set Tracking Variables
- Save & Activate Integration
- Integration End Point URL
- Test API in OIC & Postman
3 – OCI Logging Analytics
3.1 – Prerequisites
- OCI tenancy with Log Analytics enabled
- Following IAM Policies are required to enable Log to analytics & allow for Log Collection, you need to setup these policies accordingly to your OCI governance requirements.
- Enable Access to Log Analytics and Its Resources
- Allow Continuous Log Collection Using Management Agents
Process flow – Management Agent ↓ Calls OIC REST API (POST) ↓ OAuth token fetched using Source Credential ↓ JSON parsed by Fusion_ESS_Job_Health_JSON_Parser ↓ Records stored in Log Group ↓ Entity = Fusion_ESS_Job_Health -> Dashboards / Alerts
Follow Quick Links to jump over topics
- Create Management Agent
- Update Management Agent
- Create Log Group
- Create Log Parser
- Create Log Source
- Create Credential File
- Create Entity
- Associate Source to Entity
- Verify
STEP 3.1 – Create Management Agent
We need to provision compute VM Instance on which Management Agent runs, this Management Agent will eventually poll REST Endpoints for continuous log collection.
VM Creation
- Name – fusion-mgmt-agent-01 (You can keep name as per your conventions)
- Shape: VM.Standard.E4.Flex
- OS: Oracle Linux 8
- Network:
- Private subnet preferred
- Internet access or NAT required
- Open outbound HTTPS (443)
- Allows Ingress Access to Port (22 )
- Check for Addition of Management Agent.
Follow below Guidance for configuration of VM
- Generic Prerequisites for Deploying Management Agents >> Operating System Requirements
https://docs.oracle.com/en-us/iaas/management-agents/doc/perform-prerequisites-deploying-management-agents.html
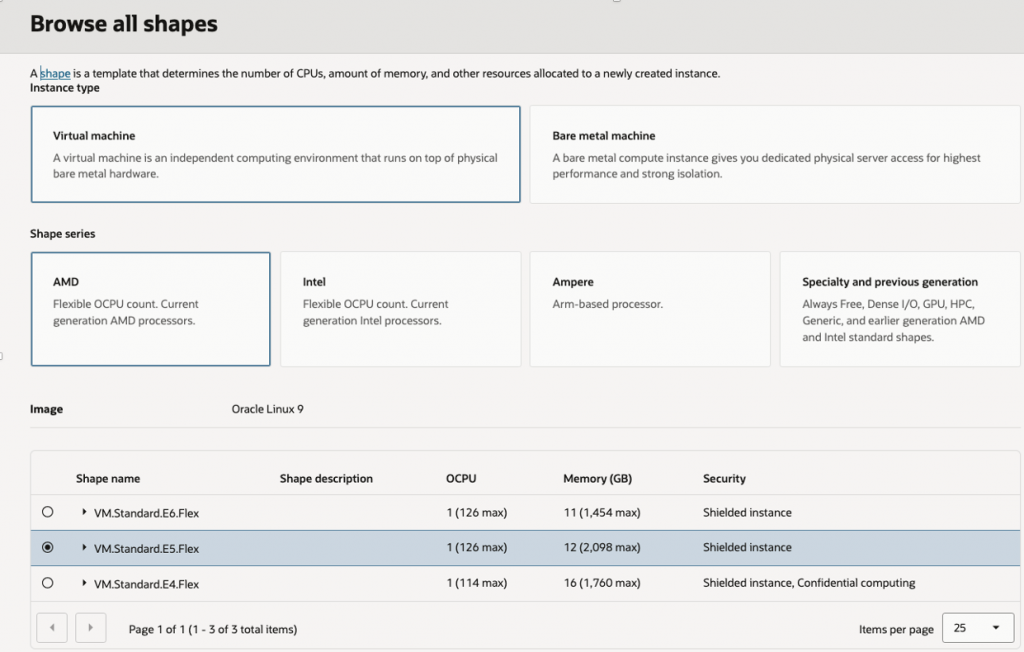
Compute
- VM.Standard.E5.Flex
- 1–2 OCPUs
- 12–16 GB RAM
- Oracle Linux 9
- Add – Management Agent , Optionally OS Management Hub Agent
Select Management Agent in Oracle Cloud Agent , optionally add – OS Management Hub Agent to Automate Management and monitor updates and patches for the operating system environment on the instance.
In case you choose – OS Management Hub Agent, then you need to choose Profile – Profile which matches with OS details, if it not there you can create new profile
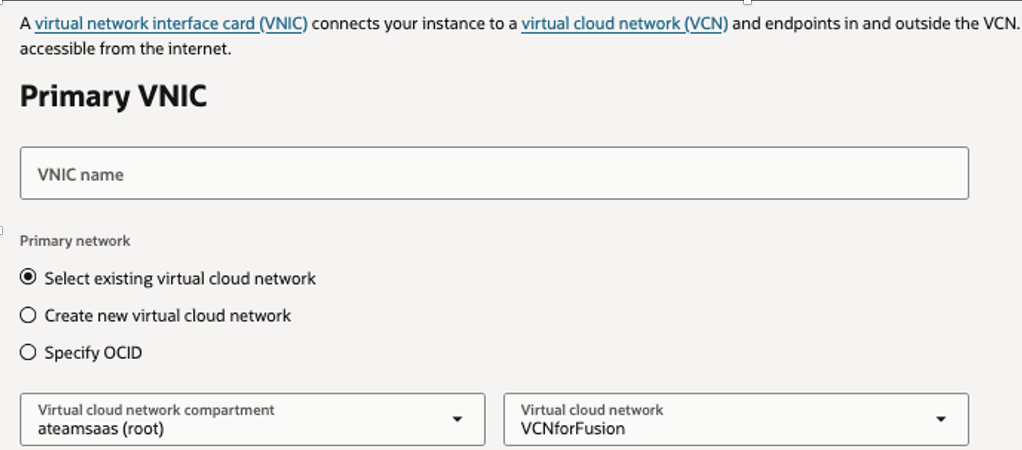
Network – Select VCN which allows Ingress Access to Port 22 for compute SSH access
Download Key Pairs so you can use that to connect to compute.
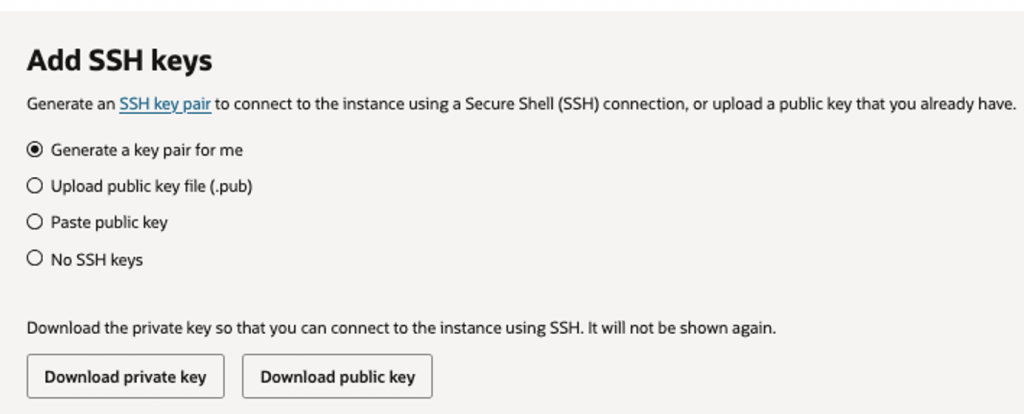
Finally Press – Create Button to submit provision request & wait for instance to be in active state.
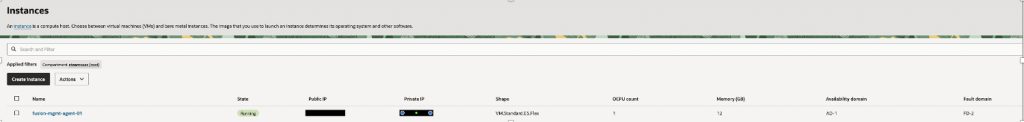
Keep Note of Management Agent Name & Public IP, in our case it is – fusion-mgmt-agent-01, this will be used later while creating Entity in next steps.
STEP 3.2 – Update Management Agent
Update management Agent to Enable REST API Collection method.
Open Terminal & SSH to Compute
ssh -i /path/to/your_private_key.pem opc@PUBLIC_IP_OF_COMPUTEValidate Agent is Running, below command should return Active.
systemctl is-active oracle-cloud-agentStarts an interactive Bash shell as the user oracle-cloud-agent
sudo -u oracle-cloud-agent /bin/bashAccess Agent configuration File
cd /var/lib/oracle-cloud-agent/plugins/oci-managementagent/polaris/agent_inst/configEdit Agent Configuration File to Enable REST API Collection.
vi emd.properties Go to Enter Mode in Vi Editor & Paste below lines in End to allows REST API–based log collection
loganalytics.rest_api.enable_oci_api=true
loganalytics.rest_api.report_interval=600
Verify If lines are added
grep loganalytics.rest_api emd.propertiesRestart the Management Agent so the change takes effect
sudo systemctl restart oracle-cloud-agent Validate if Agent is Active and running
sudo systemctl status oracle-cloud-agentSTEP 3.3 – Create Log Group
For Logical isolation for ESS monitoring data
OCI Console → Log Analytics
Log Groups → Create
Name: Fusion_ESS_Job_Health_Log_Group
STEP 3.4 – Create Log Parser
Parses ESS Job Health REST API response from OIC
Log Analytics → Administration → Parsers → Create Parser– JSON Parser
| Field | Value |
| Name | Fusion_ESS_Job_Health_JSON_Parser_V5 |
| Type | JSON |
| Example Log Content | Sample JSON Rest Response |
| Log Entry JSON Path | $Jobs |
| Log Entry Type | ARRAYOBJECT |
Sample JSON Rest Response Structure –
REST API response
 ├── meta             ignored by parser
 └── jobs[]           each element = 1 log entry
       ├── runtime
       ├── executionStats
       ├── alert
       └── schedule
Note – Map Attribute “requestEventTime” to Log Analytics Standard Time, this column would be used by log analytics to collect data in incremental way using Time Intervals.
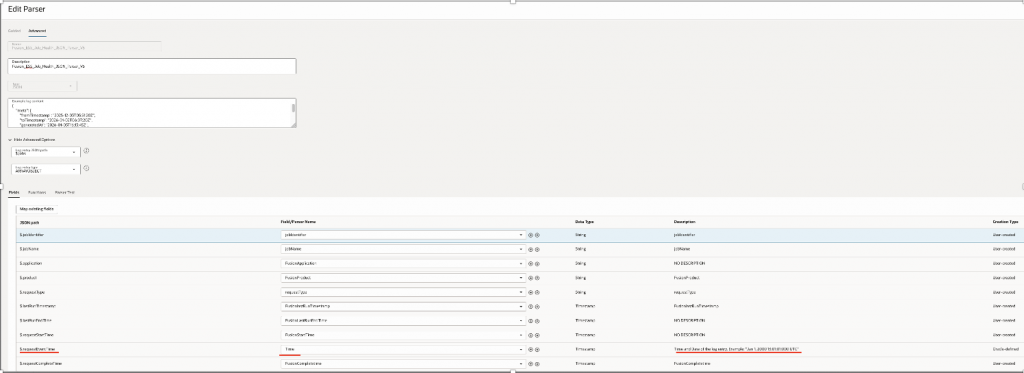
Refer Mapping as below –
| JSON Path | Log Analytics Field | Data Type | Creation Type |
| $.jobIdentifier | jobIdentifier | STRING | User-created |
| $.jobName | jobName | STRING | User-created |
| $.application | FusionApplication | STRING | User-created |
| $.product | FusionProduct | STRING | User-created |
| $.requestType | requestType | STRING | User-created |
| $.requestEventTime | Time | TIMESTAMP | Oracle-defined |
| $.requestStartTime | FusionStartTime | TIMESTAMP | User-created |
| $.requestCompleteTime | FusionCompletetime | TIMESTAMP | User-created |
| $.lastRunTimestamp | FusionlastRunTimestamp | TIMESTAMP | User-created |
| $.lastRunEndTime | FusionLastRunEndTime | TIMESTAMP | User-created |
| $.lastSuccessTimestamp | FusionlastSuccessTimestamp | TIMESTAMP | User-created |
| $.runtime.lastRuntimeMinutes | lastRuntimeMinutes | DOUBLE | User-created |
| $.runtime.previousRuntimeMinutes | previousRuntimeMinutes | DOUBLE | User-created |
| $.runtime.avgRuntimeBaselineMinutes | avgRuntimeBaselineMinutes | DOUBLE | User-created |
| $.runtime.p95RuntimeBaselineMinutes | p95RuntimeBaselineMinutes | DOUBLE | User-created |
| $.runtime.runtimeVolatilityIndex | runtimeVolatilityIndex | DOUBLE | User-created |
| $.runtime.runtimeTrendSlopePerRun | runtimeTrendSlopePerRun | DOUBLE | User-created |
| $.runtime.runtimeRegressionStatus | runtimeRegressionStatus | STRING | User-created |
| $.executionStats.totalRuns | totalRuns | LONG | User-created |
| $.executionStats.succeededRuns | succeededRuns | LONG | User-created |
| $.executionStats.failedRuns | failedRuns | LONG | User-created |
| $.executionStats.runningRuns | runningRuns | LONG | User-created |
| $.executionStats.blockedRuns | blockedRuns | LONG | User-created |
| $.executionStats.cancelledRuns | cancelledRuns | LONG | User-created |
| $.executionStats.warningRuns | warningRuns | LONG | User-created |
| $.executionStats.adhocCount | adhocCount | LONG | User-created |
| $.executionStats.scheduledCount | scheduledCount | LONG | User-created |
| $.executionStats.queuePressure | queuePressure | LONG | User-created |
| $.executionStats.avgRuntimeMinutes | avgRuntimeMinutes | DOUBLE | User-created |
| $.executionStats.stddevRuntimeMinutes | stddevRuntimeMinutes | DOUBLE | User-created |
| $.failureMetrics.failuresLast24Hours | failuresLast24Hours | LONG | User-created |
| $.failureMetrics.failuresLast7Days | failuresLast7Days | LONG | User-created |
| $.failureMetrics.predictedFailureProbability | predictedFailureProbability | DOUBLE | User-created |
| $.slaMetrics.slaBreachProbability | slaBreachProbability | DOUBLE | User-created |
| $.runningState.currentlyRunningCount | currentlyRunningCount | LONG | User-created |
| $.runningState.maxRunningDurationHours | maxRunningDurationHours | DOUBLE | User-created |
| $.runningState.stuckJobProbability | stuckJobProbability | DOUBLE | User-created |
| $.runningState.longestRunningRequestId | longestRunningRequestId | STRING | User-created |
| $.confidence.confidenceLevel | confidenceLevel | STRING | User-created |
| $.confidence.confidenceScoreWeighted | confidenceScoreWeighted | DOUBLE | User-created |
| $.risk.jobRiskScore | jobRiskScore | DOUBLE | User-created |
| $.schedule.scheduleStartTime | scheduleStartTime | TIMESTAMP | User-created |
| $.schedule.scheduleEndTime | scheduleEndTime | TIMESTAMP | User-created |
| $.schedule.scheduleFrequency | scheduleFrequency | STRING | User-created |
| $.schedule.scheduleInterval | scheduleInterval | LONG | User-created |
| $.schedule.scheduleEndedFlag | scheduleEndedFlag | STRING | User-created |
| $.schedule.scheduleOverdueFlag | scheduleOverdueFlag | STRING | User-created |
| $.schedule.highFrequencyScheduleFlag | highFrequencyScheduleFlag | STRING | User-created |
| $.requests.lastRequestId | lastRequestId | LONG | User-created |
| $.requests.lastSuccessRequestId | lastSuccessRequestId | LONG | User-created |
| $.requests.lastFailedRequestId | lastFailedRequestId | LONG | User-created |
| $.requests.RequestId | FusionRequestID | LONG | User-created |
| $.requests.parentRequestId | FusionParentRequestID | LONG | User-created |
| $.requests.processGroup | FusionProcessGroup | STRING | User-created |
| $.requests.submitter | FusionSubmitter | STRING | User-created |
| $.alert.alertFlag | alertFlag | STRING | User-created |
| $.alert.alertSeverity | JobAlertSeverity | STRING | User-created |
| $.alert.alertReason | alertReason | STRING | User-created |
| $.additionalInfo.attributeName1 | attributeName1 | STRING | User-created |
| $.additionalInfo.attributeVal1 | attributeVal1 | STRING | User-created |
| $.additionalInfo.attributeName2 | attributeName2 | STRING | User-created |
| $.additionalInfo.attributeVal2 | attributeVal2 | STRING | User-created |
| $.additionalInfo.attributeName3 | attributeName3 | STRING | User-created |
| $.additionalInfo.attributeVal3 | attributeVal3 | STRING | User-created |
| $.additionalInfo.attributeName4 | attributeName4 | STRING | User-created |
| $.additionalInfo.attributeVal4 | attributeVal4 | STRING | User-created |
| $.additionalInfo.attributeName5 | attributeName5 | STRING | User-created |
| $.additionalInfo.attributeVal5 | attributeVal5 | STRING | User-created |
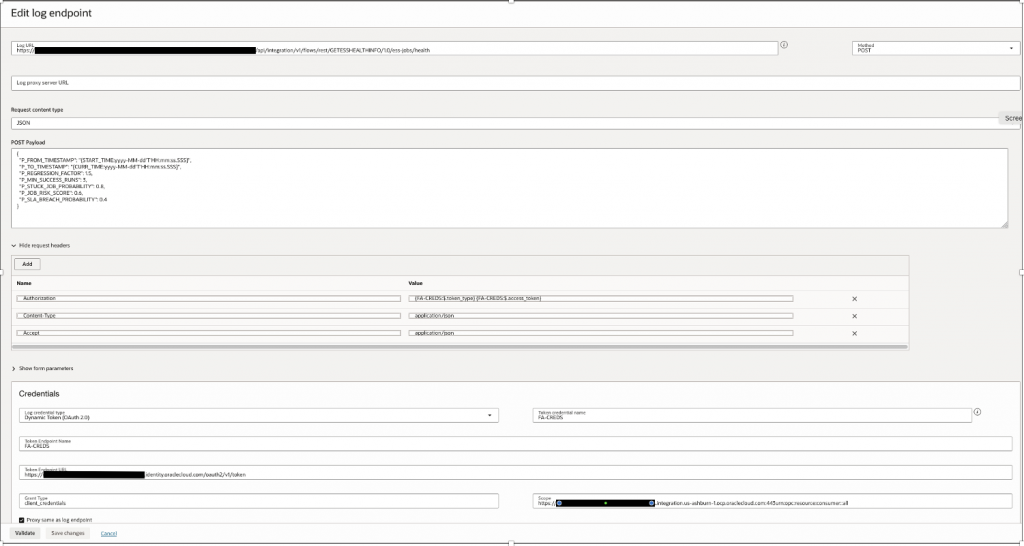
STEP 3.5 – Create Log Source
We will Create Logging Analytics REST Source.
Refer – How to set Credentials, Time Parameters as bind variable, refer –
https://docs.oracle.com/en-us/iaas/log-analytics/doc/rest-api-log-collection.html
Log Analytics → Administration → Sources → Create Source
| Field | Value |
| Name | Fusion_ESS_Job_Health_Source_V30 |
| Source Type | REST API |
| Entity Types | OIC Integration |
| Parser | Fusion_ESS_Job_Health_JSON_Parser_V5 |
Log End Point
Log URL – OIC API End point, refer Step 2.2 : Create App Driven Integration
For Example – https://<OICURL>/ic/api/integration/v1/flows/rest/GETESSHEALTHINFO/1.0/ess-jobs/health
Credentials
| Field | Value |
| Log Credentials Type | Dynamic Token(OAuth2.0) |
| Token End Point Name | FA-CREDS |
| Token End Point URL | https://<idcsURL>/oauth2/v1/token |
| Grant Type | client_credentials |
| Scope | https://<OICURL>:urn:opc:resource:consumer::all |
Method – POST
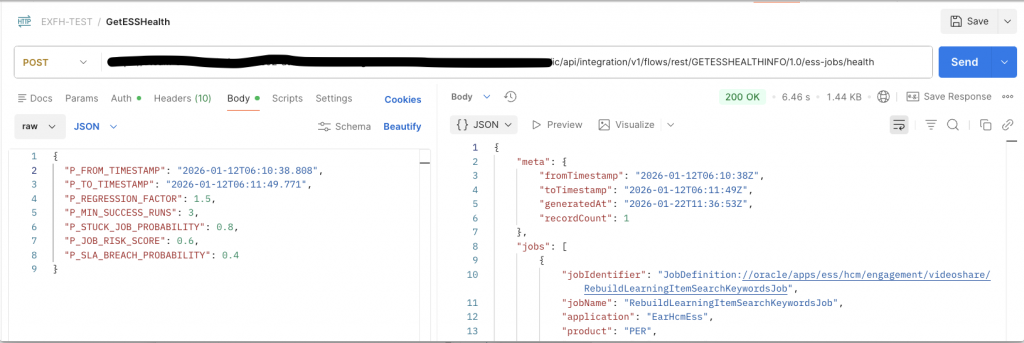
Request Payload –
Here in P_FROM_TIMESTAMP & P_TO_TIMESTAMP, we are passing Log analytics standard Macros – START_TIME & CURR_TIME with precision of millisecond in date format, as many ESS Jobs would complete within same second however may exceed in milliseconds.
Therefore for accuracy & to account for any overlaps – we don’t want same Jobs data to be collected in next runs, millisecond precision is important, please refer how START_TIME is computed, this is very important to understand how incremental data is collected over each collection runs with moving time window.
The default value of START_TIME is 30 days, that is, the value of the timestamp is 30 days earlier than the current timestamp.
For remaining parameters please refer 1.2 – Query Parameters Section, how they are set as per requirements.
{
  "P_FROM_TIMESTAMP": "{START_TIME:yyyy-MM-dd'T'HH:mm:ss.SSS}",
  "P_TO_TIMESTAMP": "{CURR_TIME:yyyy-MM-dd'T'HH:mm:ss.SSS}",
  "P_REGRESSION_FACTOR": 1.5,
  "P_MIN_SUCCESS_RUNS": 3,
  "P_STUCK_JOB_PROBABILITY": 0.8,
  "P_JOB_RISK_SCORE": 0.6,
  "P_SLA_BREACH_PROBABILITY": 0.4
}
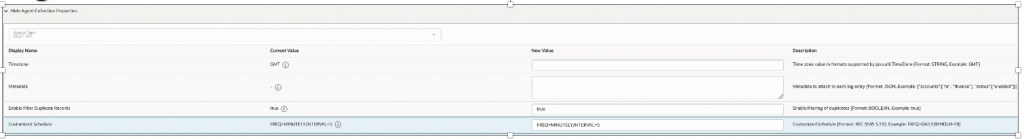
Agent Collection Properties
Set Duplicate as True – This will remove any duplicates collected over time.
Scheduler as 5 minutes or 10 Minutes per your requirements, should not exceed large time intervals for good near real time monitoring & low data volumne.
STEP 3.6 – Create Credential File for REST Access
This is additional step where OAuth2.0 Confidential App Client ID & Secret is saved as credentials inside management agent , as we don’t want them to be exposed over UI.
Note – We have used OAuth2.0 as better Security posture, however same can be done via basic authentication.
Refer – Examples of Credential JSON
Configure OAuth2.0 credential file on agent, Open Terminal & SSH to Compute
ssh -i /path/to/your_private_key.pem opc@PUBLIC_IP_OF_COMPUTECreate FA-CREDS.json
vi /tmp/FA-CREDS.jsonAdd below Information, change value of HTTPSUserName & HTTPSPassword for OAuth2.0 Client ID and Secret , this Connection is from OCI Log Analytics to OIC
This is OAuth2.0 Client Confidential App configured to access OIC End points securely from OCI log analytics
[
 {
      "source": "lacollector.la_rest_api",
      "name": "FA-CREDS",
      "type": "HTTPSBasicAuthCreds",
      "description": "These are HTTPS (BasicAuth) credentials.",
      "properties":
      [
          {
              "name": "HTTPSUserName",
              "value": "oauth2.0clientid"
          },
          {
              "name": "HTTPSPassword",
              "value": "oauth2.0clientsecret""
          }
      ]
  }
]
Upload Credentials –
cat /tmp/FA-CREDS.json | sudo -u oracle-cloud-agent /var/lib/oracle-cloud-agent/plugins/oci-managementagent/polaris/agent_inst/bin/credential_mgmt.sh -o upsertCredentials -s loganIt should return with message – Credentials Uploaded.
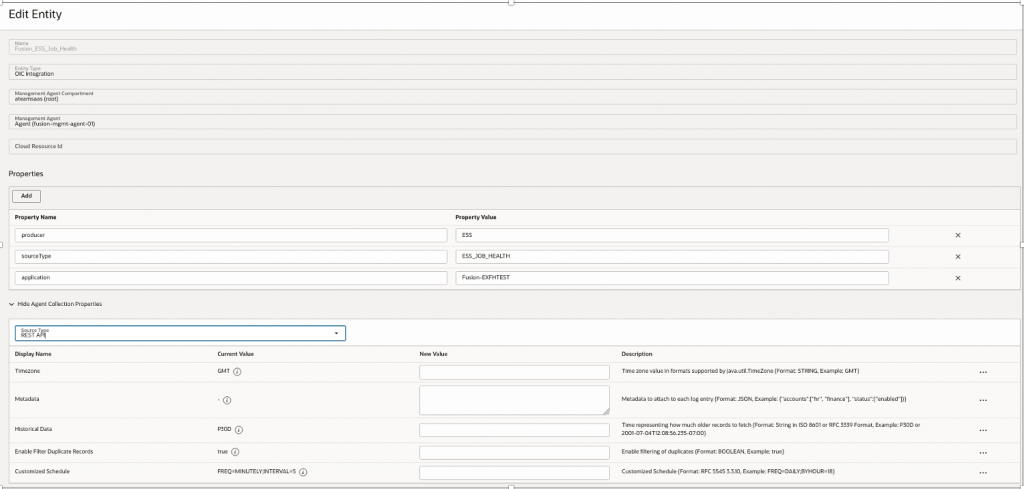
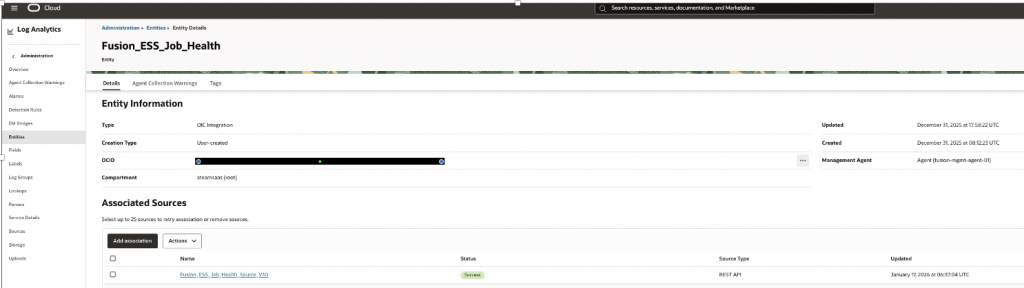
STEP 3.7 – Create Entity
Entity sits over Management Agent & Associate with Source to pull data
| Property Name | Property Value |
| Name | Fusion_ESS_Job_Health |
| Entity Type | OIC Integration |
| Management Agent | Fusion-mgmt-agent-01 |
| Source Type | REST API |
| >>Add New Properties | |
| Producer | ESS |
| SourceType | ESS_JOB_HEALTH |
| application | FusionInstanceName |
STEP 3.8 – Associate Source to Entity
Go to Entity And Press Button – Add Association, to add Source to Entity.
STEP 3.9 – Verify if Entity has started polling REST API
Go to Log Explorer & execute below search Search Query, data should start flowing in sometime, usually as per polling frequency (ie..5 Minutes in our case)
'Log Source' = Fusion_ESS_Job_Health_Source_V30 | timestats count as logrecords by 'Log Source' | sort -logrecords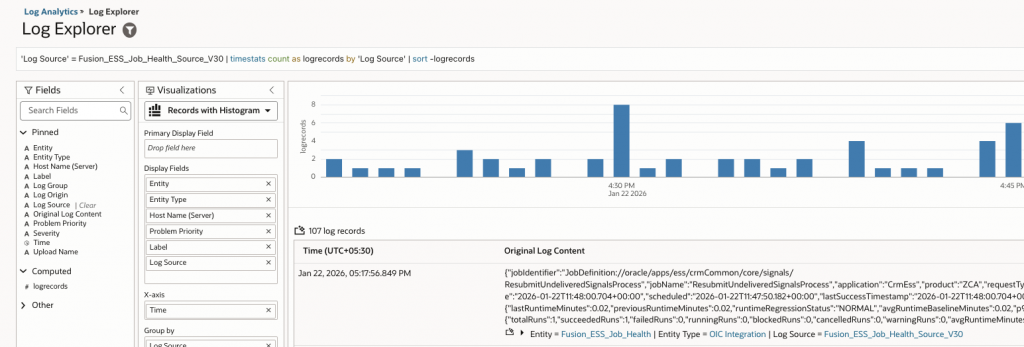
If data doesn’t flows into then you might need to troubleshoot, if credentials are working or for any other failures, check for any Management Agent log collection warning on source or entity page.
https://docs.oracle.com/en-us/iaas/log-analytics/doc/view-agent-collection-warnings.html
4 – Create Widgets & OCI Dashboards
Once data start flowing in Log analytics , we can start building Widgets.
This section documents the widgets used to build the ESS Job Health & Risk Observatory. Each widget is derived from OCI Log Analytics saved searches on the Fusion_ESS_Job_Health_Source_V30 log source and visualized on OCI Dashboards to provide operational, statistical, and predictive visibility into Fusion ESS jobs & shows Unified operational, statistical, and predictive visibility, combining windowed execution signals with long-term behavioral risk indicators.
Once these Widgets are created , they can be saved over OCI Dashboard.
OCI Logging Analytics dashboards support automatic refresh at configurable intervals.You can set the refresh interval (e.g., every 1 min, 5 min, 15 min) depending on your log ingestion frequency.
Build Widgets as Saved Query – Visualize Data Using Charts and Controls
https://docs.oracle.com/en-us/iaas/log-analytics/doc/visualize-data-using-charts-controls.html
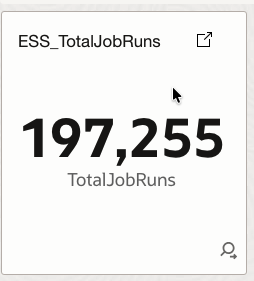
4.1 ESS_TotalJobRuns
Displays the total number of ESS job executions within the selected time window.
How it helps
Provides a baseline activity indicator to understand overall ESS workload volume and execution intensity over time.
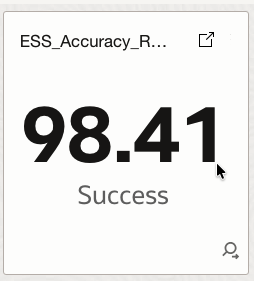
4.2 ESS_Accuracy_Rate
Calculates a weighted execution accuracy score using successful and warning runs relative to total runs.
How it helps
Shows how reliably and predictably ESS jobs are executing, offering a high-level service quality indicator.
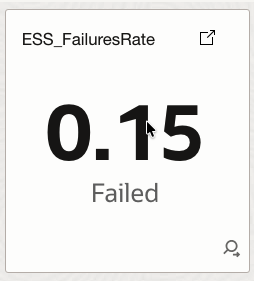
4.3 ESS_FailuresRate
Represents the percentage of failed job executions compared to total executions.
How it helps
Quantifies failure prevalence and supports early detection of systemic execution issues.
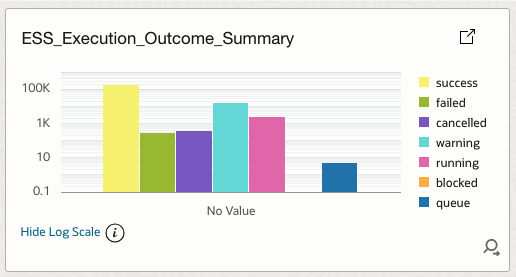
4.4 ESS_Execution_Outcome_Summary
Aggregates all execution outcomes including success, failure, warning, cancelled, running, blocked, and queue pressure.
How it helps
Provides an at-a-glance reliability posture and supports failure monitoring and operational health reviews.
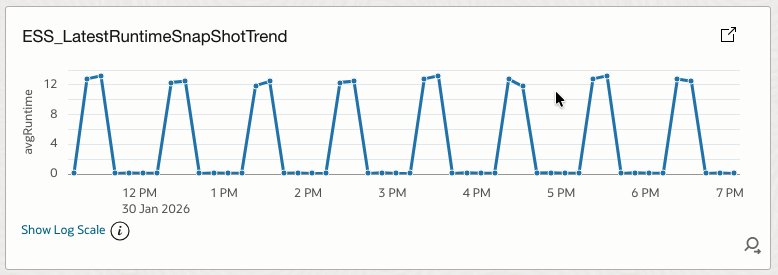
4.5 ESS_LatestRuntimeSnapShotTrend
Shows the average ESS job runtime trend over time.
How it helps
Enables capacity and performance planning while exposing early signs of runtime degradation.
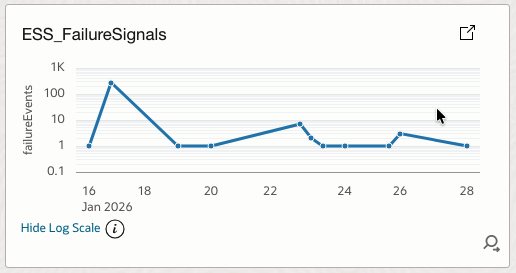
4.6 ESS_FailureSignals
Tracks the number of failure events per time bucket.
How it helps
Highlights failure spikes and correlates them with deployments, load, or infrastructure events.
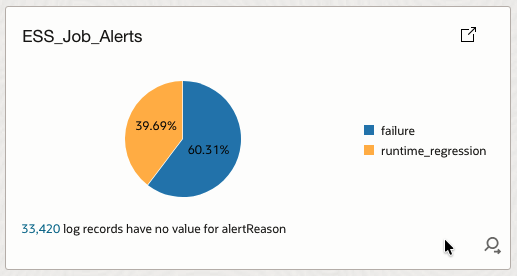
4.7 ESS_Job_Alerts
Summarizes active alerts grouped by alert reason.
How it helps
Explains why alerts are firing and helps justify predictive alerting models to stakeholders.
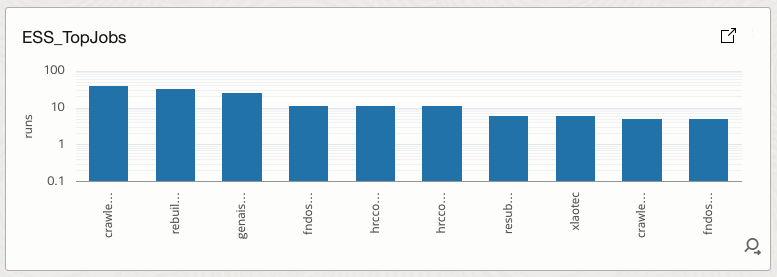
4.8 ESS_TopJobs
Ranks ESS jobs by total execution volume.
How it helps
Identifies high-volume jobs that have the greatest operational impact if they fail.
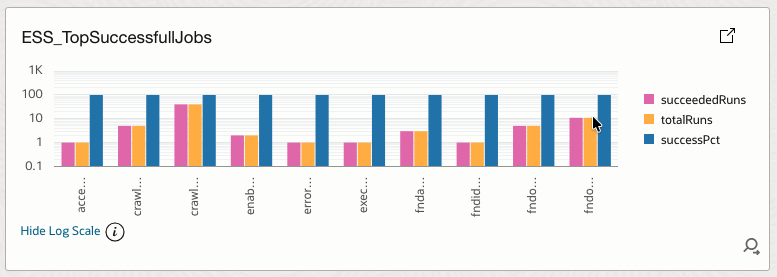
4.9 ESS_TopSuccessfullJobs
Lists jobs with consistently high success percentages.
How it helps
Highlights stable and well-behaved jobs that can serve as operational baselines.
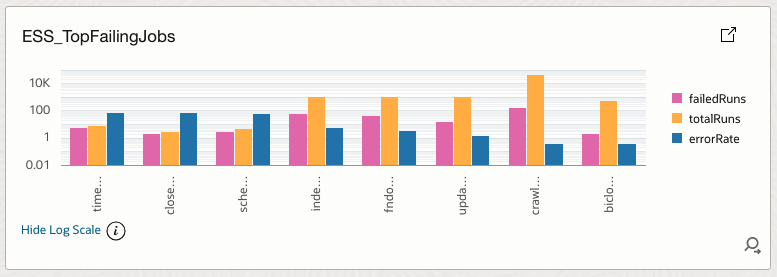
4.10 ESS_TopFailingJobs
Ranks jobs by error rate derived from failed runs versus total runs.
How it helps
Directs attention to jobs contributing most to failures and instability.
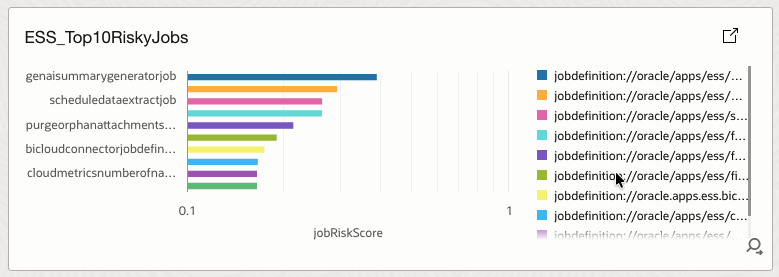
4.11 ESS_Top10RiskyJobs
Displays the top ten jobs with the highest composite job risk score.
How it helps
Surfaces jobs with elevated risk driven by failure probability, SLA exposure, runtime volatility, trends, and stuck-job probability.
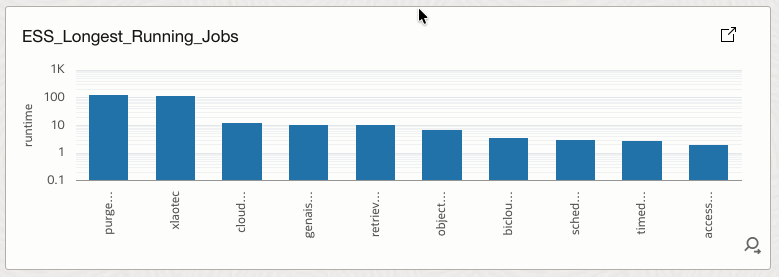
4.12 ESS_Longest_Running_Jobs
Identifies jobs with the highest execution runtimes.
How it helps
Supports bottleneck analysis and capacity planning by highlighting long-running workloads.
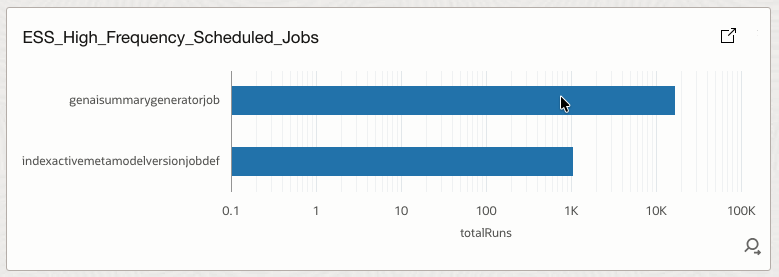
4.13 ESS_High_Frequency_Scheduled_Jobs
Shows jobs that are scheduled to run very frequently.
How it helps
Helps identify scheduling inefficiencies and potential resource saturation risks.
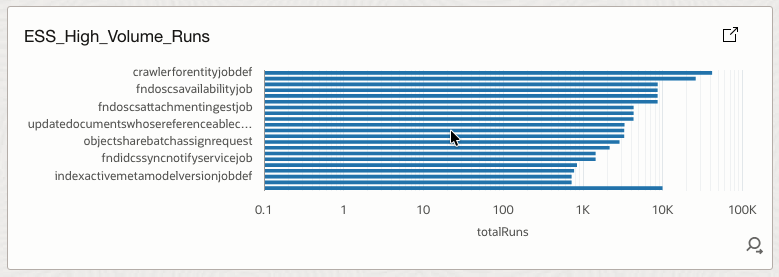
4.14 ESS_High_Volume_Runs
Highlights jobs with extremely high execution counts.
How it helps
Exposes latent systemic risks where small defects multiplied by massive volume can cause outages.
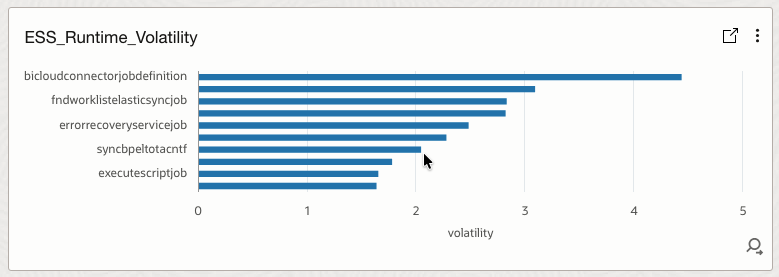
4.15 ESS_Runtime_Volatility
Measures runtime instability using a volatility index.
How it helps
Predicts failure likelihood and supports anomaly detection based on runtime behavior.
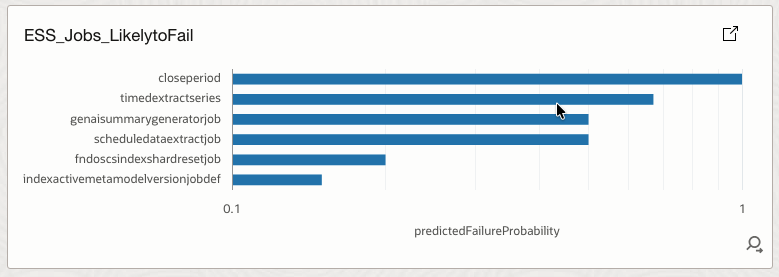
4.16 ESS_Jobs_LikelytoFail
Lists jobs with high predicted failure probability.
How it helps
Enables proactive remediation before actual job failures occur.
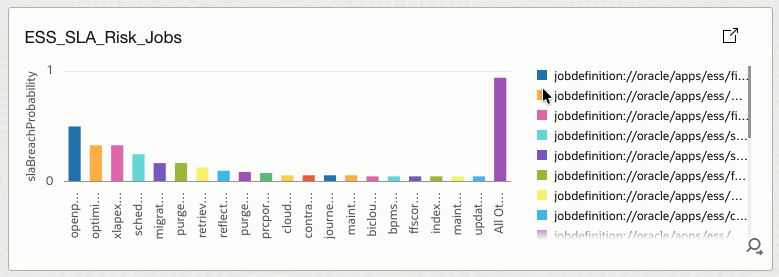
4.17 ESS_SLA_Risk_Jobs
Displays jobs with elevated SLA breach probability.
How it helps
Supports SLA protection by identifying workloads at risk of breaching runtime commitments.
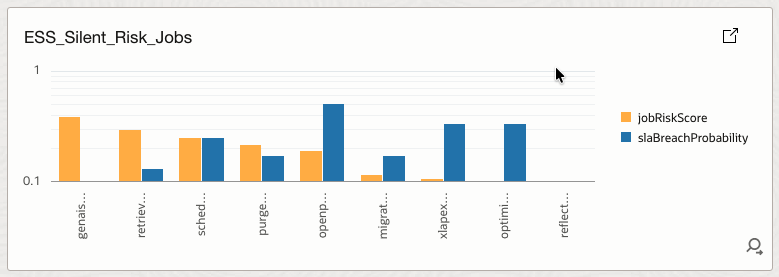
4.18 ESS_Silent_Risk_Jobs
Identifies jobs with high predicted risk despite no recent failures.
How it helps
Detects hidden risks that traditional failure-based monitoring would miss.
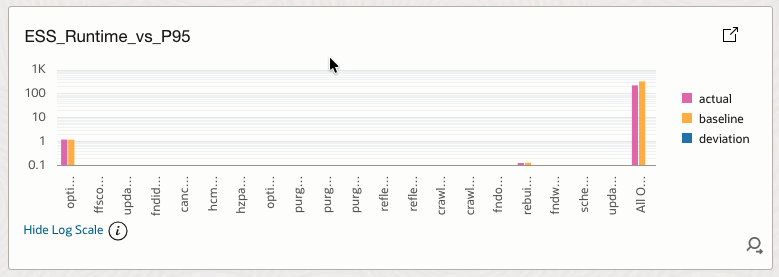
4.19 ESS_Runtime_vs_P95
Compares current runtime against historical P95 baseline.
How it helps
Detects SLA drift and performance degradation over time.
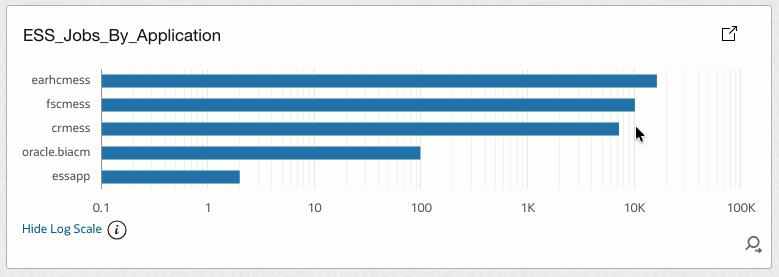
4.20 ESS_Jobs_By_Application
Aggregates ESS jobs by Fusion application or module.
How it helps
Helps teams understand workload distribution across business domains.
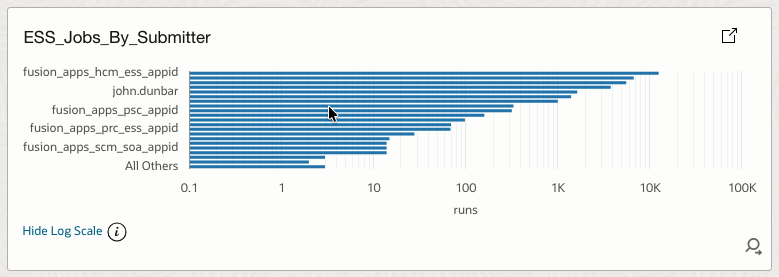
4.21 ESS_Jobs_By_Submitter
Groups job executions by submitter.
How it helps
Identifies noisy service accounts, rogue integrations, and accountability gaps.
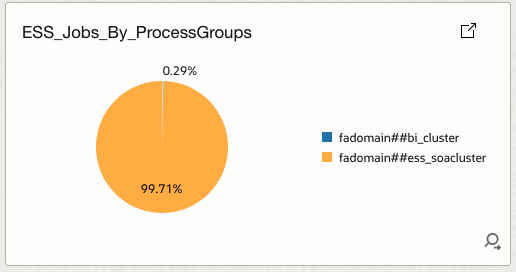
4.22 ESS_Jobs_By_ProcessGroups
Displays job distribution by process group.
How it helps
Supports infrastructure correlation with CPU usage, JVM pressure, and SOA congestion.
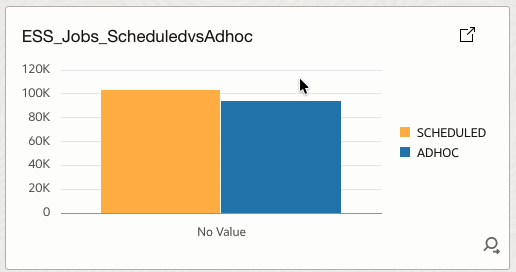
4.23 ESS_Jobs_ScheduledvsAdhoc
Compares scheduled versus ad-hoc job executions.
How it helps
Detects uncontrolled ad-hoc usage and supports governance and change management.
4.24 ESS_Risk_Distribution
Categorizes jobs into risk buckets based on job risk score.
How it helps
Shows where operational risk is concentrated and whether it is driven by instability or SLA exposure.

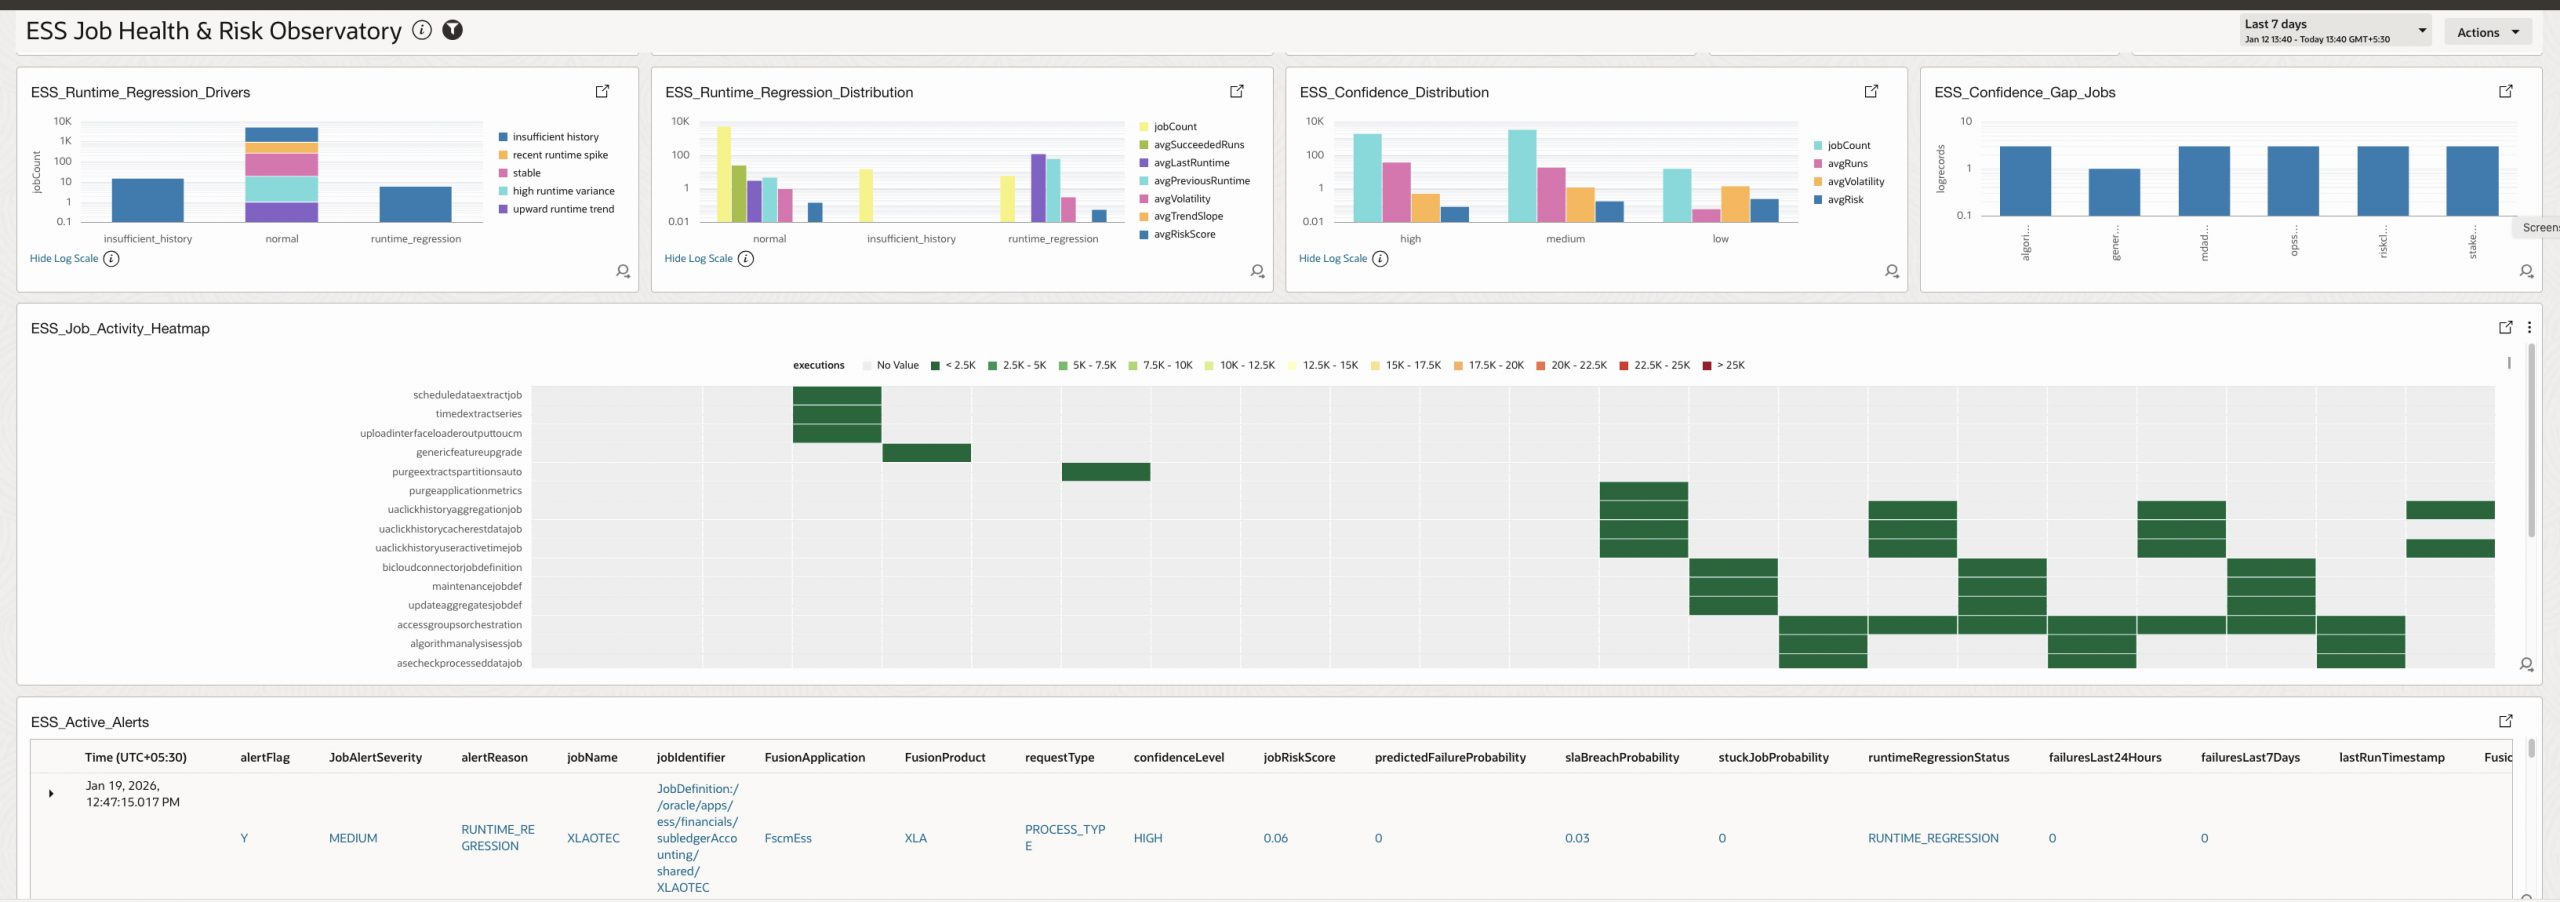
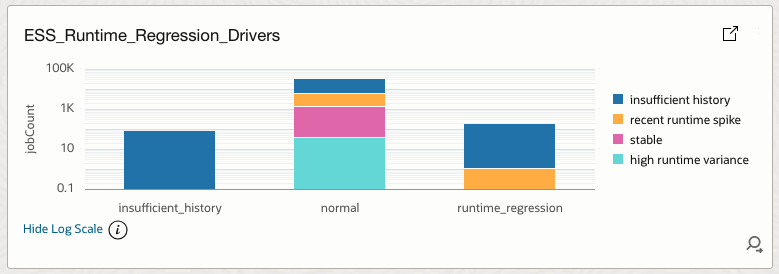
4.25 ESS_Runtime_Regression_Drivers
Explains why jobs are classified as normal, regressed, or insufficient history.
How it helps
Provides root causes behind runtime regression classifications.
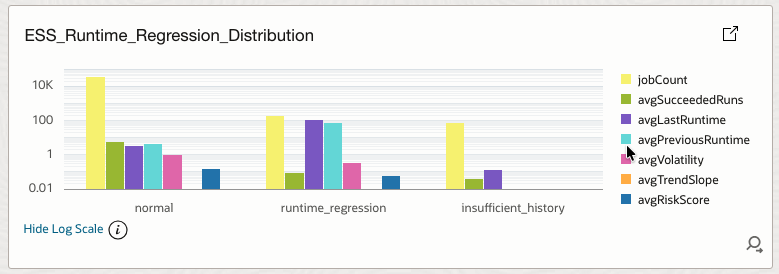
4.26 ESS_Runtime_Regression_Distribution
Distributes jobs by runtime regression status with supporting metrics.
How it helps
Detects performance decay patterns and baseline deviations.
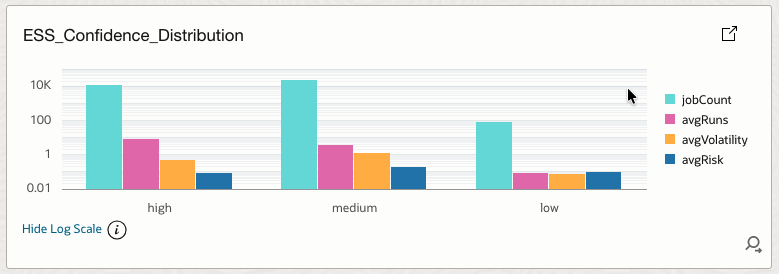
4.27 ESS_Confidence_Distribution
Shows distribution of model confidence levels.
How it helps
Indicates overall reliability of predictions and alerts.
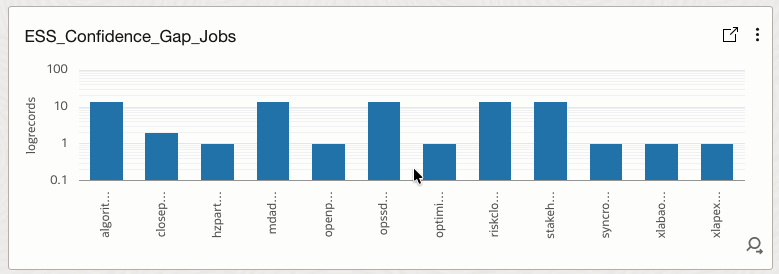
4.28 ESS_Confidence_Gap_Jobs
Identifies jobs with low confidence due to insufficient history or instability.
How it helps
Highlights where alerting and predictions may be unreliable.
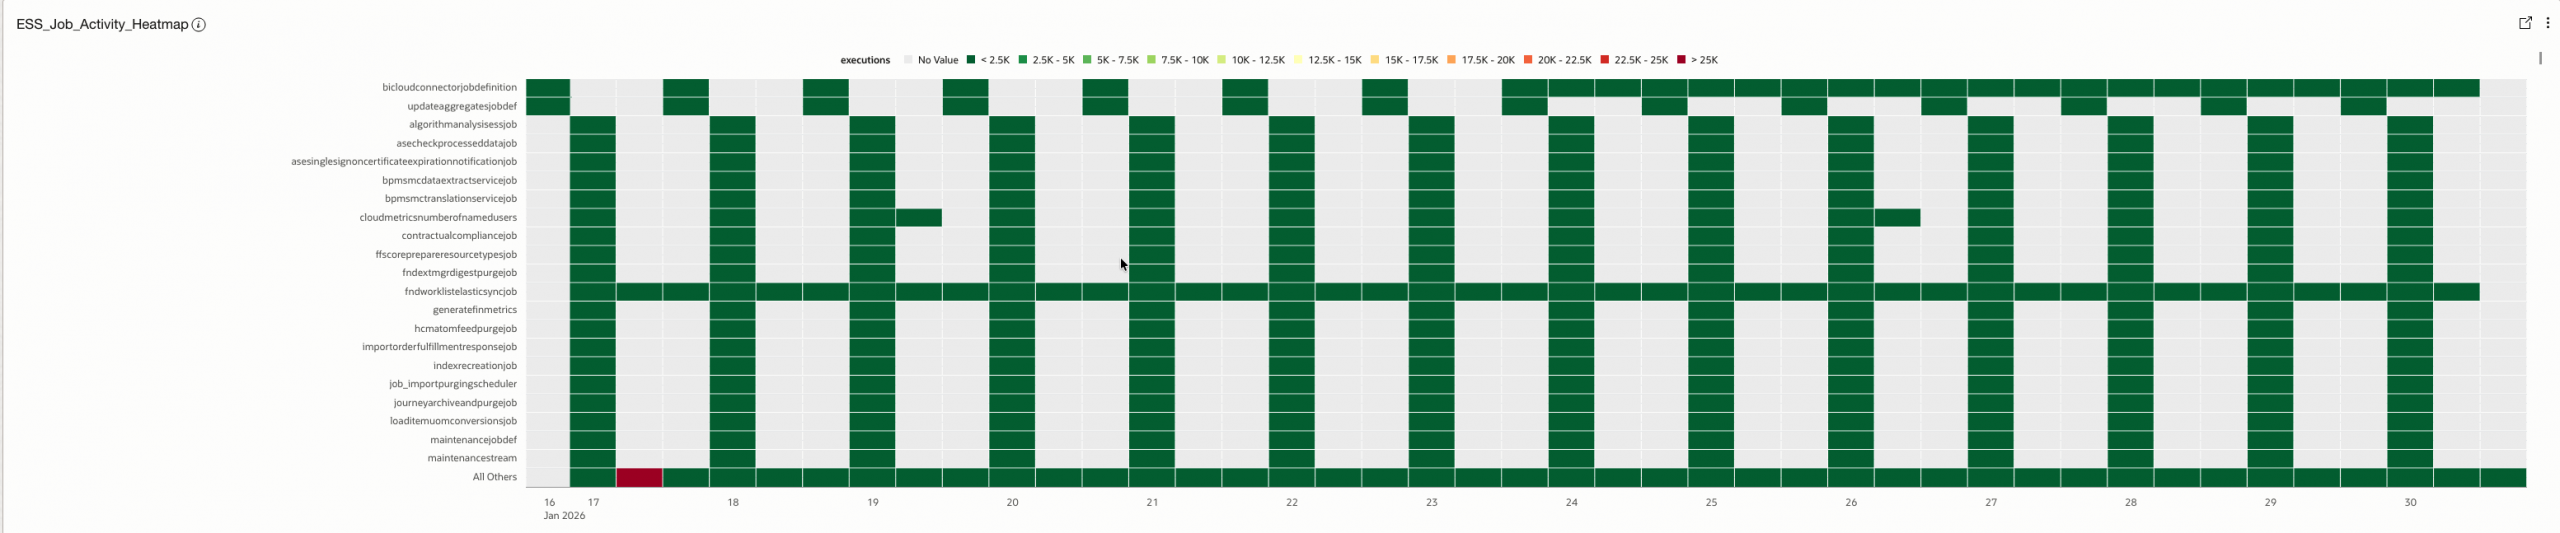
4.29 ESS_Job_Activity_Heatmap
Visualizes job execution activity over time.
How it helps
Shows when jobs are active and helps identify execution patterns and peaks.
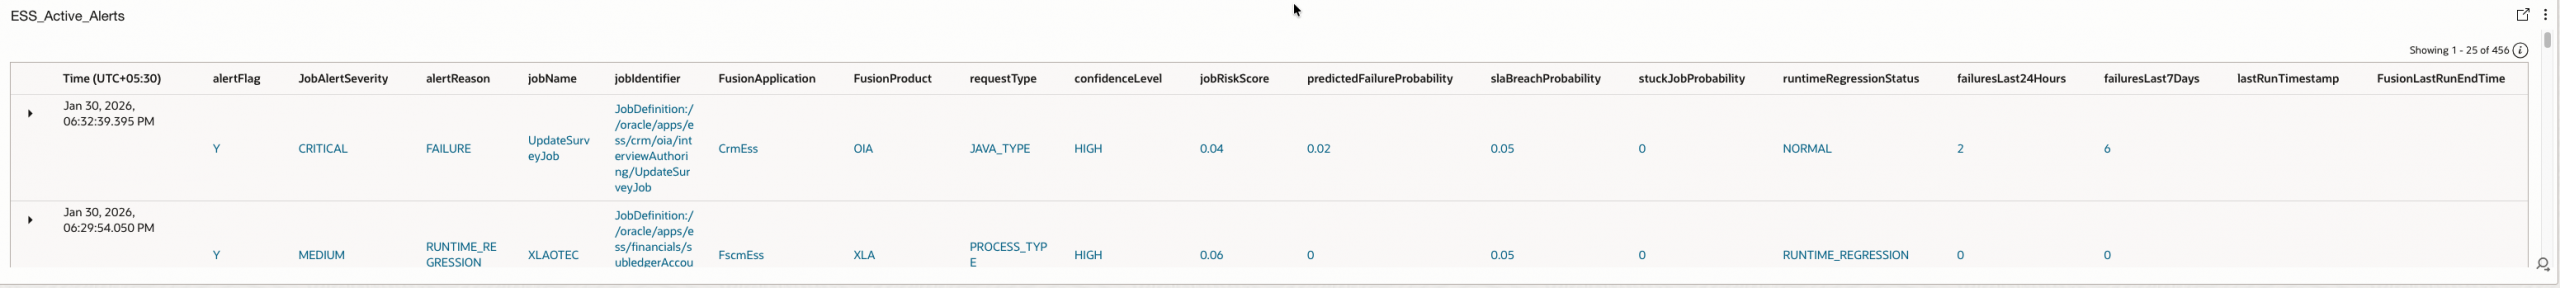
4.30 ESS_Active_Alerts
Lists all jobs currently in an alert state with detailed context.
How it helps
Acts as an operational action list for SOC and operations teams.
4.31 ESS_Job_Detail_Table (Drill Down Report)
Provides a detailed, job-level investigation view.
How it helps
Supports root cause analysis, auditing, and traceability.
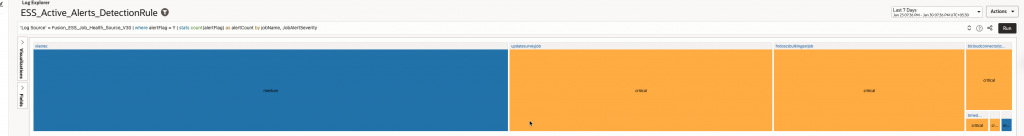
4.32 ESS_Active_Alerts_DetectionRule
Summarizes active alerts for use in detection rules, this is not used in dashboard but for identifying alerts sent for Alarms via detection rules.
How it helps
Feeds OCI Monitoring and Alarms to enable automated alerting and response.
Refer below Log queries to build same and covert them into OCI Dashboard.
| Widget | Log Query | Visualizations | |
| 1 | ESS_TotalJobRuns | Log Source’ = Fusion_ESS_Job_Health_Source_V30 | stats sum(totalRuns) as TotalJobRuns | Tile |
| 2 | ESS_Accuracy_Rate | Log Source’ = Fusion_ESS_Job_Health_Source_V30 | stats sum(succeededRuns) as success, sum(warningRuns) as warning, sum(totalRuns) as total | eval ESS_Accuracy_Rate = round((success * 1 + warning * 0.7) / total * 100, 2) | stats max(ESS_Accuracy_Rate) as ESS_Accuracy_Rate | Tile |
| 3 | ESS_FailuresRate | Log Source’ = Fusion_ESS_Job_Health_Source_V30 | stats sum(failedRuns) as failed, sum(totalRuns) as total | eval ESS_Failure_Rate = round((failed * 1) / total * 100, 2) | stats max(ESS_Failure_Rate) as ESS_Failure_Rate | Tile |
| 4 | ESS_Execution_Outcome_Summary | Log Source’ = Fusion_ESS_Job_Health_Source_V30 | stats sum(succeededRuns) as success, sum(failedRuns) as failed, sum(cancelledRuns) as cancelled, sum(warningRuns) as warning, sum(runningRuns) as running, sum(blockedRuns) as blocked, sum(queuePressure) as queue | Bar |
| 5 | ESS_LatestRuntimeSnapShotTrend | Log Source’ = Fusion_ESS_Job_Health_Source_V30 | timestats avg(lastRuntimeMinutes) as avgRuntime | Line |
| 6 | ESS_FailureSignals | Log Source’ = Fusion_ESS_Job_Health_Source_V30 | where failedRuns > 0 | timestats sum(failedRuns) AS failureEvents | Line |
| 7 | ESS_Job_Alerts | Log Source’ = Fusion_ESS_Job_Health_Source_V30 | where alertReason != ” | stats count as alertCount by alertReason | Pie |
| 8 | ESS_TopJobs | Log Source’ = Fusion_ESS_Job_Health_Source_V30 | stats sum(totalRuns) AS runs BY jobName | sort -runs | head 10 | Bar |
| 9 | ESS_TopSuccessfullJobs | Log Source’ = Fusion_ESS_Job_Health_Source_V30 | stats sum(succeededRuns) as succeededRuns, sum(totalRuns) as totalRuns by jobName | eval successPct = (succeededRuns * 100) / totalRuns | where successPct >= 99 | sort -successPct | head 10 | Bar |
| 10 | ESS_TopFailingJobs | Log Source’ = Fusion_ESS_Job_Health_Source_V30 | stats sum(failedRuns) as failedRuns, sum(totalRuns) as totalRuns by jobName | eval errorRate = (failedRuns * 100) / totalRuns | where totalRuns > 0 | where errorRate > 1 | sort -errorRate | head 20 | Bar |
| 11 | ESS_Top10RiskyJobs | Log Source’ = Fusion_ESS_Job_Health_Source_V30 | stats max(jobRiskScore) as jobRiskScore, max(slaBreachProbability) as slaRisk, max(predictedFailureProbability) as predictedFailureRisk, max(runtimeVolatilityIndex) as volatility by jobName | sort -jobRiskScore | top 10 jobRiskScore | Horizontal Bar |
| 12 | ESS_Longest_Running_Jobs | Log Source’ = Fusion_ESS_Job_Health_Source_V30 | stats max(lastRuntimeMinutes) as runtime by jobName | sort -runtime | top 10 runtime | Bar |
| 13 | ESS_High_Frequency_Scheduled_Jobs | Log Source’ = Fusion_ESS_Job_Health_Source_V30 | where highFrequencyScheduleFlag = Y | stats sum(totalRuns) as totalRuns by jobName | sort -totalRuns | Horizontal Bar |
| 14 | ESS_High_Volume_Runs | Log Source’ = Fusion_ESS_Job_Health_Source_V30 | where totalRuns > 10000 | stats sum(totalRuns) as totalRuns by jobName | sort -totalRuns | Sunburst |
| 15 | ESS_Runtime_Volatility | Log Source’ = Fusion_ESS_Job_Health_Source_V30 | stats avg(runtimeVolatilityIndex) as volatility by jobName | top 10 volatility | Horizontal Bar |
| 16 | ESS_Jobs_LikelytoFail | Log Source’ = Fusion_ESS_Job_Health_Source_V30 | where predictedFailureProbability >= 0.1 | stats max(predictedFailureProbability) as predictedFailureProbability by jobName | sort -predictedFailureProbability | top 10 predictedFailureProbability | Horizontal Bar |
| 17 | ESS_SLA_Risk_Jobs | Log Source’ = Fusion_ESS_Job_Health_Source_V30 | where slaBreachProbability >= 0.2 | stats max(slaBreachProbability) as slaBreachProbability, max(avgRuntimeMinutes) as avgRuntimeMinutes, max(p95RuntimeBaselineMinutes) as p95Baseline by jobName | sort -slaBreachProbability | Bar |
| 18 | ESS_Silent_Risk_Jobs | Log Source’ = Fusion_ESS_Job_Health_Source_V30 | where failuresLast24Hours = 0 | where jobRiskScore >= 0.6 or slaBreachProbability >= 0.4 | stats max(jobRiskScore) as jobRiskScore, max(slaBreachProbability) as slaBreachProbability by jobName | sort -jobRiskScore, slaBreachProbability | Bar |
| 19 | ESS_Runtime_vs_P95 | Log Source’ = Fusion_ESS_Job_Health_Source_V30 | stats avg(lastRuntimeMinutes) as actual, avg(p95RuntimeBaselineMinutes) as baseline by jobName | eval deviation = actual – baseline | sort -deviation | Bar |
| 20 | ESS_Jobs_By_Application | Log Source’ = Fusion_ESS_Job_Health_Source_V30 | stats count by FusionApplication | sort -Count | Horizontal Bar |
| 21 | ESS_Jobs_By_Submitter | Log Source’ = Fusion_ESS_Job_Health_Source_V30 | stats count as runs by FusionSubmitter | sort -runs | Horizontal Bar |
| 22 | ESS_Jobs_By_ProcessGroups | Log Source’ = Fusion_ESS_Job_Health_Source_V30 | stats count by FusionProcessGroup | Pie |
| 23 | ESS_Jobs_ScheduledvsAdhoc | Log Source’ = Fusion_ESS_Job_Health_Source_V30 | stats sum(scheduledCount) as SCHEDULED, sum(adhocCount) as ADHOC | Bar |
| 24 | ESS_Risk_Distribution | Log Source’ = Fusion_ESS_Job_Health_Source_V30 | eval riskBucket = if(jobRiskScore >= 0.75, High, if(jobRiskScore >= 0.6, Medium, if(jobRiskScore >= 0.4, Low, ‘Very Low’))) | where failuresLast24Hours > 0 or failuresLast7Days > 0 | stats count as jobCount, avg(slaBreachProbability) as avgSlaRisk, avg(runtimeVolatilityIndex) as avgVolatility by riskBucket | Bar |
| 25 | ESS_Runtime_Regression_Drivers | Log Source’ = Fusion_ESS_Job_Health_Source_V30 | eval regressionDriver = if(succeededRuns < 3, ‘Insufficient History’, runtimeVolatilityIndex > 1, ‘High Runtime Variance’, runtimeTrendSlopePerRun > 0, ‘Upward Runtime Trend’, lastRuntimeMinutes > previousRuntimeMinutes, ‘Recent Runtime Spike’, Stable) | stats count as jobCount by runtimeRegressionStatus, regressionDriver | sort runtimeRegressionStatus, -jobCount | Bar |
| 26 | ESS_Runtime_Regression_Distribution | Log Source’ = Fusion_ESS_Job_Health_Source_V30 | fields jobName, runtimeRegressionStatus, succeededRuns, lastRuntimeMinutes, previousRuntimeMinutes, runtimeVolatilityIndex, runtimeTrendSlopePerRun, jobRiskScore | stats count as jobCount, avg(succeededRuns) as avgSucceededRuns, avg(lastRuntimeMinutes) as avgLastRuntime, avg(previousRuntimeMinutes) as avgPreviousRuntime, avg(runtimeVolatilityIndex) as avgVolatility, avg(runtimeTrendSlopePerRun) as avgTrendSlope, avg(jobRiskScore) as avgRiskScore by runtimeRegressionStatus | sort -jobCount | Bar |
| 27 | ESS_Confidence_Distribution | Log Source’ = Fusion_ESS_Job_Health_Source_V30 | fields jobName, confidenceLevel, succeededRuns, runtimeVolatilityIndex, runtimeTrendSlopePerRun, jobRiskScore | stats count as jobCount, avg(succeededRuns) as avgRuns, avg(runtimeVolatilityIndex) as avgVolatility, avg(jobRiskScore) as avgRisk by confidenceLevel | eval confidenceOrder = if(confidenceLevel = HIGH, 1, if(confidenceLevel = MEDIUM, 2, 3)) | sort confidenceOrder | fields -confidenceOrder | Bar |
| 28 | ESS_Confidence_Gap_Jobs | Log Source’ = Fusion_ESS_Job_Health_Source_V30 | where confidenceLevel = “LOW” | fields jobName, succeededRuns, runtimeVolatilityIndex, runtimeTrendSlopePerRun | Bar |
| 29 | ESS_Job_Activity_Heatmap | Log Source’ = Fusion_ESS_Job_Health_Source_V30 | timestats sum(totalRuns) as executions by jobName | Heatmap |
| 30 | ESS_Active_Alerts | Log Source’ = Fusion_ESS_Job_Health_Source_V30 | where alertFlag = Y | fields alertFlag, JobAlertSeverity, alertReason, jobName, jobIdentifier, FusionApplication, FusionProduct, requestType, confidenceLevel, jobRiskScore, predictedFailureProbability, slaBreachProbability, stuckJobProbability, runtimeRegressionStatus, failuresLast24Hours, failuresLast7Days, lastRunTimestamp, FusionLastRunEndTime, FusionlastRunTimestamp, runningRuns, maxRunningDurationHours, FusionRequestID, lastRequestId, lastFailedRequestId, lastSuccessRequestId, longestRunningRequestId, scheduleOverdueFlag, highFrequencyScheduleFlag, -Entity, -‘Entity Type’, -‘Host Name (Server)’, -‘Problem Priority’, -Label, -‘Log Source’ | Table |
| 31 | ESS_Job_Detail_Table | Log Source’ = Fusion_ESS_Job_Health_Source_V30 | fields jobName, FusionApplication, FusionProduct, requestType, FusionSubmitter, alertFlag, alertReason, JobAlertSeverity, lastRequestId, lastSuccessRequestId, lastFailedRequestId, failuresLast24Hours, failuresLast7Days, lastRuntimeMinutes, FusionlastRunTimestamp, FusionlastSuccessTimestamp, confidenceLevel, jobRiskScore, slaBreachProbability, stuckJobProbability, runtimeRegressionStatus, runtimeVolatilityIndex, runtimeTrendSlopePerRun | fields -Entity, -‘Entity Type’, -‘Host Name (Server)’, -‘Problem Priority’, -Label, -‘Log Source’ | Table |
| 32 | ESS_Active_Alerts_DetectionRule | Log Source’ = Fusion_ESS_Job_Health_Source_V30 | where alertFlag = Y | stats count(alertFlag) as alertCount by jobName, JobAlertSeverity | TreeMap |
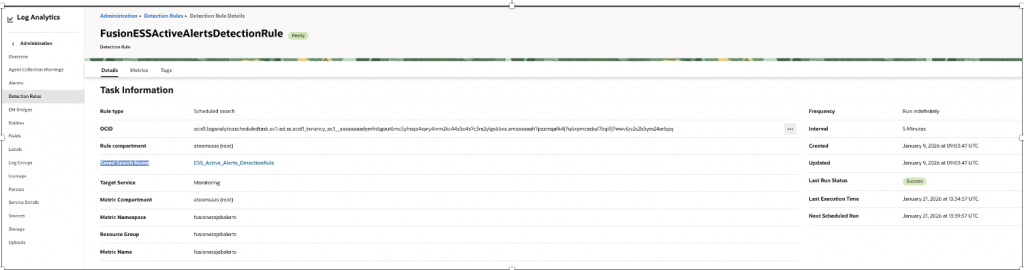
5 – Create Detection Rules
Use Saved Search – ESS_Active_Alerts_DetectionRule to build Detection rule which will create metrics in OCI Monitoring Service & eventually used in OCI Alarm.
| Property Name | Property Value |
| Name | FusionESSActiveAlertsDetectionRule |
| Rule Type | Scheduled search |
| Target Service | Monitoring |
| MetricNamespace | fusionessjobalerts |
| Resource Group | fusionessjobalerts |
| Metric Name | fusionessjobalerts |
Similarly, you can create Detection rule for any relevant Event you wanted to be notified using above Widgets(Saved Search) or you can create your own, as for Eg..
- slaBreachProbability >= 0.4
- failuresLast24Hours = 0 AND (jobRiskScore >= 0.6 OR slaBreachProbability >= 0.4)
- For Monitor Failure of any particular critical ESS Job (jobName = ‘<JobName>’)
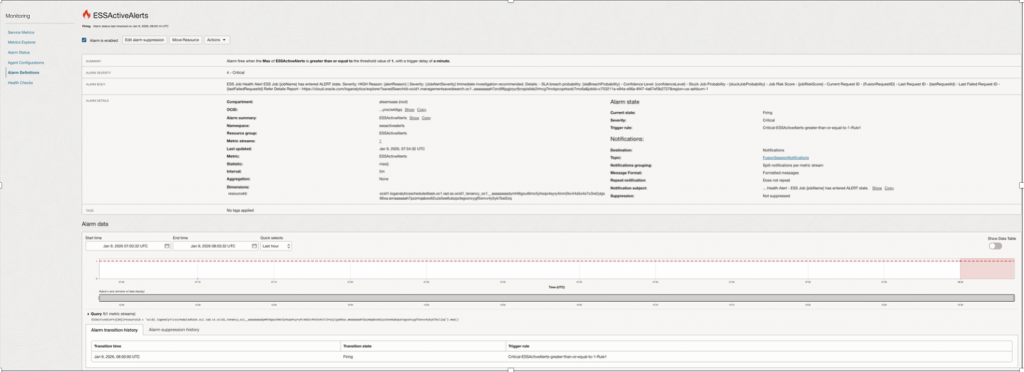
6 – Create OCI Alarms
Build Alarms using Alert Flag which captures various health parameters as
– Runtime regression
– Failure spikes
– Missed critical jobs
| Property Name | Property Value |
| Alarm Name | ESSActiveAlerts |
| MetricNamespace | fusionessjobalerts |
| Resource Group | fusionessjobalerts |
| Metric Name | fusionessjobalerts |
| Interval | 1 Minute |
| Statistics | Max |
| Trigger Rule 1 – Operator (greater than or equal to ) | 1 Minute |
| Trrigger delay | 1 Minute |
| Alarm Severity | Critical |
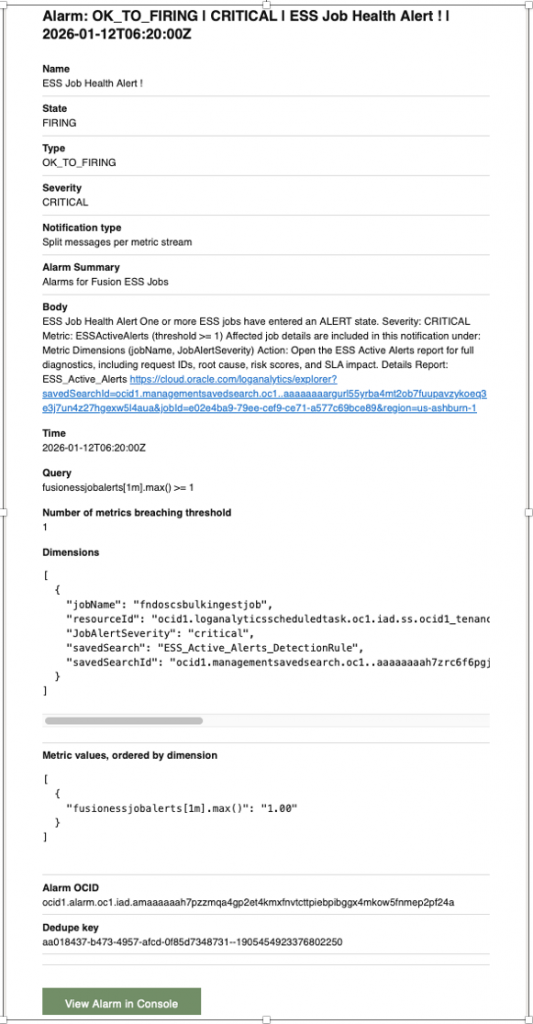
| Alarm Body | ESS Job Health Alert One or more ESS jobs have entered an ALERT state. Severity: CRITICAL Metric: ESSActiveAlerts (threshold >= 1) Affected job details are included in this notification under: Metric Dimensions (jobName, JobAlertSeverity) Action: Open the ESS Active Alerts report for full diagnostics, including request IDs, root cause, risk scores, and SLA impact. Details Report: ESS_Active_Alerts <URL of Widget – ESS_Active_Alerts > |
| Destination Service | Notifications |
| Topic | <Topic created for Notification> |
| Notification Subject | ESS Job Health Alert ! |
| Message grouping | Split Notifications Per metric |
| Message format | Send formatted message |
Alarm Notifications –
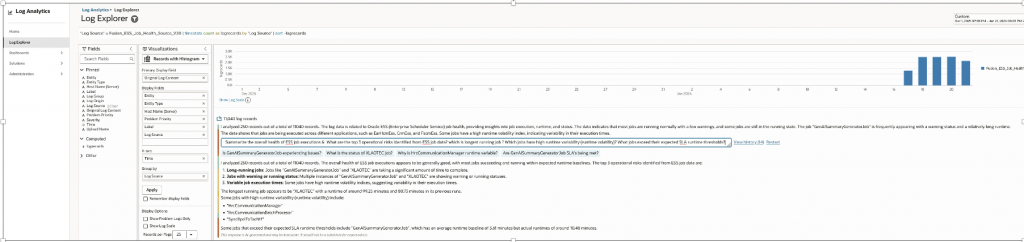
7 – Analyze data using LoganAI
AI analysis using LoganAI can be done over collected ESS Job data from Log Explorer.
Traditional queries tell us what happened. Logan AI lets us ask why it happened, what will happen next, and where to focus directly on Fusion ESS operational data
Search Query –
'Log Source' = Fusion_ESS_Job_Health_Source_V30 | timestats count as logrecords by 'Log Source' | sort -logrecordsSample Questions –
- Summarize the overall health of ESS job executions
- What are the top 3 operational risks identified from ESS job data?
- Which is longest running job ?
- Which jobs have high runtime variability (runtime volatility)?
- What jobs exceed their expected SLA runtime thresholds?
- Which Fusion application generates the most ESS job executions (HCM, ERP, SCM)?
- Are there early warning indicators before job failures occur?
- Which jobs should be proactively monitored more closely?
GitHub : The repository includes implementation-ready artifacts along with installation instructions to support deployment and customization.
https://github.com/oracle-quickstart/oci-o11y-solutions/tree/main/knowledge-content/fa-ess-scheduler/ESSJobHealthRiskObservatory
Summarizing All
Below is the list of all tasks in order of dependency that needs to be completed for this solution –
| Tasks | Purpose | Comments | |
| 1 | BI Report | SQL Report for ESS Monitoring | Refer Steps : 1 – BI-Layer >> 1.5 – Report Design |
| 2 | Service Account | Service Account to Connect to Fusion – This will be used in OIC for Authorization Code Flow | Service Account must have below Roles to View all ESS Jobs Create Common – Abstract Roles – Monitor ESS Processes ->BI Consumer Role(BIConsumer) – to run report ->ESSMonitor (to View All Jobs) Give Setup Users Permissions to See All Scheduled Processes How to View the Output of an ESS Jobs Submitted By Another User Based on Role? KB96503 https://support.oracle.com/support/?anchorId=&kmContentId=1980772&page=sptemplate&sptemplate=km-article |
| 3 | IAM Confidential Client | OAuth2.0 Client Confidential App to Acess Fusion BIP Webservice securely | Note – We have used OAuth2.0 as better Security posture, however same can be done via basic authentication. If you are using Basic Auth, then this step can be skipped. For OIC in Fusion Application Domain Follow – Enabling OAuth 2.0 JWT Authentication for Oracle SOAP Services in OIC Gen3 https://www.ateam-oracle.com/enabling-oauth-20-jwt-authentication-for-oracle-soap-services-in-oic-gen3#Authorization Pick – 1. Using OAuth 2.0 Authorization Code For OIC in External Application/Non FA Domain Follow – Simplifying OAuth for OIC to Fusion Integrations: Authorization Code Across IAM Domains https://www.ateam-oracle.com/simplifying-oauth-for-oic-to-fusion-integrations-authorization-code-across-iam-domains Follow Approach 1 (Recommended) Pick – Using OAuth 2.0 Authorization Code Flow |
| 4 | OIC Connection | To Invoke Fusion BI SOAP from OIC – Configure SOAP Adaptor using OAuth2.0 | Note – We have used OAuth2.0 as better Security posture, however same can be done via basic authentication. If you are using Basic Auth, then directly pass username/pass. Trigger/Invoke Connection Name – OIC_FA_Integration_OAuthCode Type – SOAP Security Policy – OAuth Authorization Code (Recommended) User Client ID & Secret provisioned in step-3. WSDL – https://<FA-POD>/xmlpserver/services/ExternalReportWSSService?wsdl |
| 5 | IAM Confidential Client | OAuth2.0 Client Confidential App to access OIC End points securely. | Note – We have used OAuth2.0 as better Security posture, however same can be done via basic authentication. If you are using Basic Auth, then this step can be skipped. Follow – Invoking Oracle Integration Cloud (OIC) APIs Using OAuth 2.0 (Client Credentials and Authorization Code) Across IAM Domains https://www.ateam-oracle.com/invoking-oracle-integration-cloud-oic-apis-using-oauth-2-0-client-credentials-and-authorization-code-across-iam-domains Pick – Client Credentials |
| 6 | OIC Connection | To Invoke OIC REST from OCI log analytics -Configure REST Adaptor using OAuth2.0 | Note – We have used OAuth2.0 as better Security posture, however same can be done via basic authentication. If you are using Basic Auth, then directly pass username/pass. Trigger Connection Name – TriggerESSHealthInfo Type – REST Security Policy – OAuth 2.0 This will use Client ID & Secret provisioned in step-5. |
| 7 | OIC Integration | Deploy ESS Job Health REST API | Refer Steps : 2 – OIC Layer>>Step 2.2 : Create App Driven Integration |
| 8 | IAM Policies | Enable Log analytics Create IAM Groups Create Log Analytics IAM Policies | As a new user, if you want to start using Oracle Log Analytics, then from OCI console menu, navigate to Observability & Management, click Log Analytics, and click Start Using Log Analytics in the on-boarding page. The wizard automatically creates policies for enabling Oracle Log Analytics and configuring OCI Audit Logs collection. Enable Log Analytics – A service-level IAM policy must be created to enable the Oracle Log Analytics service to operate. Policies Created While Onboarding Log Analytics https://docs.oracle.com/en-us/iaas/log-analytics/doc/policies-created-while-onboarding-logging-analytics.html Three User Groups – One for Admin, One for Development & one for View Only , Log-Analytics-SuperAdmins logging-analytics-users-group Log-Analytics-Admins Enable Access to Log Analytics and Its Resources https://docs.oracle.com/en-us/iaas/log-analytics/doc/enable-access-logging-analytics-its-resources.html Enable Saved Search https://docs.oracle.com/en-us/iaas/log-analytics/doc/create-schedule-run-saved-search.html |
| 9 | Compute | Required for Management Engine | Refer Steps : 3 – OCI Logging Analytics>>STEP 3.1 – Create Management Agent |
| 10 | Agent | Update Management Engine | Refer Steps :3 – OCI Logging Analytics>>STEP 3.2 – Update Management Agent |
| 11 | Log Group | For Logical isolation for ESS monitoring data | Refer Steps :3 – OCI Logging Analytics>>STEP 3.3 – Create Log Group |
| 12 | Log Parser | Parses ESS Job Health REST API response from OIC | Refer Steps :3 – OCI Logging Analytics>>STEP 3.4 – Create Log Parser |
| 13 | Log Source | Logging Analytics REST Source | Refer Steps :3 – OCI Logging Analytics>>STEP 3.5 – Create Log Source |
| 14 | Create Credential File | Dynamic Token(OAuth2.0) | Note – We have used OAuth2.0 as better Security posture, however same can be done via basic authentication. Refer – Examples of Credential JSON Refer Steps :3 – OCI Logging Analytics>>STEP 3.6 – Create Credential File for REST Access Use Client ID & Secret provisioned in step-5. |
| 15 | Create Entity | Entity sits over Management Agent & Associate with Source to pull data | Refer Steps :3 – OCI Logging Analytics>>STEP 3.7 – Create Entity |
| 16 | Associate Source to Entity | Add Source to Entity. | Refer Steps :3 – OCI Logging Analytics>>STEP 3.8 – Associate Source to Entity |
| 17 | Verification | Verify OCI Log Analytics receives data | Refer Steps : Verify if Entity has started polling REST API |
| 18 | Enable LogonAI | For OCI generative AI | Enable Logon AI – https://docs.oracle.com/en-us/iaas/log-analytics/doc/enable-loganai.html |
| 19 | Widgets | Create Reports | Refer Steps :4 – Create Widgets & OCI Dashboards>>Log Queries |
| 20 | Dashboards | Create Consolidate Dashboard | Refer Create a Custom Dashboard – https://docs.oracle.com/en-us/iaas/management-dashboard/doc/create-custom-dashboard.html |
| 21 | Detection Rules | Create Detection Rules for OCI Alarm | Refer Steps :5 – Create Detection Rules |
| 22 | Alarms | Create OCI Alarms from OCI Monitoring | Refer Steps : 6 – Create OCI Alarms |
Note – OCI Services required for ESS Job Health & Risk Observatory
The solution requires the following OCI services :
- OCI Log Analytics – Core service for log ingestion, analysis, and risk detection (pricing driven by log volume and storage).
- OCI Log Analytics provides a free tier that includes up to 10 GB of log storage per month. Charges apply only when this threshold is exceeded, with pricing driven primarily by log volume and storage – refer
- After that, active storage for Logging Analytics is priced per “Logging Analytics Storage Units”. One storage unit is 300 GB of logs stored during the month
- There is also an archival storage rate for Logging Analytics (for logs moved from active store). The archival storage is charged per hour per storage unit
- OCI Compute – Used for lightweight processing or custom components; billed based on OCPU and memory consumption.
- Start with basic & increase as per your workloads, the incremental compute cost is modest – refer
- Oracle Integration Cloud (OIC) – Acts as the integration layer to connect Fusion Applications (ESS) with OCI services and orchestrate data flow.
Customers can estimate expected costs using the Oracle Cloud Cost Estimator , Overall, the solution is cost-efficient and scales with log volume, retention, and usage patterns, For an accurate, environment-specific estimate, Please contact Oracle Cloud Sales team, For best practices on managing and optimizing Logging Analytics costs, refer to Guidance
Conclusion
The ESS Job Health & Risk Observatory represents an industry-grade monitoring solution. By combining BI-driven analytics, OCI Log analytics observability & AI features (LoganAI), it shifts ESS monitoring from reactive reporting to proactive risk management.
This design aligns with SRE best practices and scales with enterprise complexity.
This solution turns ESS from a black box into a predictable, measurable, and governable system, it converts raw ESS execution data into actionable operational intelligence.
This is not just monitoring – it is predictive analytics:
- Failure Probability – Predicts likelihood of next-run failure with low noise
- Runtime Regression Detection – Identifies jobs slowing down vs historical P95 baselines
- Trend Slope Analysis – Detects long-term degradation before outages occur
- Composite Job Risk Scoring – Single score combining failures, SLA risk, volatility, and trend
- Explainable Alerts – Every alert includes why it fired (failure, SLA risk, regression, stuck)
We are no longer asking why did this fail?
We are asking what will fail next, and why?
Shoutout to Satinder Singh (OCI Log Analytics Development) for his contributions in Implementation using Log Analytics.
Refer Customer Connect Session for brief demo :
Oracle Go – Next-Level Fusion Monitoring: Dashboards on Demand
https://community.oracle.com/customerconnect/events/607255-oracle-go-next-level-fusion-monitoring-dashboards-on-demand
Note:
- This solution is an Oracle A-Team reference implementation that demonstrates one possible approach to ESS operational intelligence. It is not an out-of-the-box Oracle Fusion Applications feature, a standalone Oracle Cloud service, or an Oracle-managed monitoring solution.
- The solution is deployed within the customer’s OCI tenancy. Customers are responsible for deploying, configuring, securing, operating, monitoring, maintaining, and supporting the OCI services, integrations, and resources used by the implementation, including applicable OCI consumption charges.
- The scoring parameters including regression factor, minimum successful runs, job-risk threshold, SLA-breach threshold, and stuck-job threshold are configurable. Customers should validate and tune them for their workload characteristics, operational requirements, and risk tolerance without modifying the underlying SQL logic.
- Observability outputs, scores, and alerts are operational indicators only and should be validated through the customer’s established monitoring and incident-management processes.
References
- Oracle MOS: Sample SQL Queries for Monitoring ESS (Doc ID 2820161.1)
- Oracle ESS Scheduler REST API Documentation
- Fusion Apps Observability by Collecting Enterprise Scheduler ESS Logs Using OCI Logging Analytics REST API Ingestion
- Creating Innovative User Experience for Fusion Cloud Applications Scheduled Processes
Reference Code Artifacts
BI Data Model Query
WITH
PARAMS AS
(
SELECT
TO_TIMESTAMP_TZ(:P_FROM_TIMESTAMP,'YYYY-MM-DD"T"HH24:MI:SS.FF3') AS P_FROM_TS,
TO_TIMESTAMP_TZ(:P_TO_TIMESTAMP,'YYYY-MM-DD"T"HH24:MI:SS.FF3') AS P_TO_TS
FROM DUAL
),
WINDOW_JOB_ROWS AS
(
SELECT /*+ MATERIALIZE PARALLEL(rh 4) */
rh.DEFINITION AS job_key,
SUBSTR(rh.definition, INSTR(rh.definition,'/',-1)+1) AS job_display_name,
rh.APPLICATION,
rh.PRODUCT,
rh.TYPE,
rh.PROCESSSTART AS last_run_time,
rh.PROCESSEND AS last_run_end_time,
rh.REQUESTEDSTART AS request_start_time,
rh.COMPLETEDTIME AS request_complete_time,
rh.REQUESTID,
rh.PARENTREQUESTID,
rh.PROCESSGROUP,
rh.SUBMITTER,
rh.SCHEDULED,
rh.DEFINITION||':'||rh.REQUESTID JOB_DEDUPE_KEY,
RANK() OVER (
PARTITION BY rh.DEFINITION
ORDER BY rh.PROCESSSTART DESC, rh.REQUESTID DESC
) AS anchor_rank
FROM
ESS_REQUEST_HISTORY rh,
PARAMS prm
WHERE rh.PROCESSSTART >= prm.P_FROM_TS
AND rh.PROCESSSTART < prm.P_TO_TS
),
JOB_KEYS AS
(
SELECT /*+ MATERIALIZE */ DISTINCT job_key
FROM WINDOW_JOB_ROWS
WHERE anchor_rank = 1
),
WINDOW_STAT_ROWS AS
(
SELECT /*+ MATERIALIZE */
rh.*
FROM
ESS_REQUEST_HISTORY rh,
PARAMS prm,
JOB_KEYS jk
WHERE rh.DEFINITION = jk.job_key
AND rh.PROCESSSTART >= prm.P_FROM_TS
AND rh.PROCESSSTART < prm.P_TO_TS
),
HIST_ROWS AS
(
SELECT /*+ MATERIALIZE PARALLEL(rh 4) */
rh.*
FROM
ESS_REQUEST_HISTORY rh,
PARAMS prm,
JOB_KEYS jk
WHERE rh.DEFINITION = jk.job_key
AND rh.PROCESSSTART <= prm.P_TO_TS
),
SUCCESS_ROWS AS
(
SELECT /*+ MATERIALIZE */
rh.DEFINITION AS job_key,
rh.PROCESSSTART,
rh.COMPLETEDTIME,
(CAST(NVL(rh.PROCESSEND, SYSTIMESTAMP) AS DATE) - CAST(rh.PROCESSSTART AS DATE)) * 1440 AS runtime_min
FROM
HIST_ROWS rh
WHERE rh.state IN (12,17)
),
SLA_ROWS AS
(
SELECT /*+ MATERIALIZE */
rh.DEFINITION AS job_key,
(CAST(NVL(rh.PROCESSEND, SYSTIMESTAMP) AS DATE) - CAST(rh.PROCESSSTART AS DATE)) * 1440 AS runtime_min
FROM
HIST_ROWS rh,
PARAMS prm
WHERE rh.state IN (12,17,11)
AND rh.PROCESSSTART < prm.P_TO_TS
),
RUNNING_ROWS AS
(
SELECT /*+ MATERIALIZE */
rh.DEFINITION AS job_key,
rh.REQUESTID,
rh.PROCESSSTART,
EXTRACT(DAY FROM (prm.P_TO_TS - rh.PROCESSSTART)) * 24
+ EXTRACT(HOUR FROM (prm.P_TO_TS - rh.PROCESSSTART))
+ EXTRACT(MINUTE FROM (prm.P_TO_TS - rh.PROCESSSTART)) / 60 AS runtime_hours,
EXTRACT(DAY FROM (prm.P_TO_TS - rh.PROCESSSTART)) * 1440
+ EXTRACT(HOUR FROM (prm.P_TO_TS - rh.PROCESSSTART)) * 60
+ EXTRACT(MINUTE FROM (prm.P_TO_TS - rh.PROCESSSTART))
+ EXTRACT(SECOND FROM (prm.P_TO_TS - rh.PROCESSSTART)) / 60 AS runtime_min
FROM
HIST_ROWS rh,
PARAMS prm
WHERE rh.state IN (3,5,7)
),
HIST_AGG AS
(
SELECT /*+ MATERIALIZE */
rh.DEFINITION AS job_key,
COUNT(CASE WHEN rh.PROCESSSTART < prm.P_TO_TS THEN 1 END) AS total_runs,
SUM(CASE WHEN rh.PROCESSSTART < prm.P_TO_TS AND rh.state IN (10,15,18,19) THEN 1 ELSE 0 END) AS failed_runs,
SUM(CASE WHEN rh.PROCESSSTART < prm.P_TO_TS AND rh.state IN (12,17) THEN 1 ELSE 0 END) AS succeeded_runs,
SUM(CASE WHEN rh.PROCESSSTART < prm.P_TO_TS AND rh.state = 3 THEN 1 ELSE 0 END) AS running_runs,
SUM(CASE WHEN rh.PROCESSSTART < prm.P_TO_TS AND rh.state = 5 THEN 1 ELSE 0 END) AS blocked_runs,
SUM(CASE WHEN rh.PROCESSSTART < prm.P_TO_TS AND rh.state IN (7,9) THEN 1 ELSE 0 END) AS cancelled_runs,
SUM(CASE WHEN rh.PROCESSSTART < prm.P_TO_TS AND rh.state IN (4,11) THEN 1 ELSE 0 END) AS warning_runs,
SUM(CASE WHEN rh.PROCESSSTART < prm.P_TO_TS AND rh.state IN (1,2,6,13,14,20) THEN 1 ELSE 0 END) AS queue_pressure,
AVG(
CASE
WHEN rh.PROCESSSTART < prm.P_TO_TS AND rh.state IN (12,17) THEN
(CAST(NVL(rh.processend, SYSTIMESTAMP) AS DATE) - CAST(rh.processstart AS DATE)) * 1440
END
) AS avg_runtime,
STDDEV(
CASE
WHEN rh.PROCESSSTART < prm.P_TO_TS AND rh.state IN (12,17) THEN
(CAST(NVL(rh.processend, SYSTIMESTAMP) AS DATE) - CAST(rh.processstart AS DATE)) * 1440
END
) AS stddev_runtime,
SUM(
CASE
WHEN rh.state IN (10,18,19)
AND rh.PROCESSSTART >= prm.P_TO_TS - NUMTODSINTERVAL(1, 'DAY')
AND rh.PROCESSSTART < prm.P_TO_TS
THEN 1
ELSE 0
END
) AS failed_24h_count,
SUM(
CASE
WHEN rh.state IN (10,18,19)
AND rh.PROCESSSTART >= prm.P_TO_TS - NUMTODSINTERVAL(7, 'DAY')
AND rh.PROCESSSTART < prm.P_TO_TS
THEN 1
ELSE 0
END
) AS failed_7d_count,
MAX(rh.requestid) AS last_request_id,
MAX(CASE WHEN rh.state IN (12,17) THEN rh.requestid END) AS last_success_request_id,
MAX(CASE WHEN rh.state IN (10,18,19) THEN rh.requestid END) AS last_failed_request_id
FROM
HIST_ROWS rh,
PARAMS prm
GROUP BY
rh.DEFINITION
),
RUNNING_AGG AS
(
SELECT /*+ MATERIALIZE */
rr.job_key,
COUNT(1) AS running_count,
MAX(rr.runtime_hours) AS running_hours,
MAX(rr.requestid) KEEP (DENSE_RANK FIRST ORDER BY rr.runtime_min DESC) AS longest_running_request_id
FROM
RUNNING_ROWS rr
GROUP BY
rr.job_key
),
SUCCESS_DIST AS
(
SELECT /*+ MATERIALIZE */
sr.job_key,
AVG(sr.runtime_min) AS avg_runtime_baseline_min,
PERCENTILE_CONT(0.50) WITHIN GROUP (
ORDER BY sr.runtime_min
) AS p50_runtime_baseline_min,
PERCENTILE_CONT(0.95) WITHIN GROUP (
ORDER BY sr.runtime_min
) AS p95_runtime_baseline_min
FROM
SUCCESS_ROWS sr
GROUP BY
sr.job_key
),
SCHEDULE_RANKED AS
(
SELECT /*+ MATERIALIZE */
rh.DEFINITION AS job_key,
rh.state,
rh.adhocschedule,
ROW_NUMBER() OVER (
PARTITION BY rh.DEFINITION
ORDER BY rh.requestedstart DESC
) rn
FROM
fusion_ora_ess.request_history rh,
JOB_KEYS jk
WHERE rh.DEFINITION = jk.job_key
AND rh.parentrequestid = -1
AND rh.requesttype = 2
AND rh.adhocschedule IS NOT NULL
),
JOB_DATA AS
(
SELECT
/* =========================
Job FIELDS FOR API
========================= */
Q.JOB_IDENTIFIER,
Q.JOB_NAME,
Q.APPLICATION,
Q.PRODUCT,
Q.REQUEST_TYPE,
Q.LAST_RUN_TIMESTAMP,
Q.LAST_RUN_END_TIME,
Q.REQUEST_START_TIME,
Q.REQUEST_EVENT_TIME,
Q.REQUEST_COMPLETE_TIME,
Q.REQUESTID,
Q.PARENTREQUESTID,
Q.PROCESSGROUP,
Q.SUBMITTER,
Q.SCHEDULED,
--
Q.LAST_SUCCESS_TIMESTAMP,
Q.LAST_RUNTIME_MINUTES,
Q.PREVIOUS_RUNTIME_MINUTES,
Q.RUNTIME_REGRESSION_STATUS,
--
Q.AVG_RUNTIME_BASELINE_MIN,
Q.P95_RUNTIME_BASELINE_MIN,
--
Q.FAILURES_LAST_24_HOURS,
Q.FAILURES_LAST_7_DAYS,
--
Q.CURRENTLY_RUNNING_COUNT,
Q.MAX_RUNNING_DURATION_HOURS,
--
Q.TOTAL_RUNS,
Q.FAILED_RUNS,
Q.SUCCEEDED_RUNS,
Q.RUNNING_RUNS,
Q.BLOCKED_RUNS,
Q.CANCELLED_RUNS,
Q.WARNING_RUNS,
Q.queue_pressure,
--
Q.AVG_RUNTIME_MINUTES,
Q.STDDEV_RUNTIME_MINUTES,
--
Q.PREDICTED_FAILURE_PROBABILITY,
Q.SLA_BREACH_PROBABILITY,
Q.RUNTIME_VOLATILITY_INDEX,
Q.RUNTIME_TREND_SLOPE_PER_RUN,
Q.STUCK_JOB_PROBABILITY,
--
Q.CONFIDENCE_LEVEL,
Q.CONFIDENCE_SCORE_WEIGHTED,
Q.JOB_RISK_SCORE,
--
Q.SCHEDULE_START_TIME,
Q.SCHEDULE_END_TIME,
Q.SCHEDULE_FREQUENCY,
Q.SCHEDULE_INTERVAL,
Q.SCHEDULE_ENDED_FLAG,
Q.SCHEDULE_OVERDUE_FLAG,
Q.HIGH_FREQUENCY_SCHEDULE_FLAG,
--
Q.LAST_REQUEST_ID,
Q.LAST_SUCCESS_REQUEST_ID,
Q.LAST_FAILED_REQUEST_ID,
Q.LONGEST_RUNNING_REQUEST_ID,
--
Q.ADHOC_COUNT ,
Q.SCHEDULE_COUNT ,
/* =========================
META FIELDS FOR API
========================= */
TO_CHAR(
TO_TIMESTAMP_TZ(:P_FROM_TIMESTAMP,'YYYY-MM-DD"T"HH24:MI:SS.FF3'),
'YYYY-MM-DD"T"HH24:MI:SS"Z"'
) AS META_FROM_TIMESTAMP,
TO_CHAR(
TO_TIMESTAMP_TZ(:P_TO_TIMESTAMP,'YYYY-MM-DD"T"HH24:MI:SS.FF3'),
'YYYY-MM-DD"T"HH24:MI:SS"Z"'
) AS META_TO_TIMESTAMP,
TO_CHAR(
SYSTIMESTAMP AT TIME ZONE 'UTC',
'YYYY-MM-DD"T"HH24:MI:SS"Z"'
) AS META_GENERATED_AT,
COUNT(1) OVER () AS META_RECORD_COUNT,
/* Alert decision */
CASE
/* HARD SIGNALS */
WHEN Q.FAILURES_LAST_24_HOURS > 0 THEN 'Y'
WHEN Q.STUCK_JOB_PROBABILITY >= NVL(:P_STUCK_JOB_PROBABILITY,0.8) THEN 'Y'
WHEN Q.SCHEDULE_OVERDUE_FLAG = 'Y' THEN 'Y'
/* SOFT / PREDICTIVE SIGNALS */
WHEN Q.CONFIDENCE_LEVEL IN ('MEDIUM', 'HIGH')
AND Q.RUNTIME_REGRESSION_STATUS = 'RUNTIME_REGRESSION'
THEN 'Y'
WHEN Q.CONFIDENCE_LEVEL IN ('MEDIUM', 'HIGH')
AND Q.JOB_RISK_SCORE >= NVL(:P_JOB_RISK_SCORE,0.6)
THEN 'Y'
WHEN Q.CONFIDENCE_LEVEL IN ('MEDIUM', 'HIGH')
AND Q.SLA_BREACH_PROBABILITY >= NVL(:P_SLA_BREACH_PROBABILITY,0.4)
THEN 'Y'
ELSE 'N'
END AS ALERT_FLAG,
-- Alert Reason
CASE
WHEN
(
Q.FAILURES_LAST_24_HOURS > 0
OR Q.STUCK_JOB_PROBABILITY >= NVL(:P_STUCK_JOB_PROBABILITY,0.8)
OR Q.SCHEDULE_OVERDUE_FLAG = 'Y'
OR (
Q.CONFIDENCE_LEVEL IN ('MEDIUM','HIGH')
AND (
Q.RUNTIME_REGRESSION_STATUS = 'RUNTIME_REGRESSION'
OR Q.JOB_RISK_SCORE >= NVL(:P_JOB_RISK_SCORE,0.6)
OR Q.SLA_BREACH_PROBABILITY >= NVL(:P_SLA_BREACH_PROBABILITY,0.4)
)
)
)
THEN
CASE
WHEN Q.FAILURES_LAST_24_HOURS > 0 THEN 'FAILURE'
WHEN Q.STUCK_JOB_PROBABILITY >= NVL(:P_STUCK_JOB_PROBABILITY,0.8) THEN 'STUCK'
WHEN Q.SCHEDULE_OVERDUE_FLAG = 'Y' THEN 'SCHEDULE_OVERDUE'
WHEN Q.RUNTIME_REGRESSION_STATUS = 'RUNTIME_REGRESSION' THEN 'RUNTIME_REGRESSION'
WHEN Q.JOB_RISK_SCORE >= NVL(:P_JOB_RISK_SCORE,0.6) THEN 'HIGH_RISK_SCORE'
WHEN Q.SLA_BREACH_PROBABILITY >= NVL(:P_SLA_BREACH_PROBABILITY,0.4) THEN 'SLA_RISK'
END
ELSE NULL
END AS ALERT_REASON,
-- Alert Severity
CASE
WHEN
(
Q.FAILURES_LAST_24_HOURS > 0
OR Q.STUCK_JOB_PROBABILITY >= NVL(:P_STUCK_JOB_PROBABILITY,0.8)
OR Q.SCHEDULE_OVERDUE_FLAG = 'Y'
OR (
Q.CONFIDENCE_LEVEL IN ('MEDIUM','HIGH')
AND (
Q.RUNTIME_REGRESSION_STATUS = 'RUNTIME_REGRESSION'
OR Q.JOB_RISK_SCORE >= NVL(:P_JOB_RISK_SCORE,0.6)
OR Q.SLA_BREACH_PROBABILITY >= NVL(:P_SLA_BREACH_PROBABILITY,0.4)
)
)
)
THEN
CASE
WHEN Q.FAILURES_LAST_24_HOURS > 0 THEN 'CRITICAL'
WHEN Q.STUCK_JOB_PROBABILITY >= NVL(:P_STUCK_JOB_PROBABILITY,0.8) THEN 'CRITICAL'
WHEN Q.SCHEDULE_OVERDUE_FLAG = 'Y' THEN 'HIGH'
WHEN Q.JOB_RISK_SCORE >= 0.75 THEN 'HIGH'
WHEN Q.JOB_RISK_SCORE >= 0.6 THEN 'MEDIUM'
ELSE 'MEDIUM'
END
ELSE 'LOW'
END AS ALERT_SEVERITY,
-- Additional Attribute for Future
'JOB_DEDUPE_KEY' ATTRIBUTE_NAME1,
Q.JOB_DEDUPE_KEY ATTRIBUTE_VAL1,
NULL ATTRIBUTE_NAME2,
NULL ATTRIBUTE_VAL2,
NULL ATTRIBUTE_NAME3,
NULL ATTRIBUTE_VAL3,
NULL ATTRIBUTE_NAME4,
NULL ATTRIBUTE_VAL4,
NULL ATTRIBUTE_NAME5,
NULL ATTRIBUTE_VAL5
FROM
(
SELECT
/* Unique job identifier derived from ESS job name or definition */
J.JOB_KEY AS JOB_IDENTIFIER,
/* Display name of the ESS job */
J.JOB_DISPLAY_NAME AS JOB_NAME,
J.APPLICATION AS APPLICATION,
J.PRODUCT AS PRODUCT,
J.TYPE AS REQUEST_TYPE,
/* Most recent submission time of the job */
J.LAST_RUN_TIME AS LAST_RUN_TIMESTAMP,
J.LAST_RUN_END_TIME AS LAST_RUN_END_TIME,
J.REQUEST_START_TIME AS REQUEST_START_TIME,
-- REQUEST_EVENT_TIME For Log analytics Time Window Incremental Run
J.LAST_RUN_TIME AS REQUEST_EVENT_TIME,
J.REQUEST_COMPLETE_TIME AS REQUEST_COMPLETE_TIME,
J.REQUESTID AS REQUESTID,
J.PARENTREQUESTID AS PARENTREQUESTID,
J.PROCESSGROUP AS PROCESSGROUP,
J.SUBMITTER AS SUBMITTER,
J.SCHEDULED AS SCHEDULED,
J.JOB_DEDUPE_KEY AS JOB_DEDUPE_KEY,
/* Most recent successful completion time */
LS.LAST_SUCCESS_TIME AS LAST_SUCCESS_TIMESTAMP,
/* Runtime (minutes) of the most recent successful run */
ROUND(LS.LAST_RUNTIME_MIN, 2) AS LAST_RUNTIME_MINUTES,
/* Runtime (minutes) of the previous successful run */
ROUND(LS.PREV_RUNTIME_MIN, 2) AS PREVIOUS_RUNTIME_MINUTES,
/* Indicates whether runtime has regressed compared to previous run */
CASE
WHEN LS.PREV_RUNTIME_MIN IS NULL THEN
'INSUFFICIENT_HISTORY'
WHEN JS_HIST.SUCCEEDED_RUNS >= 2 AND LS.PREV_RUNTIME_MIN >= 1
AND LS.LAST_RUNTIME_MIN > LS.PREV_RUNTIME_MIN * P.REGRESSION_FACTOR
THEN
'RUNTIME_REGRESSION'
ELSE
'NORMAL'
END AS RUNTIME_REGRESSION_STATUS,
/* Average runtime over the last N days */
ROUND(RB.AVG_RUNTIME_BASELINE_MIN, 2) AS AVG_RUNTIME_BASELINE_MIN,
/* 95th percentile runtime baseline over the last N days */
ROUND(RB.P95_RUNTIME_BASELINE_MIN, 2) AS P95_RUNTIME_BASELINE_MIN,
/* Number of failed executions in the last 24 hours */
NVL(FC.FAILED_24H_COUNT, 0) AS FAILURES_LAST_24_HOURS,
/* Number of failed executions in the last 7 days */
NVL(FC.FAILED_7D_COUNT, 0) AS FAILURES_LAST_7_DAYS,
/* Count of currently running / blocked / cancelling jobs */
NVL(CR.RUNNING_COUNT, 0) AS CURRENTLY_RUNNING_COUNT,
/* Maximum number of hours a job has been running continuously */
ROUND(NVL(CR.RUNNING_HOURS, 0), 2) AS MAX_RUNNING_DURATION_HOURS,
JS_WIN.TOTAL_RUNS AS TOTAL_RUNS,
JS_WIN.failed_runs AS failed_runs,
JS_WIN.succeeded_runs AS succeeded_runs,
JS_WIN.running_runs AS running_runs,
JS_WIN.blocked_runs AS blocked_runs,
JS_WIN.cancelled_runs AS cancelled_runs,
JS_WIN.warning_runs AS warning_runs,
JS_WIN.queue_pressure AS queue_pressure,
ROUND(JS_HIST.AVG_RUNTIME, 2) AS AVG_RUNTIME_MINUTES,
ROUND(JS_HIST.STDDEV_RUNTIME,2) AS STDDEV_RUNTIME_MINUTES,
/* Bayesian-smoothed probability of failure on the next run */
ROUND((JS_HIST.FAILED_RUNS + 0.5 * JS_HIST.WARNING_RUNS) / (JS_HIST.TOTAL_RUNS), 2) AS PREDICTED_FAILURE_PROBABILITY,
/* Probability that runtime exceeds historical SLA (p95 baseline) */
ROUND(NVL(SP.SLA_BREACH_PROBABILITY, 0), 2) AS SLA_BREACH_PROBABILITY,
/* Runtime volatility index (stddev / mean) */
ROUND((JS_HIST.STDDEV_RUNTIME / NULLIF(JS_HIST.AVG_RUNTIME, 0)), 3) AS RUNTIME_VOLATILITY_INDEX,
/* Trend slope indicating increasing or decreasing runtime over time */
ROUND(TC.RUNTIME_TREND_SLOPE, 3) AS RUNTIME_TREND_SLOPE_PER_RUN,
/* Probability that a currently running job is stuck */
ROUND(NVL(ST.STUCK_PROBABILITY, 0), 3) AS STUCK_JOB_PROBABILITY,
/* Confidence level indicating reliability of job health signals */
CASE
WHEN JS_HIST.SUCCEEDED_RUNS < NVL(:P_MIN_SUCCESS_RUNS,3) THEN 'LOW'
WHEN
(
LEAST(JS_HIST.TOTAL_RUNS / 10, 1) * 0.5
+ (1 - LEAST(JS_HIST.STDDEV_RUNTIME / NULLIF(JS_HIST.AVG_RUNTIME, 0), 1)) * 0.3
+
CASE
WHEN TC.RUNTIME_TREND_SLOPE IS NOT NULL THEN
0.2
ELSE
0
END
) >= 0.75
THEN
'HIGH'
WHEN
(
LEAST(JS_HIST.TOTAL_RUNS / 10, 1) * 0.5
+ (1 - LEAST(JS_HIST.STDDEV_RUNTIME / NULLIF(JS_HIST.AVG_RUNTIME, 0), 1)) * 0.3
+
CASE
WHEN TC.RUNTIME_TREND_SLOPE IS NOT NULL THEN
0.2
ELSE
0
END
) >= 0.40
THEN
'MEDIUM'
ELSE
'LOW'
END AS CONFIDENCE_LEVEL,
ROUND(
LEAST(JS_HIST.TOTAL_RUNS / 10, 1) * 0.5
+ (1 - LEAST(JS_HIST.STDDEV_RUNTIME / NULLIF(JS_HIST.AVG_RUNTIME, 0), 1)) * 0.3
+ CASE WHEN TC.RUNTIME_TREND_SLOPE IS NOT NULL THEN 0.2 ELSE 0 END
, 3) AS CONFIDENCE_SCORE_WEIGHTED,
/* Composite risk score combining failure, SLA, volatility and trend */
ROUND(
0.35 * (
(JS_HIST.FAILED_RUNS + 0.5 * JS_HIST.WARNING_RUNS)
/ NULLIF(JS_HIST.TOTAL_RUNS,0)
)
+ 0.25 * NVL(SP.SLA_BREACH_PROBABILITY, 0)
+ 0.15 * LEAST(JS_HIST.STDDEV_RUNTIME / NULLIF(JS_HIST.AVG_RUNTIME, 0), 1)
+ 0.15 * LEAST(ABS(TC.RUNTIME_TREND_SLOPE), 1)
+ 0.10 * NVL(ST.STUCK_PROBABILITY, 0),
3
) AS JOB_RISK_SCORE,
SCH.schedule_start_time,
SCH.schedule_end_time,
SCH.schedule_frequency,
SCH.schedule_interval,
SCH.schedule_ended_flag,
SCH.schedule_overdue_flag,
SCH.high_frequency_schedule_flag,
lrq.last_request_id,
lsr.last_success_request_id,
lfr.last_failed_request_id,
lrr.longest_running_request_id,
SCHCNT.ADHOC_COUNT ADHOC_COUNT,
SCHCNT.SCHEDULE_COUNT SCHEDULE_COUNT
FROM
/* Regression sensitivity parameter */
(
SELECT
NVL(:P_REGRESSION_FACTOR, 1.5) AS REGRESSION_FACTOR
FROM
DUAL
) P,
/* Job master list within monitoring window */
(
SELECT
job_key,
job_display_name,
APPLICATION,
PRODUCT,
TYPE,
last_run_time,
last_run_end_time,
request_start_time,
request_complete_time,
REQUESTID,
PARENTREQUESTID,
PROCESSGROUP,
SUBMITTER,
SCHEDULED,
JOB_DEDUPE_KEY
FROM WINDOW_JOB_ROWS
WHERE anchor_rank = 1
) J,
/* Last and previous successful runtimes */
(
SELECT
JOB_KEY,
MAX(
CASE
WHEN RN = 1 THEN
COMPLETEDTIME
END) AS LAST_SUCCESS_TIME,
MAX(
CASE
WHEN RN = 1 THEN
RUNTIME_MIN
END) AS LAST_RUNTIME_MIN,
MAX(
CASE
WHEN RN = 2 THEN
RUNTIME_MIN
END) AS PREV_RUNTIME_MIN
FROM
(
SELECT
JOB_KEY,
COMPLETEDTIME,
RUNTIME_MIN,
ROW_NUMBER() OVER ( PARTITION BY JOB_KEY ORDER BY COMPLETEDTIME DESC ) RN
FROM
SUCCESS_ROWS
)
GROUP BY
JOB_KEY
) LS,
/* Runtime baseline statistics,HISTORICAL CONTEXT (prediction, baselines) */
(
SELECT
JOB_KEY,
AVG_RUNTIME_BASELINE_MIN,
P95_RUNTIME_BASELINE_MIN
FROM
SUCCESS_DIST
) RB,
/* Failure counts – rolling windows */
(
SELECT
JOB_KEY,
FAILED_24H_COUNT,
FAILED_7D_COUNT
FROM HIST_AGG
) FC
,
/* Currently running job metrics */
(
SELECT
JOB_KEY,
RUNNING_COUNT,
RUNNING_HOURS
FROM RUNNING_AGG
) CR,
/* Job execution statistics, HISTORICAL CONTEXT (prediction, baselines) */
(
SELECT
job_key,
total_runs,
failed_runs,
succeeded_runs,
running_runs,
blocked_runs,
cancelled_runs,
warning_runs,
queue_pressure,
avg_runtime,
stddev_runtime
FROM HIST_AGG
) JS_HIST
,
/* Job execution statistics, windowed execution stats */
(
SELECT
DEFINITION AS job_key,
/* Total executions in time window */
COUNT(1) AS total_runs,
/* Failure counts */
SUM(CASE WHEN state IN (10,15,18,19) THEN 1 ELSE 0 END) AS failed_runs,
/* Success count (explicit, useful for APIs and dashboards) */
SUM(CASE WHEN state IN (12,17) THEN 1 ELSE 0 END) AS succeeded_runs,
/* Currently running */
SUM(CASE WHEN state = 3 THEN 1 ELSE 0 END) AS running_runs,
/* Blocked jobs */
SUM(CASE WHEN state = 5 THEN 1 ELSE 0 END) AS blocked_runs,
/* Cancelled */
SUM(CASE WHEN state IN (7,9) THEN 1 ELSE 0 END) AS cancelled_runs,
/* Warning */
SUM(CASE WHEN state IN (11) THEN 1 ELSE 0 END) AS warning_runs,
/* Queue Pressure */
SUM(CASE WHEN state IN (1,2,6,13,14,20) THEN 1 ELSE 0 END) queue_pressure
FROM WINDOW_STAT_ROWS
WHERE 1=1
-- Get Execution Count in Time Bracket.
AND PROCESSSTART >= TO_TIMESTAMP_TZ(:P_FROM_TIMESTAMP,'YYYY-MM-DD"T"HH24:MI:SS.FF3')
AND PROCESSSTART < TO_TIMESTAMP_TZ(:P_TO_TIMESTAMP,'YYYY-MM-DD"T"HH24:MI:SS.FF3')
GROUP BY
DEFINITION
) JS_WIN
,
/* SLA breach probability using analytic percentile - HISTORICAL CONTEXT (prediction, baselines) */
(
SELECT
JOB_KEY,
SUM(
CASE
WHEN RUNTIME_MIN > P95_RUNTIME THEN
1
ELSE
0
END) / COUNT(1) AS SLA_BREACH_PROBABILITY
FROM
(
SELECT
JOB_KEY,
RUNTIME_MIN,
PERCENTILE_CONT(0.95) WITHIN GROUP (ORDER BY RUNTIME_MIN) OVER (PARTITION BY JOB_KEY) AS P95_RUNTIME
FROM
SLA_ROWS
)
GROUP BY
JOB_KEY
) SP,
/* Runtime trend (regression slope), HISTORICAL CONTEXT (prediction, baselines) */
(
SELECT
JOB_KEY,
REGR_SLOPE(RUNTIME_MIN, RUN_SEQ) AS RUNTIME_TREND_SLOPE
FROM
(
SELECT
sr.JOB_KEY,
sr.RUNTIME_MIN,
ROW_NUMBER() OVER ( PARTITION BY sr.JOB_KEY ORDER BY sr.PROCESSSTART ) RUN_SEQ
FROM
SUCCESS_ROWS sr,
PARAMS prm
WHERE sr.PROCESSSTART < prm.P_TO_TS
)
GROUP BY
JOB_KEY
) TC
,
/* ---------------------------------------------
--Probability of a job being stuck
--Normalized runtime overrun model
--------------------------------------------- */
(
SELECT
R.JOB_KEY,
CASE
/* No historical baseline → cannot infer */
WHEN D.P95 IS NULL OR D.P50 IS NULL THEN 0
/* Runtime has not crossed P95 yet */
WHEN R.RUNTIME_MIN <= D.P95 THEN 0
/* Normalized overrun probability */
ELSE
ROUND(
LEAST(
1,
(R.RUNTIME_MIN - D.P95)
/ NULLIF(
GREATEST(D.P95 - D.P50, D.P50 * 0.25),
0
)
),
3
)
END AS STUCK_PROBABILITY
FROM
/* Current running jobs */
(
SELECT
JOB_KEY,
RUNTIME_MIN
FROM RUNNING_ROWS
) R,
/* Historical successful runtime distribution */
(
SELECT
JOB_KEY,
P50_RUNTIME_BASELINE_MIN AS P50,
P95_RUNTIME_BASELINE_MIN AS P95
FROM SUCCESS_DIST
) D
WHERE R.JOB_KEY = D.JOB_KEY
) ST,
(
SELECT
job_key,
CASE
WHEN REGEXP_LIKE(
SUBSTR(schedule_xml, INSTR(schedule_xml, '<start>') + 7, 30),
'^\d{4}-\d{2}-\d{2}'
)
THEN
TO_TIMESTAMP(
REPLACE(SUBSTR(schedule_xml, INSTR(schedule_xml, '<start>') + 7, 19), 'T', ' '),
'YYYY-MM-DD HH24:MI:SS'
)
END AS schedule_start_time,
CASE
WHEN REGEXP_LIKE(
SUBSTR(schedule_xml, INSTR(schedule_xml, '<end>') + 5, 30),
'^\d{4}-\d{2}-\d{2}'
)
THEN
TO_TIMESTAMP(
REPLACE(SUBSTR(schedule_xml, INSTR(schedule_xml, '<end>') + 5, 19), 'T', ' '),
'YYYY-MM-DD HH24:MI:SS'
)
END AS schedule_end_time,
SUBSTR(
schedule_xml,
INSTR(schedule_xml, '<frequency>') + LENGTH('<frequency>'),
INSTR(schedule_xml, '</frequency>') - INSTR(schedule_xml, '<frequency>') - LENGTH('<frequency>')
) AS schedule_frequency,
TO_NUMBER(
SUBSTR(
schedule_xml,
INSTR(schedule_xml, '<interval>') + LENGTH('<interval>'),
INSTR(schedule_xml, '</interval>') - INSTR(schedule_xml, '<interval>') - LENGTH('<interval>')
)
) AS schedule_interval,
CASE
WHEN state IN (16, 17) THEN 'Y'
ELSE 'N'
END AS schedule_ended_flag,
CASE
WHEN
REGEXP_LIKE(
SUBSTR(schedule_xml, INSTR(schedule_xml, '<end>') + 5, 30),
'^\d{4}-\d{2}-\d{2}'
)
AND
TO_TIMESTAMP_TZ(
REPLACE(SUBSTR(schedule_xml, INSTR(schedule_xml, '<end>') + 5, 19), 'T', ' ') || ' +00:00',
'YYYY-MM-DD HH24:MI:SS TZH:TZM'
)
<
TO_TIMESTAMP_TZ(:P_TO_TIMESTAMP,'YYYY-MM-DD"T"HH24:MI:SS.FF3')
AND state NOT IN (16,17)
THEN 'Y'
ELSE 'N'
END AS schedule_overdue_flag,
CASE
WHEN
SUBSTR(
schedule_xml,
INSTR(schedule_xml, '<frequency>') + LENGTH('<frequency>'),
INSTR(schedule_xml, '</frequency>') - INSTR(schedule_xml, '<frequency>') - LENGTH('<frequency>')
) LIKE '%MINUTELY%'
OR
(
SUBSTR(
schedule_xml,
INSTR(schedule_xml, '<frequency>') + LENGTH('<frequency>'),
INSTR(schedule_xml, '</frequency>') - INSTR(schedule_xml, '<frequency>') - LENGTH('<frequency>')
) LIKE '%HOURLY%'
AND TO_NUMBER(
SUBSTR(
schedule_xml,
INSTR(schedule_xml, '<interval>') + LENGTH('<interval>'),
INSTR(schedule_xml, '</interval>') - INSTR(schedule_xml, '<interval>') - LENGTH('<interval>')
)
) <= 60
)
THEN 'Y'
ELSE 'N'
END AS high_frequency_schedule_flag
FROM
(
SELECT
job_key,
state,
REPLACE(utl_raw.cast_to_varchar2(adhocschedule), chr(0), '') AS schedule_xml
FROM SCHEDULE_RANKED
WHERE rn = 1
)
) SCH
,
(
SELECT
job_key,
last_request_id
FROM HIST_AGG
) lrq,
(
SELECT
job_key,
last_success_request_id
FROM HIST_AGG
) lsr,
(
SELECT
job_key,
last_failed_request_id
FROM HIST_AGG
) lfr,
(
SELECT
job_key,
longest_running_request_id
FROM RUNNING_AGG
) lrr,
(
SELECT erh.definition AS job_key,
COUNT(CASE WHEN rh.adhocschedule IS NULL THEN 1 END) AS ADHOC_COUNT,
COUNT(CASE WHEN rh.adhocschedule IS NOT NULL THEN 1 END) AS SCHEDULE_COUNT
FROM fusion_ora_ess.request_history rh,
WINDOW_STAT_ROWS erh
WHERE erh.requestid = rh.requestid
-- Get Counts for provided ranges.
AND erh.PROCESSSTART >= TO_TIMESTAMP_TZ(:P_FROM_TIMESTAMP,'YYYY-MM-DD"T"HH24:MI:SS.FF3')
AND erh.PROCESSSTART < TO_TIMESTAMP_TZ(:P_TO_TIMESTAMP,'YYYY-MM-DD"T"HH24:MI:SS.FF3')
GROUP BY erh.definition
) SCHCNT
WHERE
1=1
AND J.JOB_KEY = LS.JOB_KEY(+)
AND J.JOB_KEY = RB.JOB_KEY(+)
AND J.JOB_KEY = FC.JOB_KEY(+)
AND J.JOB_KEY = CR.JOB_KEY(+)
AND J.JOB_KEY = JS_HIST.JOB_KEY(+)
AND J.JOB_KEY = JS_WIN.JOB_KEY(+)
AND J.JOB_KEY = SP.JOB_KEY(+)
AND J.JOB_KEY = TC.JOB_KEY(+)
AND J.JOB_KEY = ST.JOB_KEY(+)
AND j.job_key = SCH.job_key(+)
AND j.job_key = lrq.job_key(+)
AND j.job_key = lsr.job_key(+)
AND j.job_key = lfr.job_key(+)
AND j.job_key = lrr.job_key(+)
AND j.job_key = SCHCNT.job_key(+)
) Q
ORDER BY Q.REQUEST_EVENT_TIME DESC
)
SELECT *
FROM JOB_DATA
UNION ALL
SELECT
/* all business columns */
NULL AS JOB_IDENTIFIER,
NULL AS JOB_NAME,
NULL AS APPLICATION,
NULL AS PRODUCT,
NULL AS REQUEST_TYPE,
NULL AS LAST_RUN_TIMESTAMP,
NULL AS LAST_RUN_END_TIME,
NULL AS REQUEST_START_TIME,
-- NULL AS REQUEST_EVENT_TIME,
TO_TIMESTAMP_TZ(:P_TO_TIMESTAMP,'YYYY-MM-DD"T"HH24:MI:SS.FF3') REQUEST_EVENT_TIME,
NULL AS REQUEST_COMPLETE_TIME,
NULL AS REQUESTID,
NULL AS PARENTREQUESTID,
NULL AS PROCESSGROUP,
NULL AS SUBMITTER,
NULL AS SCHEDULED,
NULL AS LAST_SUCCESS_TIMESTAMP,
NULL AS LAST_RUNTIME_MINUTES,
NULL AS PREVIOUS_RUNTIME_MINUTES,
NULL AS RUNTIME_REGRESSION_STATUS,
NULL AS AVG_RUNTIME_BASELINE_MIN,
NULL AS P95_RUNTIME_BASELINE_MIN,
0 AS FAILURES_LAST_24_HOURS,
0 AS FAILURES_LAST_7_DAYS,
0 AS CURRENTLY_RUNNING_COUNT,
0 AS MAX_RUNNING_DURATION_HOURS,
0 AS TOTAL_RUNS,
0 AS FAILED_RUNS,
0 AS SUCCEEDED_RUNS,
0 AS RUNNING_RUNS,
0 AS BLOCKED_RUNS,
0 AS CANCELLED_RUNS,
0 AS WARNING_RUNS,
0 AS QUEUE_PRESSURE,
NULL AS AVG_RUNTIME_MINUTES,
NULL AS STDDEV_RUNTIME_MINUTES,
NULL AS PREDICTED_FAILURE_PROBABILITY,
NULL AS SLA_BREACH_PROBABILITY,
NULL AS RUNTIME_VOLATILITY_INDEX,
NULL AS RUNTIME_TREND_SLOPE_PER_RUN,
NULL AS STUCK_JOB_PROBABILITY,
NULL AS CONFIDENCE_LEVEL,
NULL AS CONFIDENCE_SCORE_WEIGHTED,
NULL AS JOB_RISK_SCORE,
NULL AS SCHEDULE_START_TIME,
NULL AS SCHEDULE_END_TIME,
NULL AS SCHEDULE_FREQUENCY,
NULL AS SCHEDULE_INTERVAL,
NULL AS SCHEDULE_ENDED_FLAG,
NULL AS SCHEDULE_OVERDUE_FLAG,
NULL AS HIGH_FREQUENCY_SCHEDULE_FLAG,
NULL AS LAST_REQUEST_ID,
NULL AS LAST_SUCCESS_REQUEST_ID,
NULL AS LAST_FAILED_REQUEST_ID,
NULL AS LONGEST_RUNNING_REQUEST_ID,
0 AS ADHOC_COUNT,
0 AS SCHEDULE_COUNT,
/* ---- Metadata ---- */
TO_CHAR(
TO_TIMESTAMP_TZ(:P_FROM_TIMESTAMP,'YYYY-MM-DD"T"HH24:MI:SS.FF3'),
'YYYY-MM-DD"T"HH24:MI:SS"Z"'
) AS META_FROM_TIMESTAMP,
TO_CHAR(
TO_TIMESTAMP_TZ(:P_TO_TIMESTAMP,'YYYY-MM-DD"T"HH24:MI:SS.FF3'),
'YYYY-MM-DD"T"HH24:MI:SS"Z"'
) AS META_TO_TIMESTAMP,
TO_CHAR(
SYSTIMESTAMP AT TIME ZONE 'UTC',
'YYYY-MM-DD"T"HH24:MI:SS"Z"'
) AS META_GENERATED_AT,
0 AS META_RECORD_COUNT,
'N' AS ALERT_FLAG,
NULL AS ALERT_REASON,
'LOW' AS ALERT_SEVERITY,
'RECORD_TYPE' ATTRIBUTE_NAME1,
'CHECKPOINT' ATTRIBUTE_VAL1,
NULL ATTRIBUTE_NAME2,
NULL ATTRIBUTE_VAL2,
NULL ATTRIBUTE_NAME3,
NULL ATTRIBUTE_VAL3,
NULL ATTRIBUTE_NAME4,
NULL ATTRIBUTE_VAL4,
NULL ATTRIBUTE_NAME5,
NULL ATTRIBUTE_VAL5
FROM dual
WHERE NOT EXISTS
(
SELECT 1 FROM JOB_DATA
)
BI Report XSL Template
<?xml version="1.0" encoding="UTF-8"?>
<xsl:stylesheet xmlns:xsl="http://www.w3.org/1999/XSL/Transform"
                version="1.0">
  <xsl:output method="xml" indent="yes" encoding="UTF-8"/>
  <xsl:template match="/">
    <DATA_DS xmlns="http://xmlns.oracle.com/cloud/adapter/nxsd/surrogate/readstagefilesfromSOAP">
      <!-- Header (single occurrence) -->
      <HEADER>
        <META_FROM_TIMESTAMP>
          <xsl:value-of select="/DATA_DS/G_1[1]/META_FROM_TIMESTAMP"/>
        </META_FROM_TIMESTAMP>
        <META_TO_TIMESTAMP>
          <xsl:value-of select="/DATA_DS/G_1[1]/META_TO_TIMESTAMP"/>
        </META_TO_TIMESTAMP>
        <META_GENERATED_AT>
          <xsl:value-of select="/DATA_DS/G_1[1]/META_GENERATED_AT"/>
        </META_GENERATED_AT>
        <META_RECORD_COUNT>
          <xsl:value-of select="/DATA_DS/G_1[1]/META_RECORD_COUNT"/>
        </META_RECORD_COUNT>
      </HEADER>
      <!-- Rows -->
      <ROWS>
        <xsl:for-each select="/DATA_DS/G_1">
          <G1>
            <JOB_IDENTIFIER><xsl:value-of select="JOB_IDENTIFIER"/></JOB_IDENTIFIER>
            <JOB_NAME><xsl:value-of select="JOB_NAME"/></JOB_NAME>
            <APPLICATION><xsl:value-of select="APPLICATION"/></APPLICATION>
            <PRODUCT><xsl:value-of select="PRODUCT"/></PRODUCT>
            <REQUEST_TYPE><xsl:value-of select="REQUEST_TYPE"/></REQUEST_TYPE>
            <LAST_RUN_TIMESTAMP><xsl:value-of select="LAST_RUN_TIMESTAMP"/></LAST_RUN_TIMESTAMP>
            <LAST_RUN_END_TIME><xsl:value-of select="LAST_RUN_END_TIME"/></LAST_RUN_END_TIME>
            <REQUEST_START_TIME><xsl:value-of select="REQUEST_START_TIME"/></REQUEST_START_TIME>
            <REQUEST_EVENT_TIME><xsl:value-of select="REQUEST_EVENT_TIME"/></REQUEST_EVENT_TIME>
            <REQUEST_COMPLETE_TIME><xsl:value-of select="REQUEST_COMPLETE_TIME"/></REQUEST_COMPLETE_TIME>
            <REQUESTID><xsl:value-of select="REQUESTID"/></REQUESTID>
            <PARENTREQUESTID><xsl:value-of select="PARENTREQUESTID"/></PARENTREQUESTID>
            <PROCESSGROUP><xsl:value-of select="PROCESSGROUP"/></PROCESSGROUP>
            <SUBMITTER><xsl:value-of select="SUBMITTER"/></SUBMITTER>
            <SCHEDULED><xsl:value-of select="SCHEDULED"/></SCHEDULED>
            <LAST_SUCCESS_TIMESTAMP><xsl:value-of select="LAST_SUCCESS_TIMESTAMP"/></LAST_SUCCESS_TIMESTAMP>
            <LAST_RUNTIME_MINUTES><xsl:value-of select="LAST_RUNTIME_MINUTES"/></LAST_RUNTIME_MINUTES>
            <PREVIOUS_RUNTIME_MINUTES><xsl:value-of select="PREVIOUS_RUNTIME_MINUTES"/></PREVIOUS_RUNTIME_MINUTES>
            <RUNTIME_REGRESSION_STATUS><xsl:value-of select="RUNTIME_REGRESSION_STATUS"/></RUNTIME_REGRESSION_STATUS>
            <AVG_RUNTIME_BASELINE_MIN><xsl:value-of select="AVG_RUNTIME_BASELINE_MIN"/></AVG_RUNTIME_BASELINE_MIN>
            <P95_RUNTIME_BASELINE_MIN><xsl:value-of select="P95_RUNTIME_BASELINE_MIN"/></P95_RUNTIME_BASELINE_MIN>
            <FAILURES_LAST_24_HOURS><xsl:value-of select="FAILURES_LAST_24_HOURS"/></FAILURES_LAST_24_HOURS>
            <FAILURES_LAST_7_DAYS><xsl:value-of select="FAILURES_LAST_7_DAYS"/></FAILURES_LAST_7_DAYS>
            <CURRENTLY_RUNNING_COUNT><xsl:value-of select="CURRENTLY_RUNNING_COUNT"/></CURRENTLY_RUNNING_COUNT>
            <MAX_RUNNING_DURATION_HOURS><xsl:value-of select="MAX_RUNNING_DURATION_HOURS"/></MAX_RUNNING_DURATION_HOURS>
            <TOTAL_RUNS><xsl:value-of select="TOTAL_RUNS"/></TOTAL_RUNS>
            <FAILED_RUNS><xsl:value-of select="FAILED_RUNS"/></FAILED_RUNS>
            <SUCCEEDED_RUNS><xsl:value-of select="SUCCEEDED_RUNS"/></SUCCEEDED_RUNS>
            <RUNNING_RUNS><xsl:value-of select="RUNNING_RUNS"/></RUNNING_RUNS>
            <BLOCKED_RUNS><xsl:value-of select="BLOCKED_RUNS"/></BLOCKED_RUNS>
            <CANCELLED_RUNS><xsl:value-of select="CANCELLED_RUNS"/></CANCELLED_RUNS>
            <WARNING_RUNS><xsl:value-of select="WARNING_RUNS"/></WARNING_RUNS>
            <ADHOC_COUNT><xsl:value-of select="ADHOC_COUNT"/></ADHOC_COUNT>
            <SCHEDULE_COUNT><xsl:value-of select="SCHEDULE_COUNT"/></SCHEDULE_COUNT>
            <QUEUE_PRESSURE><xsl:value-of select="QUEUE_PRESSURE"/></QUEUE_PRESSURE>
            <AVG_RUNTIME_MINUTES><xsl:value-of select="AVG_RUNTIME_MINUTES"/></AVG_RUNTIME_MINUTES>
            <STDDEV_RUNTIME_MINUTES><xsl:value-of select="STDDEV_RUNTIME_MINUTES"/></STDDEV_RUNTIME_MINUTES>
            <PREDICTED_FAILURE_PROBABILITY><xsl:value-of select="PREDICTED_FAILURE_PROBABILITY"/></PREDICTED_FAILURE_PROBABILITY>
            <SLA_BREACH_PROBABILITY><xsl:value-of select="SLA_BREACH_PROBABILITY"/></SLA_BREACH_PROBABILITY>
            <RUNTIME_VOLATILITY_INDEX><xsl:value-of select="RUNTIME_VOLATILITY_INDEX"/></RUNTIME_VOLATILITY_INDEX>
            <RUNTIME_TREND_SLOPE_PER_RUN><xsl:value-of select="RUNTIME_TREND_SLOPE_PER_RUN"/></RUNTIME_TREND_SLOPE_PER_RUN>
            <STUCK_JOB_PROBABILITY><xsl:value-of select="STUCK_JOB_PROBABILITY"/></STUCK_JOB_PROBABILITY>
            <CONFIDENCE_LEVEL><xsl:value-of select="CONFIDENCE_LEVEL"/></CONFIDENCE_LEVEL>
            <CONFIDENCE_SCORE_WEIGHTED><xsl:value-of select="CONFIDENCE_SCORE_WEIGHTED"/></CONFIDENCE_SCORE_WEIGHTED>
            <JOB_RISK_SCORE><xsl:value-of select="JOB_RISK_SCORE"/></JOB_RISK_SCORE>
            <SCHEDULE_START_TIME><xsl:value-of select="SCHEDULE_START_TIME"/></SCHEDULE_START_TIME>
            <SCHEDULE_END_TIME><xsl:value-of select="SCHEDULE_END_TIME"/></SCHEDULE_END_TIME>
            <SCHEDULE_FREQUENCY><xsl:value-of select="SCHEDULE_FREQUENCY"/></SCHEDULE_FREQUENCY>
            <SCHEDULE_INTERVAL><xsl:value-of select="SCHEDULE_INTERVAL"/></SCHEDULE_INTERVAL>
            <SCHEDULE_ENDED_FLAG><xsl:value-of select="SCHEDULE_ENDED_FLAG"/></SCHEDULE_ENDED_FLAG>
            <SCHEDULE_OVERDUE_FLAG><xsl:value-of select="SCHEDULE_OVERDUE_FLAG"/></SCHEDULE_OVERDUE_FLAG>
            <HIGH_FREQUENCY_SCHEDULE_FLAG><xsl:value-of select="HIGH_FREQUENCY_SCHEDULE_FLAG"/></HIGH_FREQUENCY_SCHEDULE_FLAG>
            <LAST_REQUEST_ID><xsl:value-of select="LAST_REQUEST_ID"/></LAST_REQUEST_ID>
            <LAST_SUCCESS_REQUEST_ID><xsl:value-of select="LAST_SUCCESS_REQUEST_ID"/></LAST_SUCCESS_REQUEST_ID>
            <LAST_FAILED_REQUEST_ID><xsl:value-of select="LAST_FAILED_REQUEST_ID"/></LAST_FAILED_REQUEST_ID>
            <LONGEST_RUNNING_REQUEST_ID><xsl:value-of select="LONGEST_RUNNING_REQUEST_ID"/></LONGEST_RUNNING_REQUEST_ID>
            <ALERT_FLAG><xsl:value-of select="ALERT_FLAG"/></ALERT_FLAG>
            <ALERT_SEVERITY><xsl:value-of select="ALERT_SEVERITY"/></ALERT_SEVERITY>
            <ALERT_REASON><xsl:value-of select="ALERT_REASON"/></ALERT_REASON>
            <ATTRIBUTE_NAME1><xsl:value-of select="ATTRIBUTE_NAME1"/></ATTRIBUTE_NAME1>
            <ATTRIBUTE_VAL1><xsl:value-of select="ATTRIBUTE_VAL1"/></ATTRIBUTE_VAL1>
            <ATTRIBUTE_NAME2><xsl:value-of select="ATTRIBUTE_NAME2"/></ATTRIBUTE_NAME2>
            <ATTRIBUTE_VAL2><xsl:value-of select="ATTRIBUTE_VAL2"/></ATTRIBUTE_VAL2>
            <ATTRIBUTE_NAME3><xsl:value-of select="ATTRIBUTE_NAME3"/></ATTRIBUTE_NAME3>
            <ATTRIBUTE_VAL3><xsl:value-of select="ATTRIBUTE_VAL3"/></ATTRIBUTE_VAL3>
            <ATTRIBUTE_NAME4><xsl:value-of select="ATTRIBUTE_NAME4"/></ATTRIBUTE_NAME4>
            <ATTRIBUTE_VAL4><xsl:value-of select="ATTRIBUTE_VAL4"/></ATTRIBUTE_VAL4>
            <ATTRIBUTE_NAME5><xsl:value-of select="ATTRIBUTE_NAME5"/></ATTRIBUTE_NAME5>
            <ATTRIBUTE_VAL5><xsl:value-of select="ATTRIBUTE_VAL5"/></ATTRIBUTE_VAL5>
          </G1>
        </xsl:for-each>
      </ROWS>
    </DATA_DS>
  </xsl:template>
</xsl:stylesheet>
Request JSON Payload
{
  "P_FROM_TIMESTAMP": "2026-01-12T06:10:38.808",
  "P_TO_TIMESTAMP": "2026-01-12T06:11:49.771",
  "P_REGRESSION_FACTOR": 1.5,
  "P_MIN_SUCCESS_RUNS": 3,
  "P_STUCK_JOB_PROBABILITY": 0.8,
  "P_JOB_RISK_SCORE": 0.6,
  "P_SLA_BREACH_PROBABILITY": 0.4
}
Response JSON Payload
{
    "meta": {
        "fromTimestamp": "2025-12-03T05:51:20Z",
        "toTimestamp": "2026-01-02T06:07:20Z",
        "generatedAt": "2026-01-03T16:13:45Z",
        "recordCount": 30
    },
    "jobs": [
        {
            "jobIdentifier": "JobDefinition://oracle.apps.ess.biccc/BICloudConnectorJobDefinition",
            "jobName": "BICloudConnectorJobDefinition",
            "application": "oracle.biacm",
            "product": "",
            "requestType": "JAVA_TYPE",
            "lastRunTimestamp": "2026-01-02T03:01:56.597+00:00",
            "lastRunEndTime": "2026-01-02T03:02:01.186+00:00",
            "requestStartTime": "2026-01-02T03:01:53.803+00:00",
            "requestEventTime": "2026-01-02T03:01:53.803+00:00",
            "requestCompleteTime": "2026-01-02T03:02:05.636+00:00",
            "scheduled": "2026-01-02T03:01:53.803+00:00",
            "lastSuccessTimestamp": "2026-01-02T03:02:05.636+00:00",
            "runtime": {
                "lastRuntimeMinutes": 0.08,
                "previousRuntimeMinutes": 0.12,
                "runtimeRegressionStatus": "NORMAL",
                "avgRuntimeBaselineMinutes": 0.47,
                "p95RuntimeBaselineMinutes": 3.38,
                "runtimeVolatilityIndex": 3.987,
                "runtimeTrendSlopePerRun": -0.001
            },
            "executionStats": {
                "totalRuns": 1260,
                "succeededRuns": 1243,
                "failedRuns": 17,
                "runningRuns": 0,
                "blockedRuns": 0,
                "cancelledRuns": 0,
                "warningRuns":0,
                "avgRuntimeMinutes": 0.58,
                "stddevRuntimeMinutes": 2.32,
                "adhocCount": 0,
                "scheduledCount": 0,
                "queuePressure": 0
            },
            "failureMetrics": {
                "failuresLast24Hours": 0,
                "failuresLast7Days": 0,
                "predictedFailureProbability": 0.01
            },
            "slaMetrics": {
                "slaBreachProbability": 0.05
            },
            "runningState": {
                "currentlyRunningCount": 0,
                "maxRunningDurationHours": 0,
                "stuckJobProbability": 0,
                "longestRunningRequestId": null
            },
            "confidence": {
                "confidenceLevel": "MEDIUM",
                "confidenceScoreWeighted": 0.7
            },
            "risk": {
                "jobRiskScore": 0.167
            },
            "schedule": {
                "scheduleStartTime": "",
                "scheduleEndTime": "",
                "scheduleFrequency": "",
                "scheduleInterval": null,
                "scheduleEndedFlag": "",
                "scheduleOverdueFlag": "",
                "highFrequencyScheduleFlag": ""
            },
            "requests": {
                "lastRequestId": 6017055,
                "lastSuccessRequestId": 6017055,
                "lastFailedRequestId": 5924078,
                "RequestId": 6017055,
                "parentRequestId": 601789,
                "processGroup": "FADomain##bi_cluster",
                "submitter": "FAWService_APPID"
            },
            "alert": {
                "alertFlag": "N",
                "alertSeverity": "LOW",
                "alertReason": ""
            },
            "additionalInfo": {
                "attributeName1": "",
                "attributeVal1": "",
                "attributeName2": "",
                "attributeVal2": "",
                "attributeName3": "",
                "attributeVal3": "",
                "attributeName4": "",
                "attributeVal4": "",
                "attributeName5": "",
                "attributeVal5": ""
            }
        }
    ]
}
Custom XSD Schema
<?xml version="1.0" encoding="UTF-8"?>
<xs:schema
  xmlns:xs="http://www.w3.org/2001/XMLSchema"
  targetNamespace="http://xmlns.oracle.com/cloud/adapter/nxsd/surrogate/readstagefilesfromSOAP"
  xmlns:ds="http://xmlns.oracle.com/cloud/adapter/nxsd/surrogate/readstagefilesfromSOAP"
  elementFormDefault="qualified">
  <!-- Root -->
  <xs:element name="DATA_DS">
    <xs:complexType>
      <xs:sequence>
        <!-- Header (single) -->
        <xs:element name="HEADER">
          <xs:complexType>
            <xs:sequence>
              <xs:element name="META_FROM_TIMESTAMP" type="xs:string"/>
              <xs:element name="META_TO_TIMESTAMP" type="xs:string"/>
              <xs:element name="META_GENERATED_AT" type="xs:string"/>
              <xs:element name="META_RECORD_COUNT" type="xs:integer"/>
            </xs:sequence>
          </xs:complexType>
        </xs:element>
        <!-- Rows -->
        <xs:element name="ROWS">
          <xs:complexType>
            <xs:sequence>
              <xs:element name="G1" maxOccurs="unbounded">
                <xs:complexType>
                  <xs:sequence>
                    <!-- Job Identity -->
                    <xs:element name="JOB_IDENTIFIER" type="xs:string"/>
                    <xs:element name="JOB_NAME" type="xs:string"/>
                    <xs:element name="APPLICATION" type="xs:string"/>
                    <xs:element name="PRODUCT" type="xs:string"/>
                    <xs:element name="REQUEST_TYPE" type="xs:string"/>
                    <!-- Job master request list -->
                    <xs:element name="LAST_RUN_TIMESTAMP" type="xs:string" minOccurs="0"/>
                    <xs:element name="LAST_RUN_END_TIME" type="xs:string" minOccurs="0"/>
                    <xs:element name="REQUEST_START_TIME" type="xs:string" minOccurs="0"/>
                    <xs:element name="REQUEST_EVENT_TIME" type="xs:string" minOccurs="0"/>
                    <xs:element name="REQUEST_COMPLETE_TIME" type="xs:string" minOccurs="0"/>
                    <xs:element name="REQUESTID" type="xs:string" minOccurs="0"/>
                    <xs:element name="PARENTREQUESTID" type="xs:string" minOccurs="0"/>
                    <xs:element name="PROCESSGROUP" type="xs:string" minOccurs="0"/>
                    <xs:element name="SUBMITTER" type="xs:string" minOccurs="0"/>
                    <xs:element name="SCHEDULED" type="xs:string" minOccurs="0"/>
                    <xs:element name="LAST_SUCCESS_TIMESTAMP" type="xs:string" minOccurs="0"/>
                    <!-- Runtime -->
                    <xs:element name="LAST_RUNTIME_MINUTES" type="xs:decimal" minOccurs="0"/>
                    <xs:element name="PREVIOUS_RUNTIME_MINUTES" type="xs:decimal" minOccurs="0"/>
                    <xs:element name="RUNTIME_REGRESSION_STATUS" type="xs:string"/>
                    <xs:element name="AVG_RUNTIME_BASELINE_MIN" type="xs:decimal" minOccurs="0"/>
                    <xs:element name="P95_RUNTIME_BASELINE_MIN" type="xs:decimal" minOccurs="0"/>
                    <!-- Failure Metrics -->
                    <xs:element name="FAILURES_LAST_24_HOURS" type="xs:integer"/>
                    <xs:element name="FAILURES_LAST_7_DAYS" type="xs:integer"/>
                    <!-- Running State -->
                    <xs:element name="CURRENTLY_RUNNING_COUNT" type="xs:integer"/>
                    <xs:element name="MAX_RUNNING_DURATION_HOURS" type="xs:decimal"/>
                    <!-- Execution Stats -->
                    <xs:element name="TOTAL_RUNS" type="xs:integer"/>
                    <xs:element name="FAILED_RUNS" type="xs:integer"/>
                    <xs:element name="SUCCEEDED_RUNS" type="xs:integer"/>
                    <xs:element name="RUNNING_RUNS" type="xs:integer"/>
                    <xs:element name="BLOCKED_RUNS" type="xs:integer"/>
                    <xs:element name="CANCELLED_RUNS" type="xs:integer"/>
                    <xs:element name="WARNING_RUNS" type="xs:integer"/>
                    <xs:element name="ADHOC_COUNT" type="xs:integer"/>
                    <xs:element name="SCHEDULE_COUNT" type="xs:integer"/>
                    <xs:element name="QUEUE_PRESSURE" type="xs:integer"/>
                    <xs:element name="AVG_RUNTIME_MINUTES" type="xs:decimal" minOccurs="0"/>
                    <xs:element name="STDDEV_RUNTIME_MINUTES" type="xs:decimal" minOccurs="0"/>
                    <!-- Probabilities -->
                    <xs:element name="PREDICTED_FAILURE_PROBABILITY" type="xs:decimal"/>
                    <xs:element name="SLA_BREACH_PROBABILITY" type="xs:decimal"/>
                    <!-- Trend & Risk -->
                    <xs:element name="RUNTIME_VOLATILITY_INDEX" type="xs:decimal"/>
                    <xs:element name="RUNTIME_TREND_SLOPE_PER_RUN" type="xs:decimal" minOccurs="0"/>
                    <xs:element name="STUCK_JOB_PROBABILITY" type="xs:decimal"/>
                    <!-- Confidence -->
                    <xs:element name="CONFIDENCE_LEVEL" type="xs:string"/>
                    <xs:element name="CONFIDENCE_SCORE_WEIGHTED" type="xs:decimal"/>
                    <!-- Risk -->
                    <xs:element name="JOB_RISK_SCORE" type="xs:decimal"/>
                    <!-- Schedule -->
                    <xs:element name="SCHEDULE_START_TIME" type="xs:string" minOccurs="0"/>
                    <xs:element name="SCHEDULE_END_TIME" type="xs:string" minOccurs="0"/>
                    <xs:element name="SCHEDULE_FREQUENCY" type="xs:string" minOccurs="0"/>
                    <xs:element name="SCHEDULE_INTERVAL" type="xs:integer" minOccurs="0"/>
                    <xs:element name="SCHEDULE_ENDED_FLAG" type="xs:string"/>
                    <xs:element name="SCHEDULE_OVERDUE_FLAG" type="xs:string"/>
                    <xs:element name="HIGH_FREQUENCY_SCHEDULE_FLAG" type="xs:string"/>
                    <!-- Requests -->
                    <xs:element name="LAST_REQUEST_ID" type="xs:long"/>
                    <xs:element name="LAST_SUCCESS_REQUEST_ID" type="xs:long"/>
                    <xs:element name="LAST_FAILED_REQUEST_ID" type="xs:long"/>
                    <xs:element name="LONGEST_RUNNING_REQUEST_ID" type="xs:long"/>
                    <!-- Alert -->
                    <xs:element name="ALERT_FLAG" type="xs:string"/>
                    <xs:element name="ALERT_SEVERITY" type="xs:string"/>
                    <xs:element name="ALERT_REASON" type="xs:string"/>
                    <!-- Additional Attribute -->
                    <xs:element name="ATTRIBUTE_NAME1" type="xs:string"/>
                    <xs:element name="ATTRIBUTE_VAL1" type="xs:string"/>
                    <xs:element name="ATTRIBUTE_NAME2" type="xs:string"/>
                    <xs:element name="ATTRIBUTE_VAL2" type="xs:string"/>
                    <xs:element name="ATTRIBUTE_NAME3" type="xs:string"/>
                    <xs:element name="ATTRIBUTE_VAL3" type="xs:string"/>
                    <xs:element name="ATTRIBUTE_NAME4" type="xs:string"/>
                    <xs:element name="ATTRIBUTE_VAL4" type="xs:string"/>
                    <xs:element name="ATTRIBUTE_NAME5" type="xs:string"/>
                    <xs:element name="ATTRIBUTE_VAL5" type="xs:string"/>
                  </xs:sequence>
                </xs:complexType>
              </xs:element>
            </xs:sequence>
          </xs:complexType>
        </xs:element>
      </xs:sequence>
    </xs:complexType>
  </xs:element>
</xs:schema>