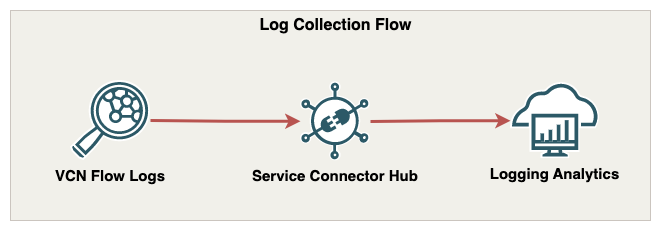
OCI Log Analytics is a scalable, reliable, and real-time log analysis solution. Log Analytics automates the collection of historic and real-time logs from any on-premises or cloud resource. This includes VCN Flow Logs, a visual representation of flow log data is presented with Log Analytics. Including granular filtering and indexing options not available with VCN Flow Logs alone.
With the use of the Log Analytics Compass quick start, I’ll show you how to quickly ingest VCN Flow Logs into Log Analytics.
This blog also has a companion video located here. For more information on this service, see About Log Analytics.
Guide
For this guide we’ll use two VMs located in separate VCNs connected by a DRG. Network traffic is generated between the two VMs and the internet so that we can view the results in Log Analytics. If you’re following along, please be sure Flow Logs are enabled for the subnets in question. This guide shows how to enable VCN Flow Logs on a subnet.

1. The Log Analytics service is available from the top left corner (Hamburger) OCI console menu. Navigate to Observability & Management and click Log Analytics.
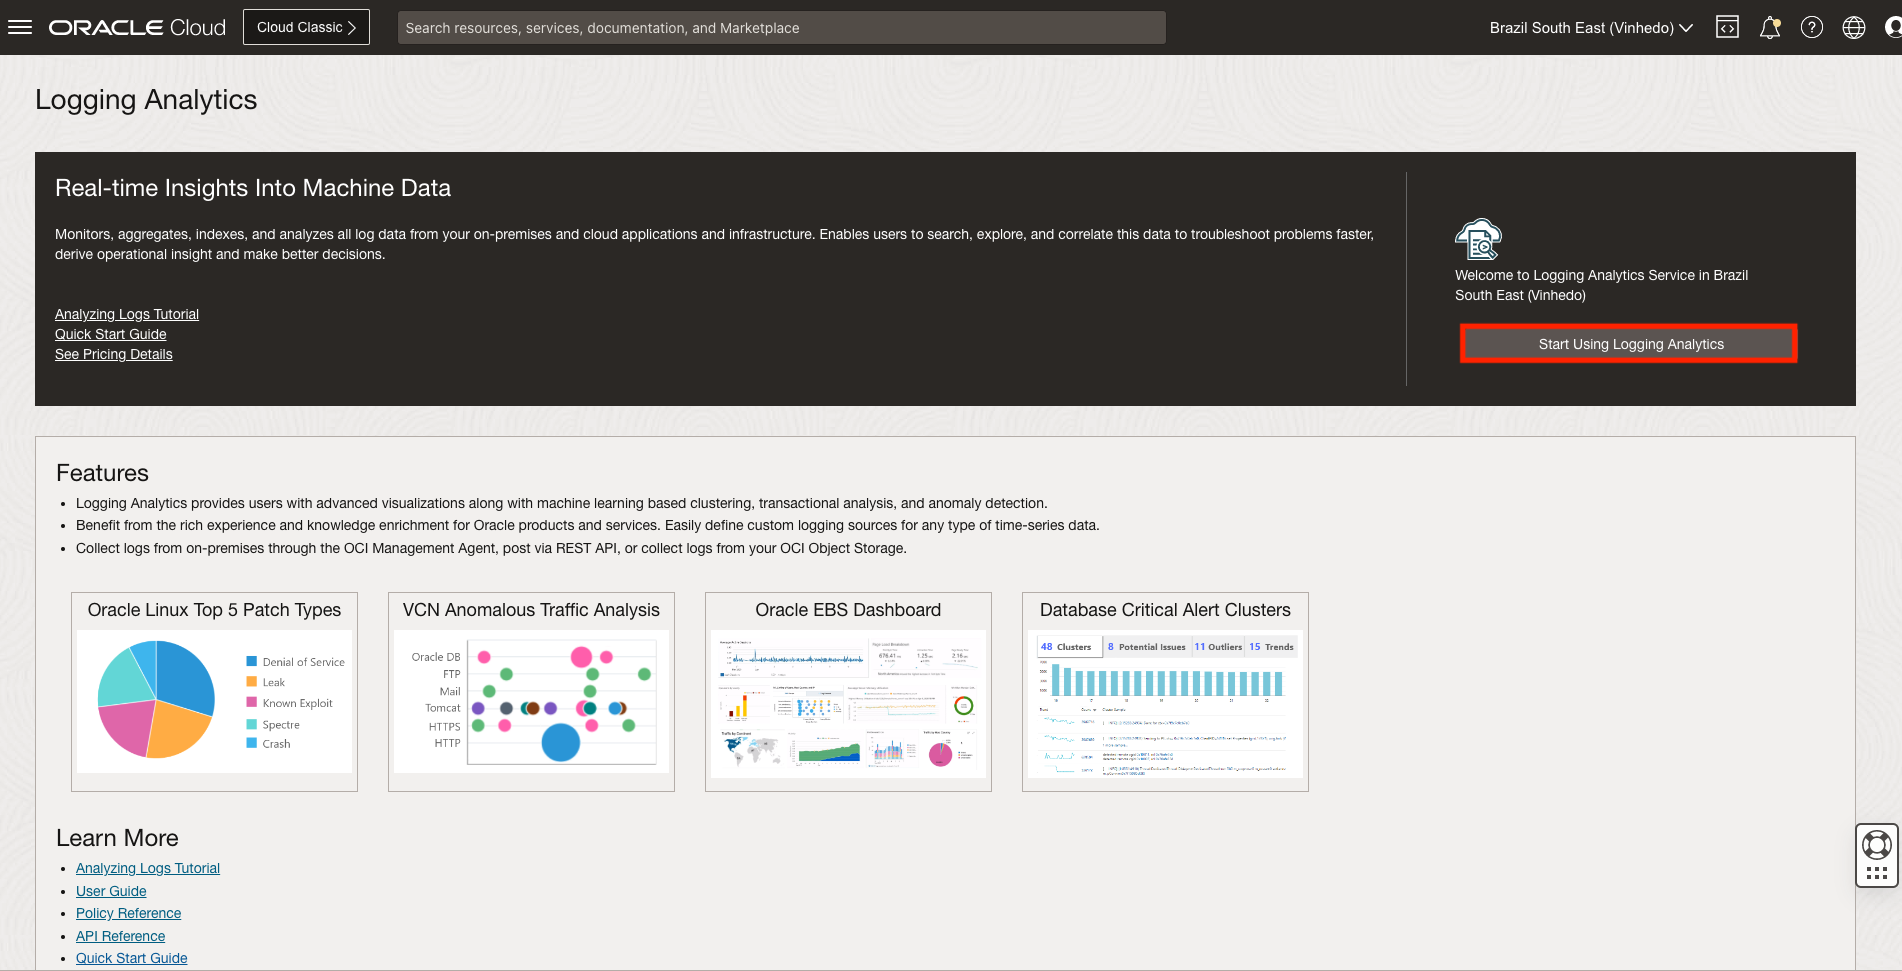
2. If this is the first time you’re using the service in this region, review the onboarding page that will give you some high-level details of the service and an option to Start Using Log Analytics. Click Start Using Log Analytics.
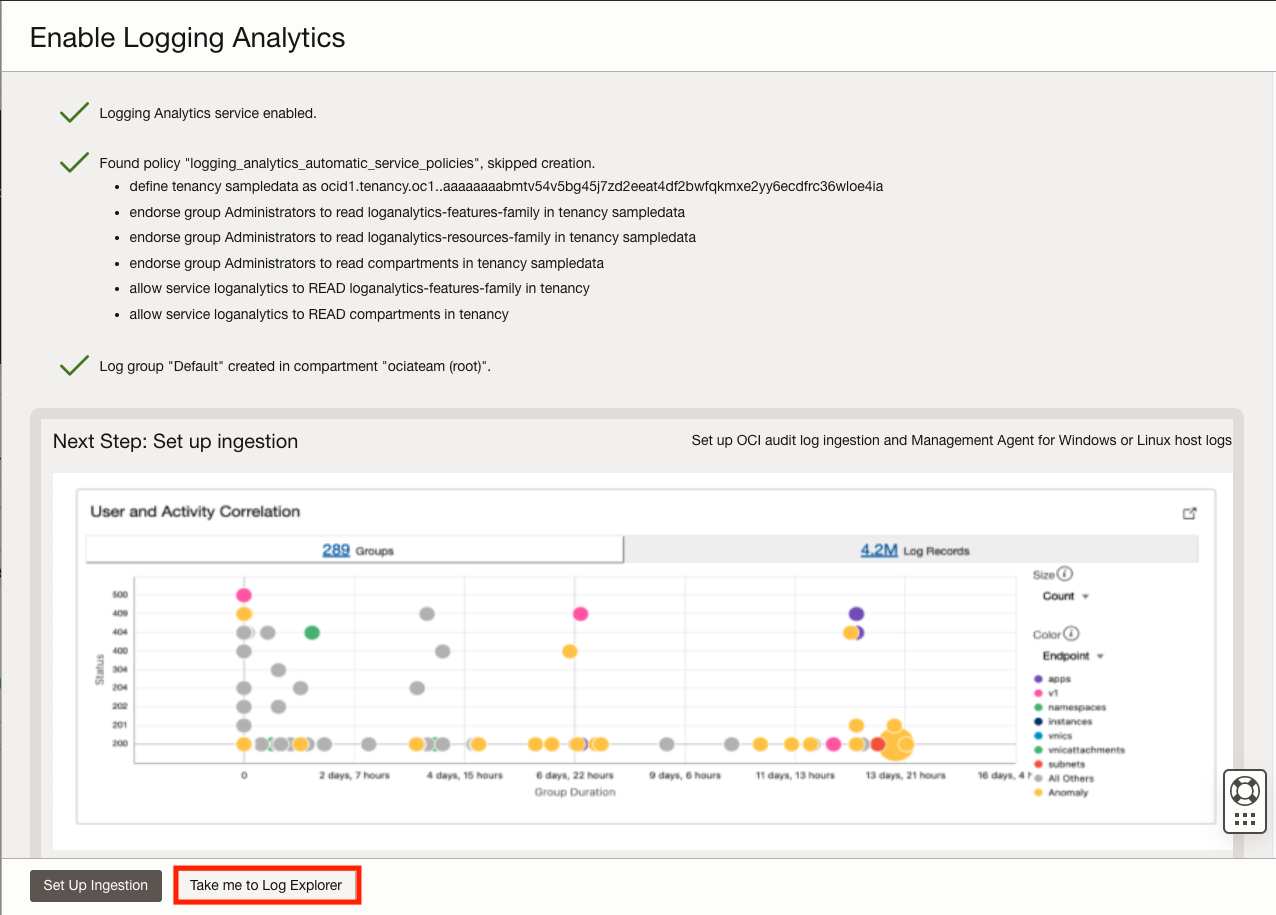
3. Review the policies that are automatically created. A log group called Default is created if it does not exist. After the Log Analytics service is enabled, click Take me to Log Explorer to continue.
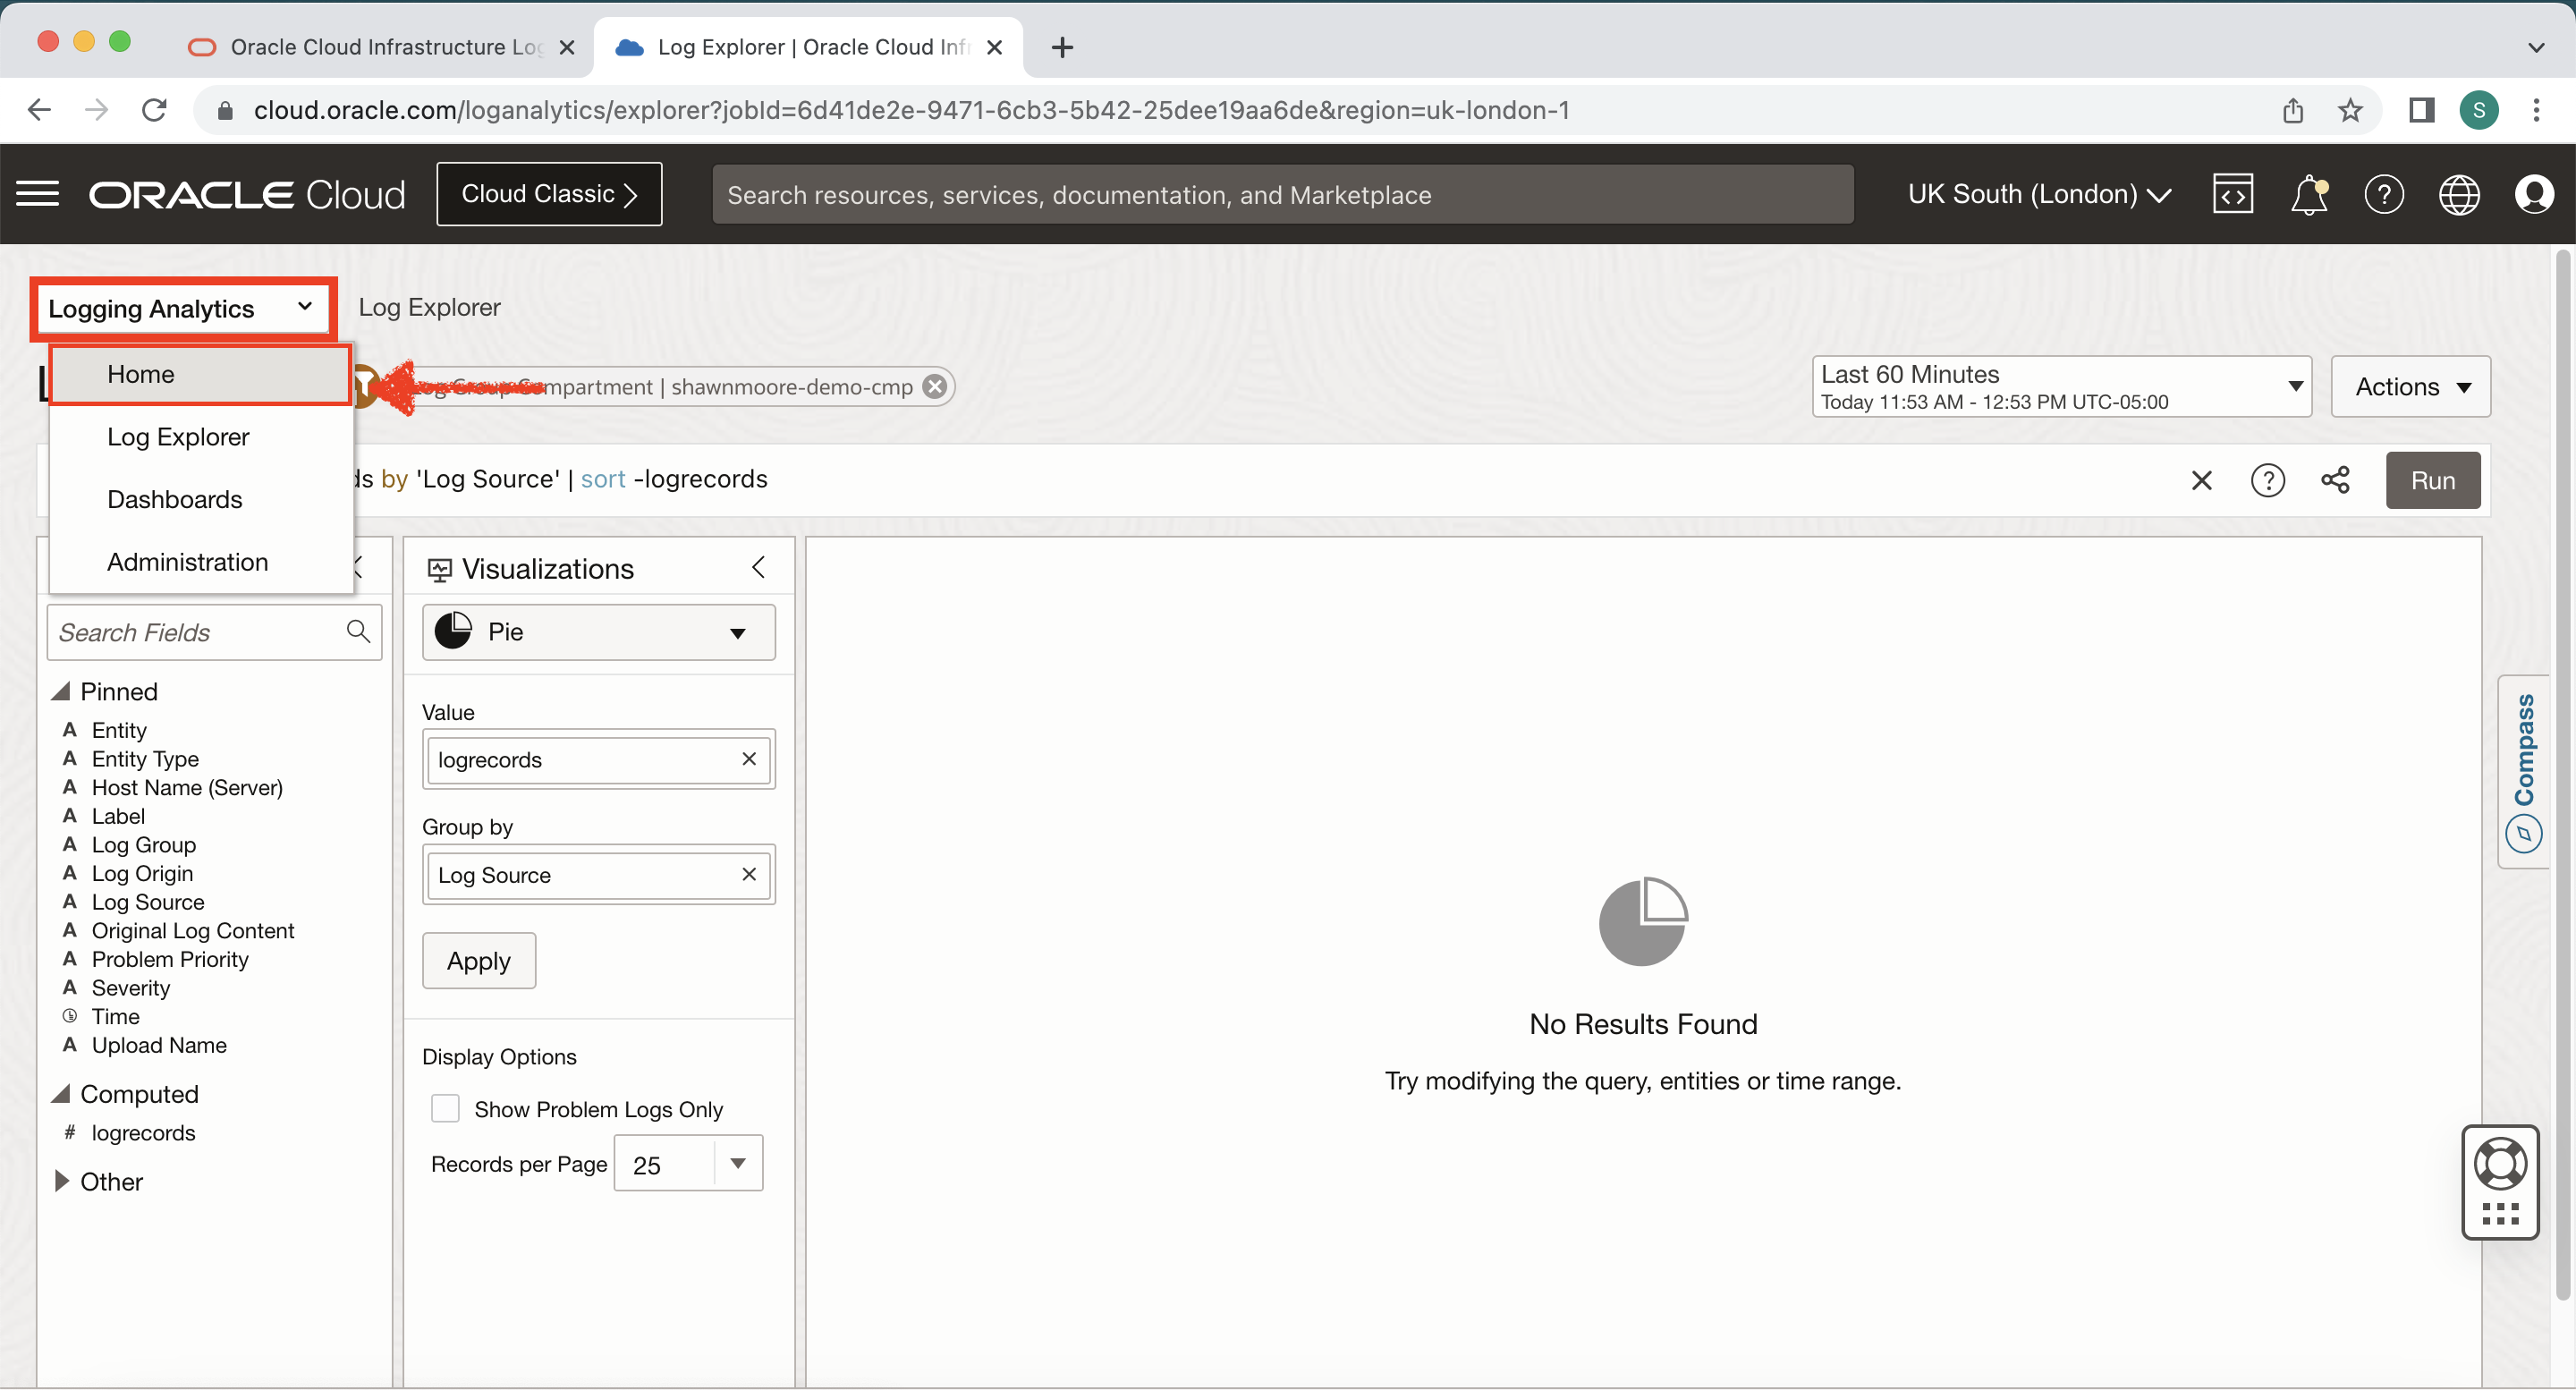
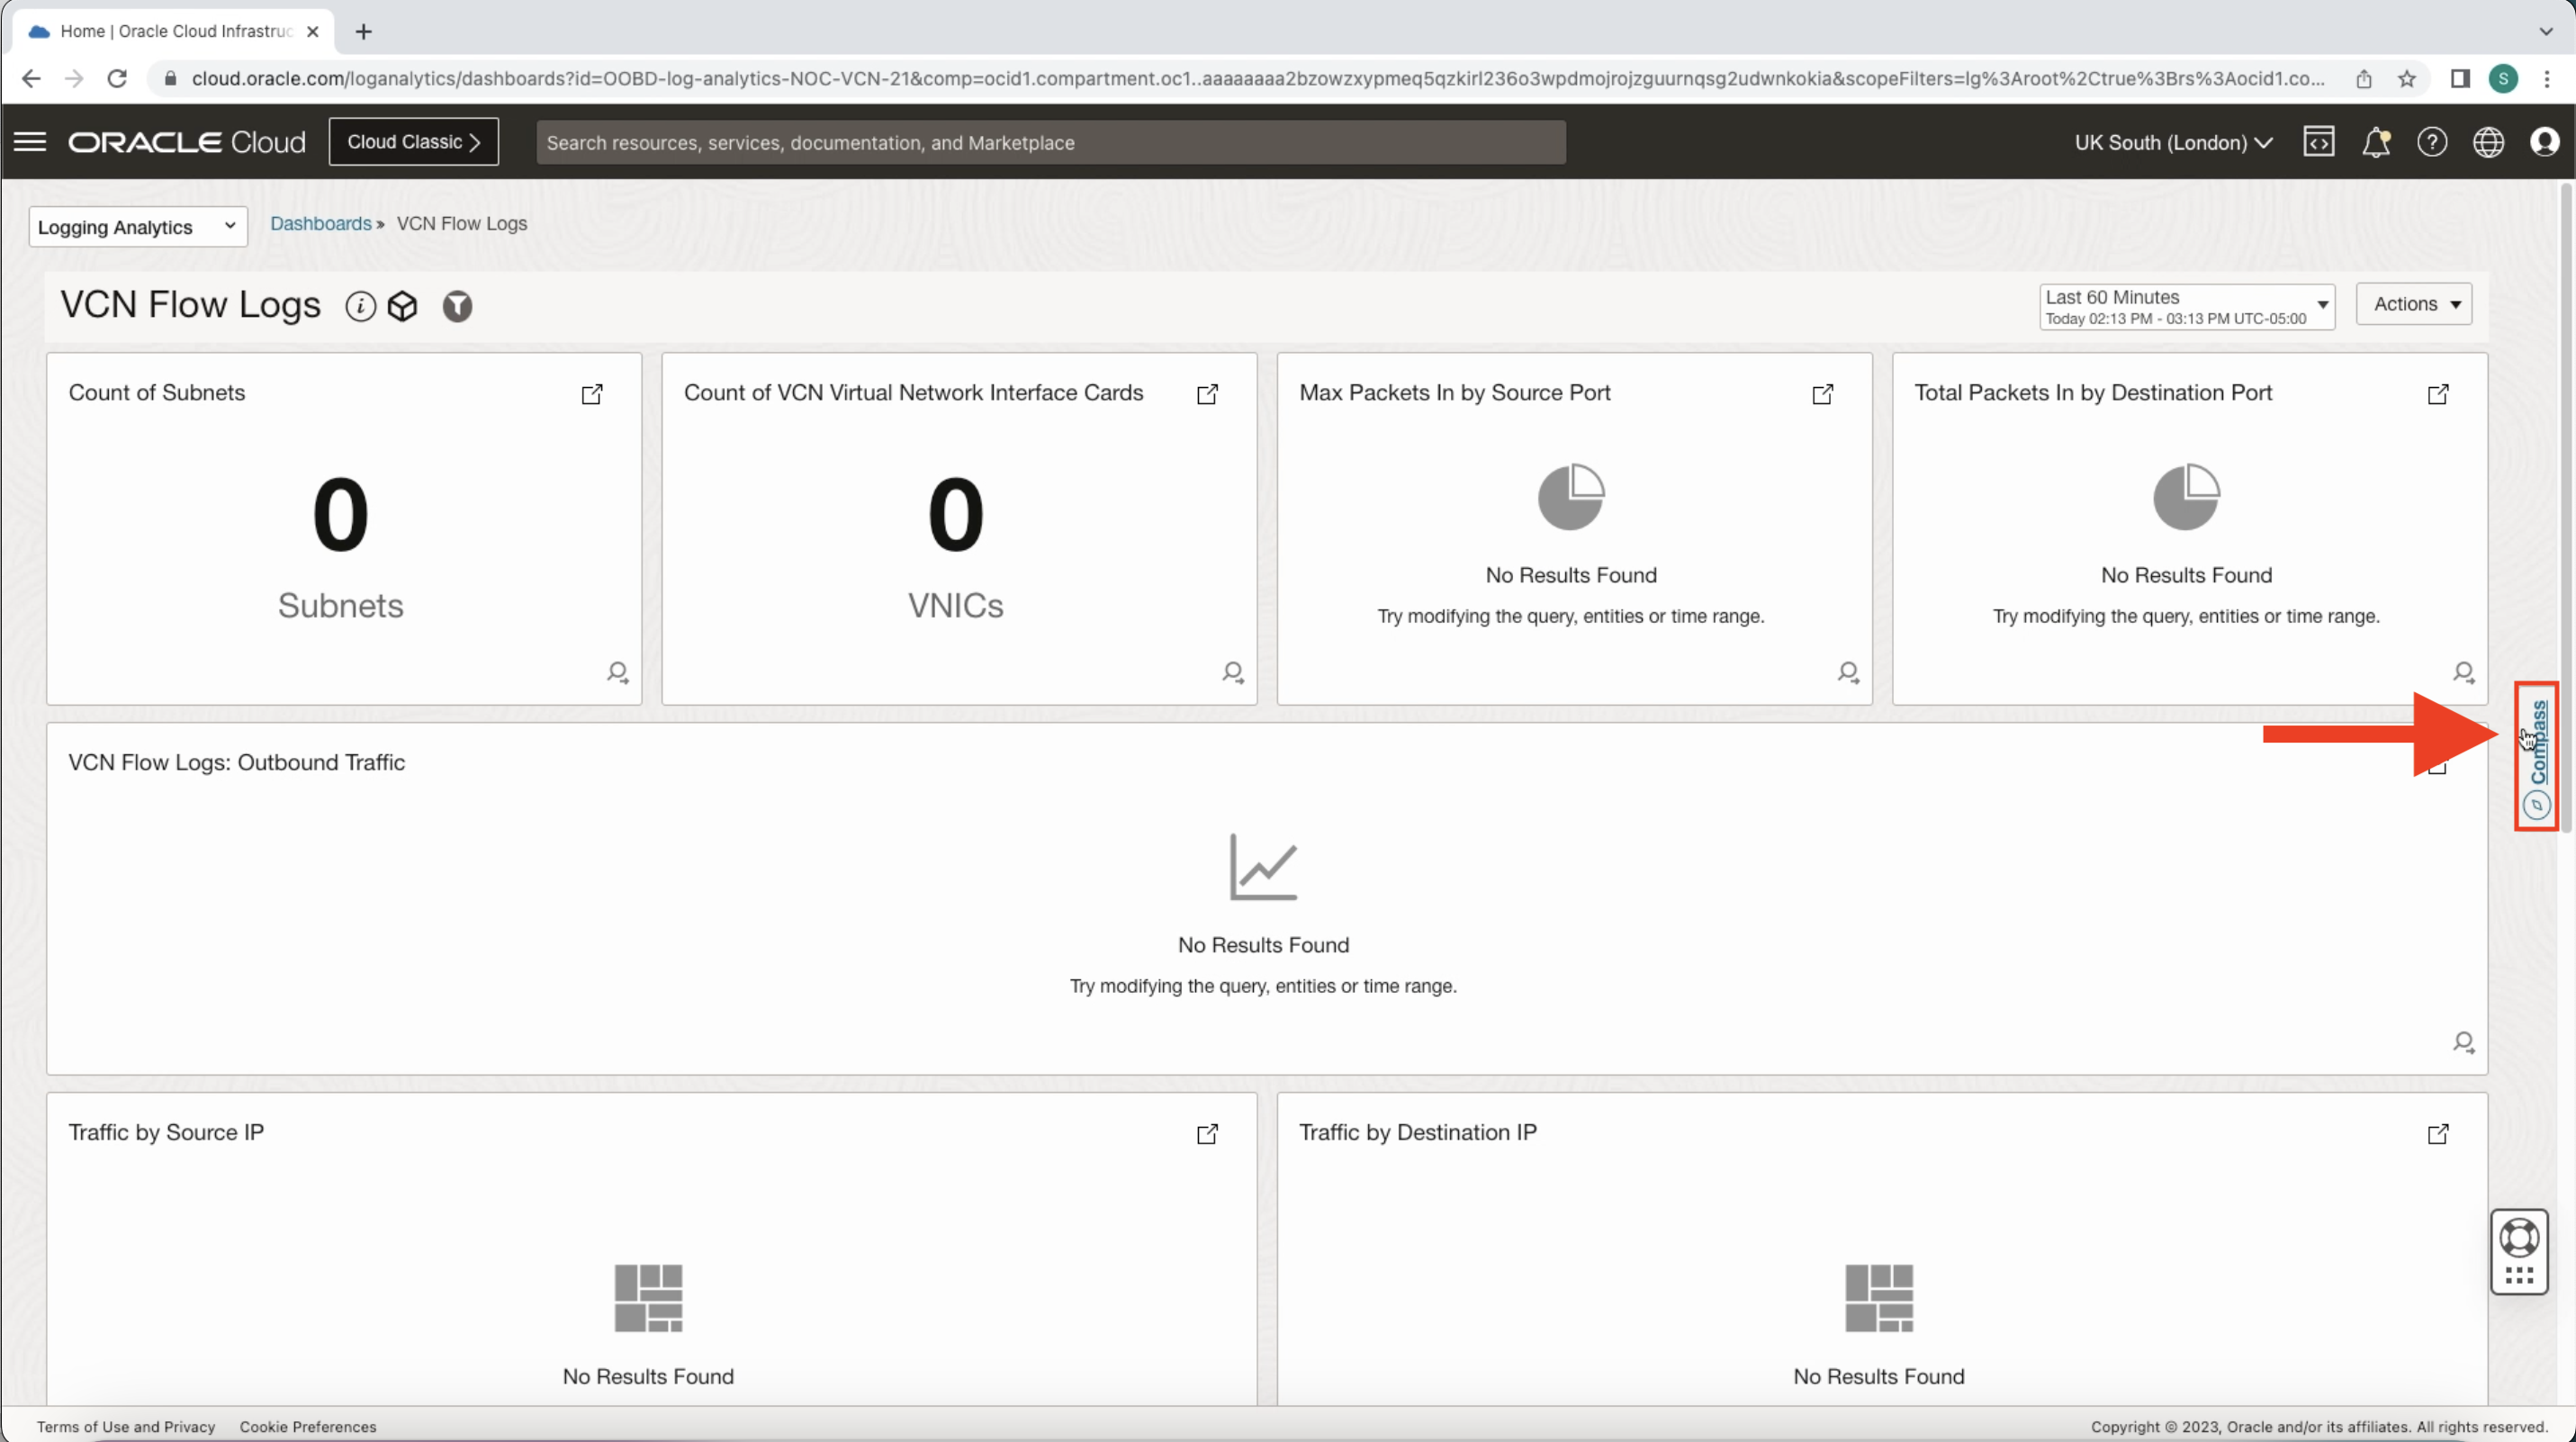
4. Select the top left drop-down in Log Explorer and select Home. Here you’re presented with Dashboard templates that are used to build and visualize your data resources. Select the VCN Flow Logs dashboard.
5. Let’s set up VCN Flow Log ingestion by selecting the Compass icon to the right of the screen. Then select Add Data.
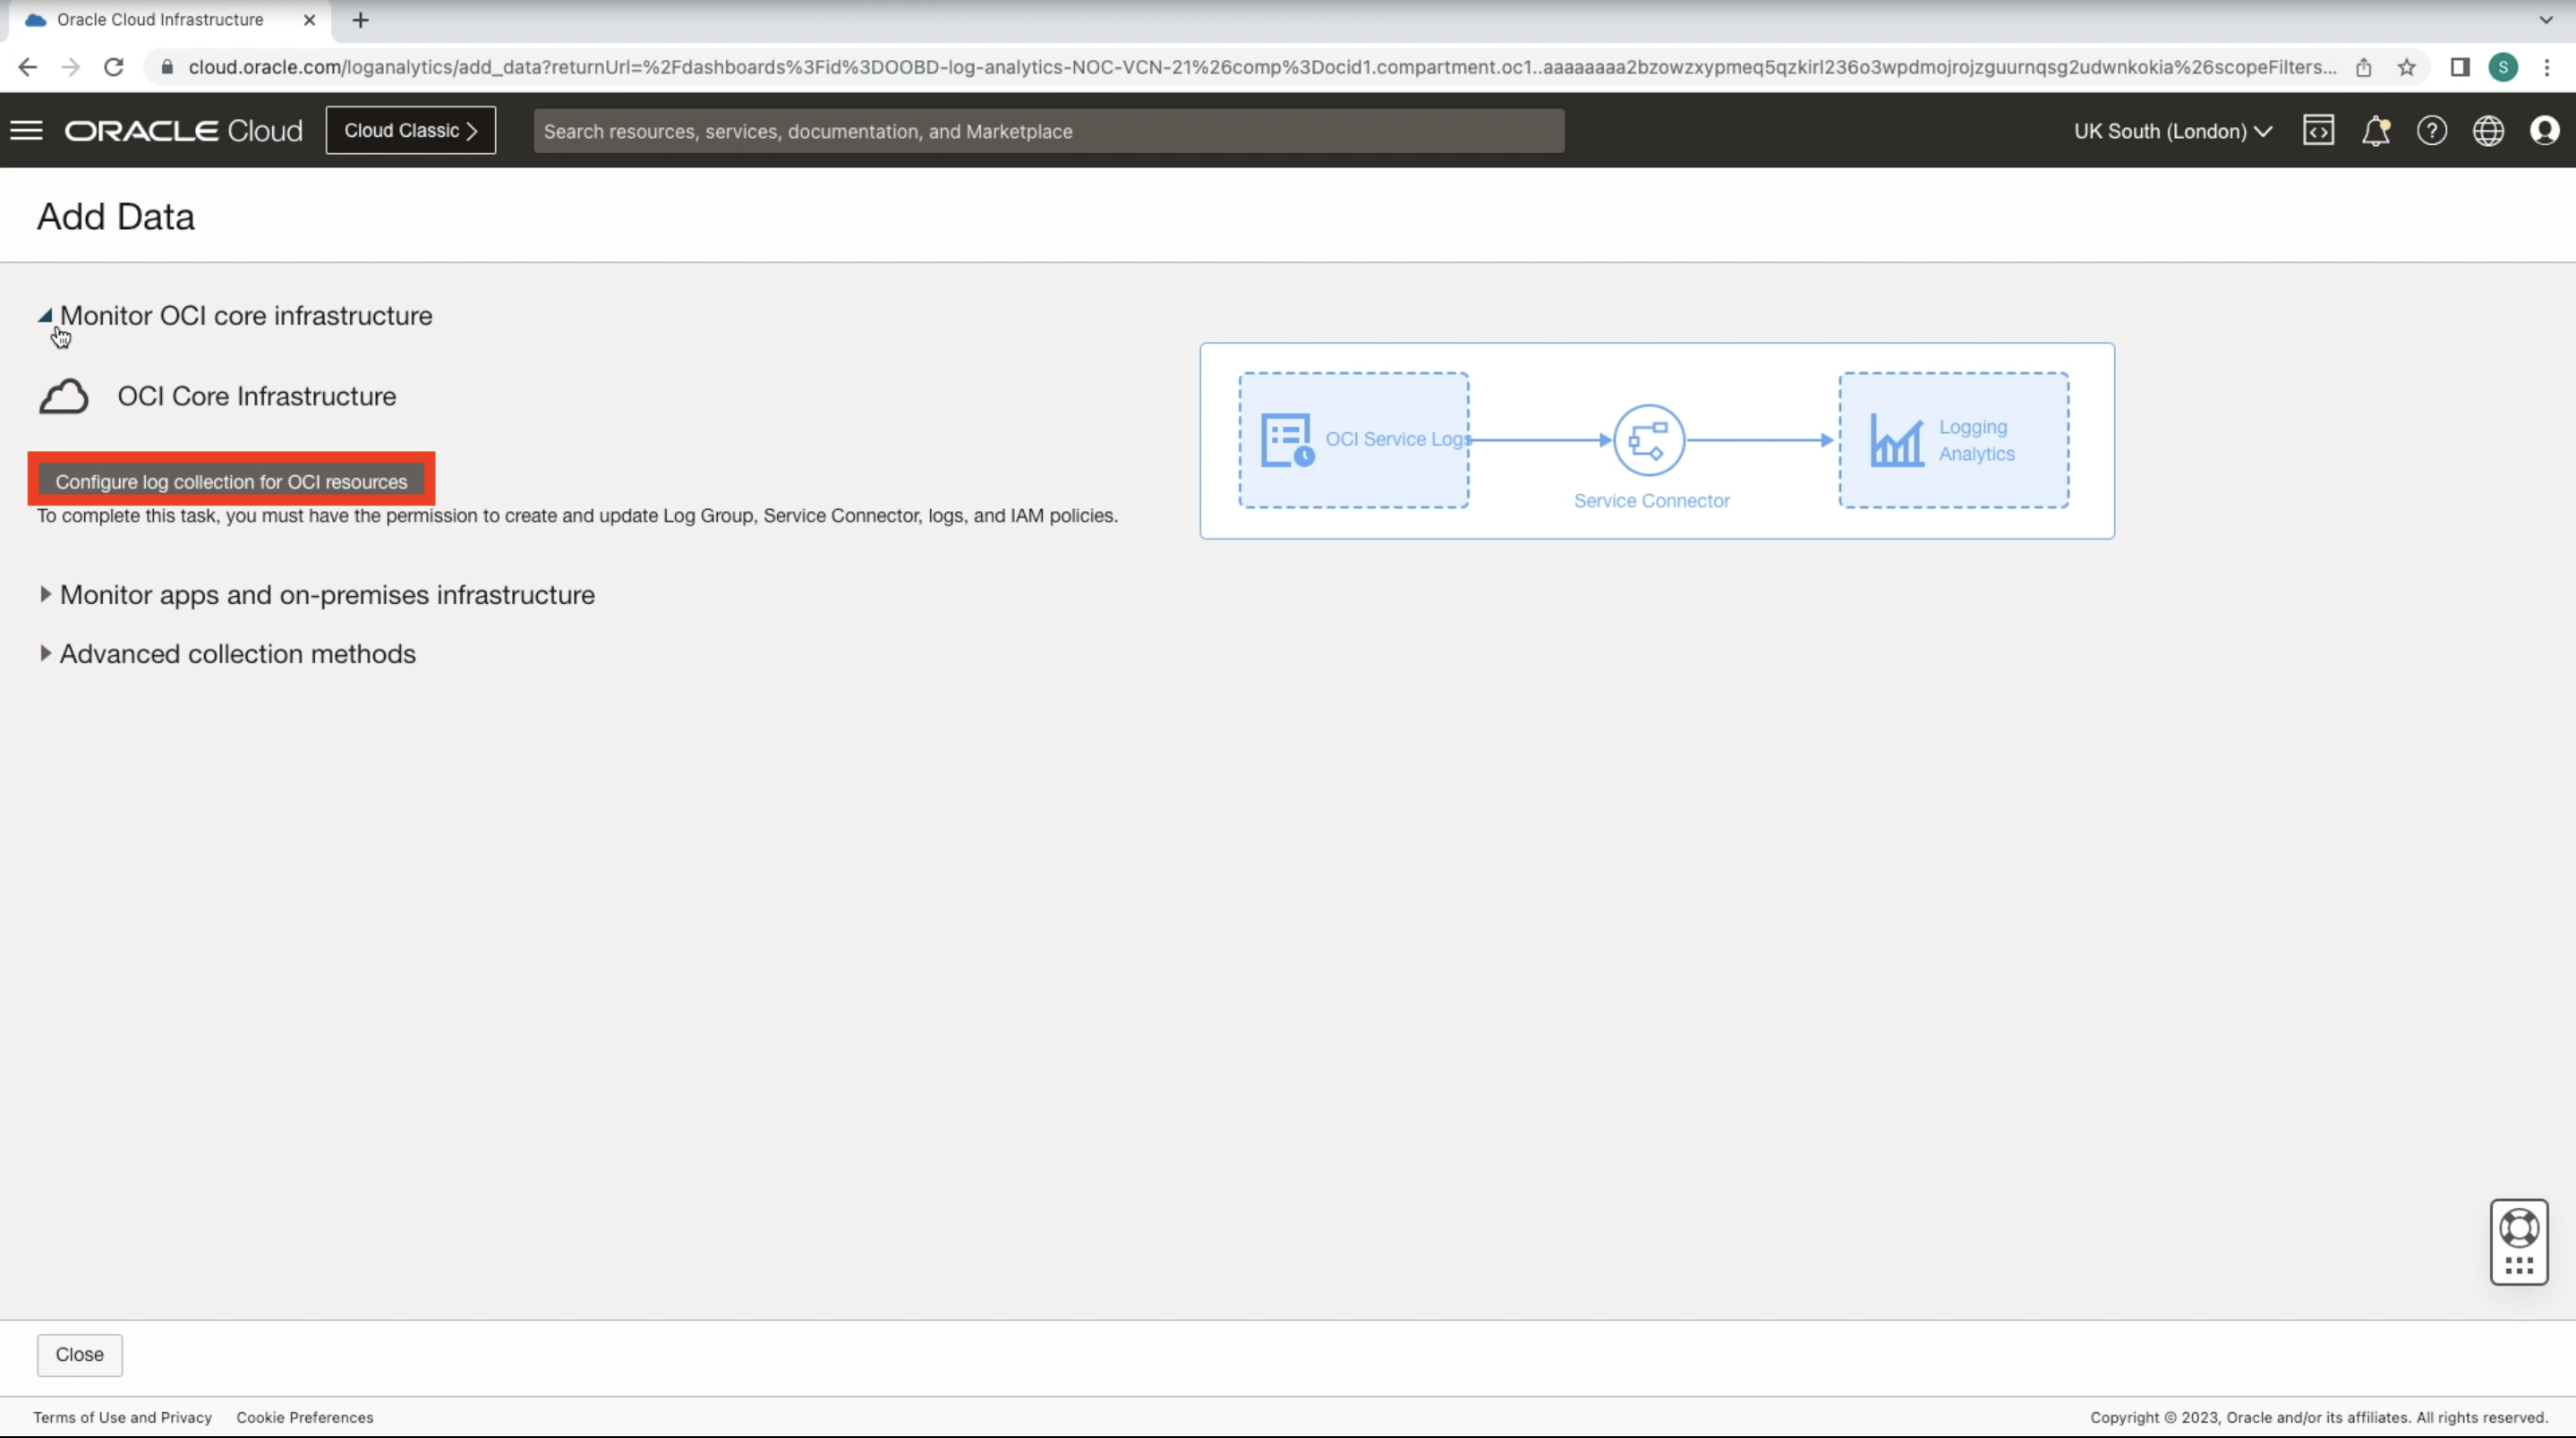
6. This wizard will allow us to quickly configure the VCN Flow Log sources. Select Monitor OCI core infrastructure drop down and click Configure log collection for OCI resources.
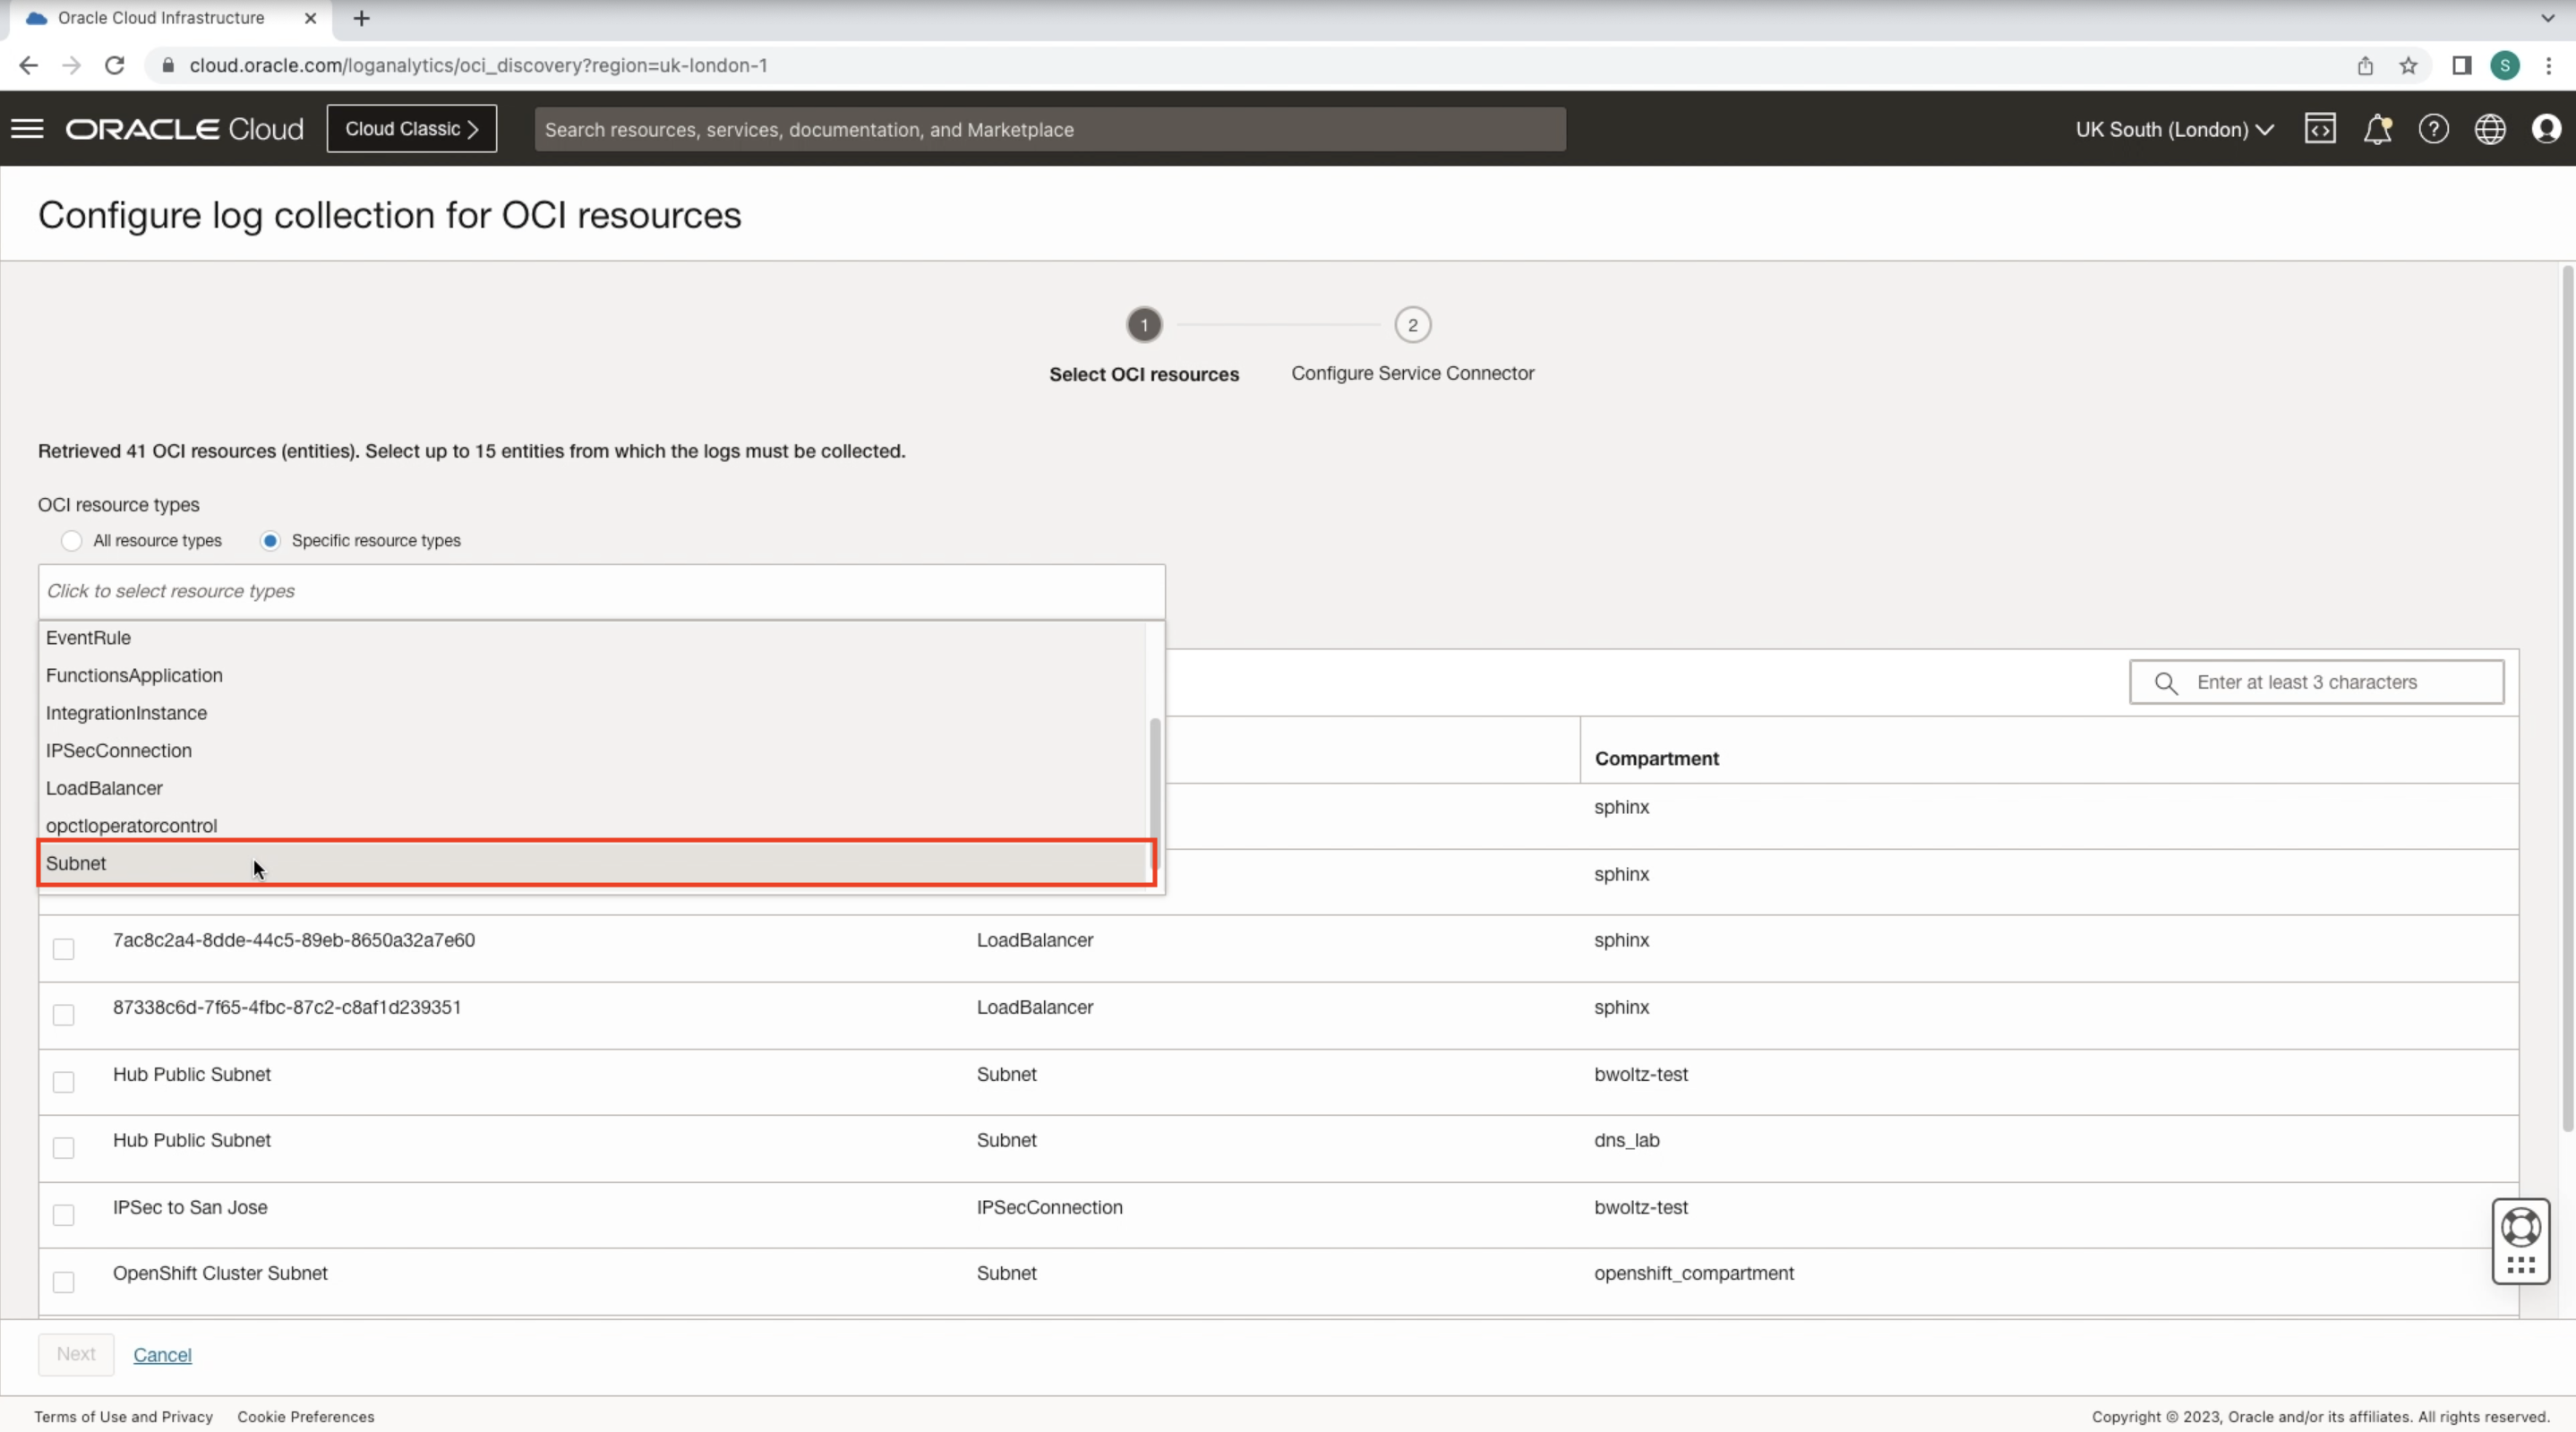
7. Select the Specific resource types dial and pick Subnet. Search and check each subnet needing their Flow Logs ingested into Log Analytics. Click Next.
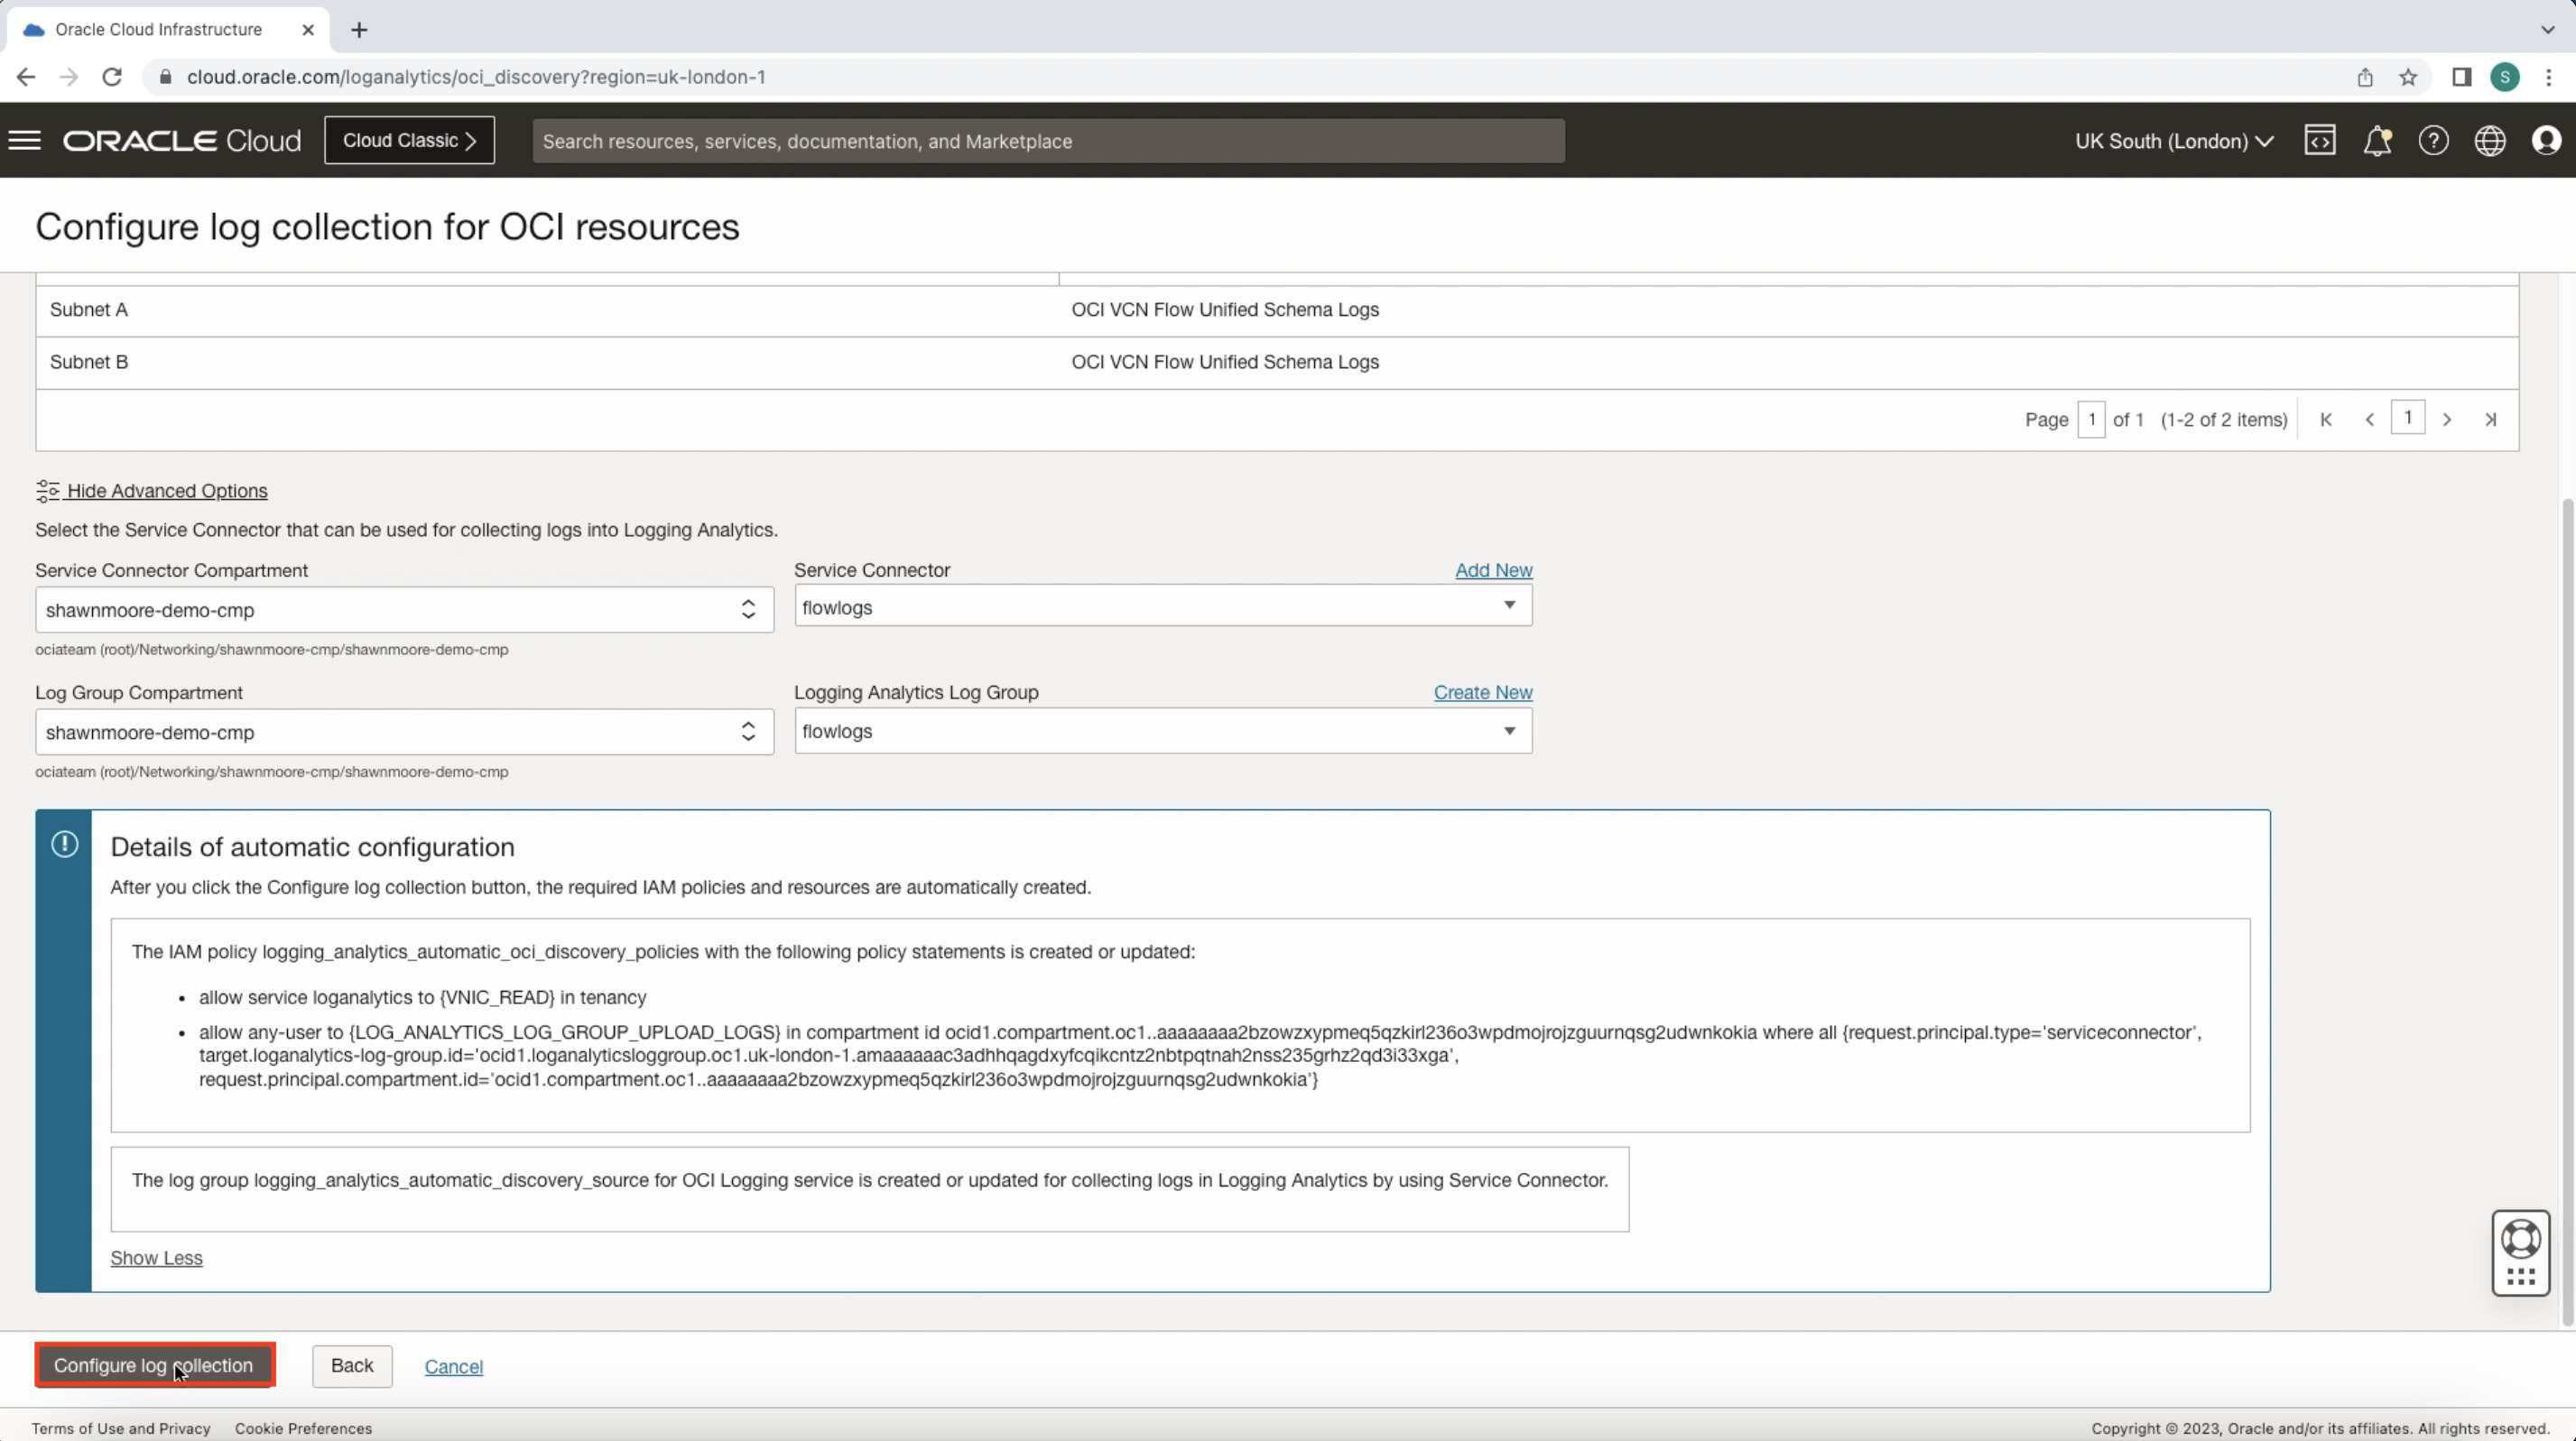
8. This screen allows you to pick the name and Compartment location for the Service Connector and Log Analytics Log Group. This page also provides details of the automatic configuration such as IAM policies. Click Configure log collection once ready. This will provision the entire VCN Flow Log to Log Analytics ingestion for us!
VCN Flow Logs Dashboard Overview
Take another look at the VCN Flow Logs Dashboard, we should now see the subnets we’ve enabled for Log Analytics ingestion. The Dashboard gives us a quick visual representation of IP traffic flows in and out of both subnets.
This includes pie charts showing all packets sent and received broken down by TCP/UDP ports; along with a line graph showing outbound traffic sent over a timeline.
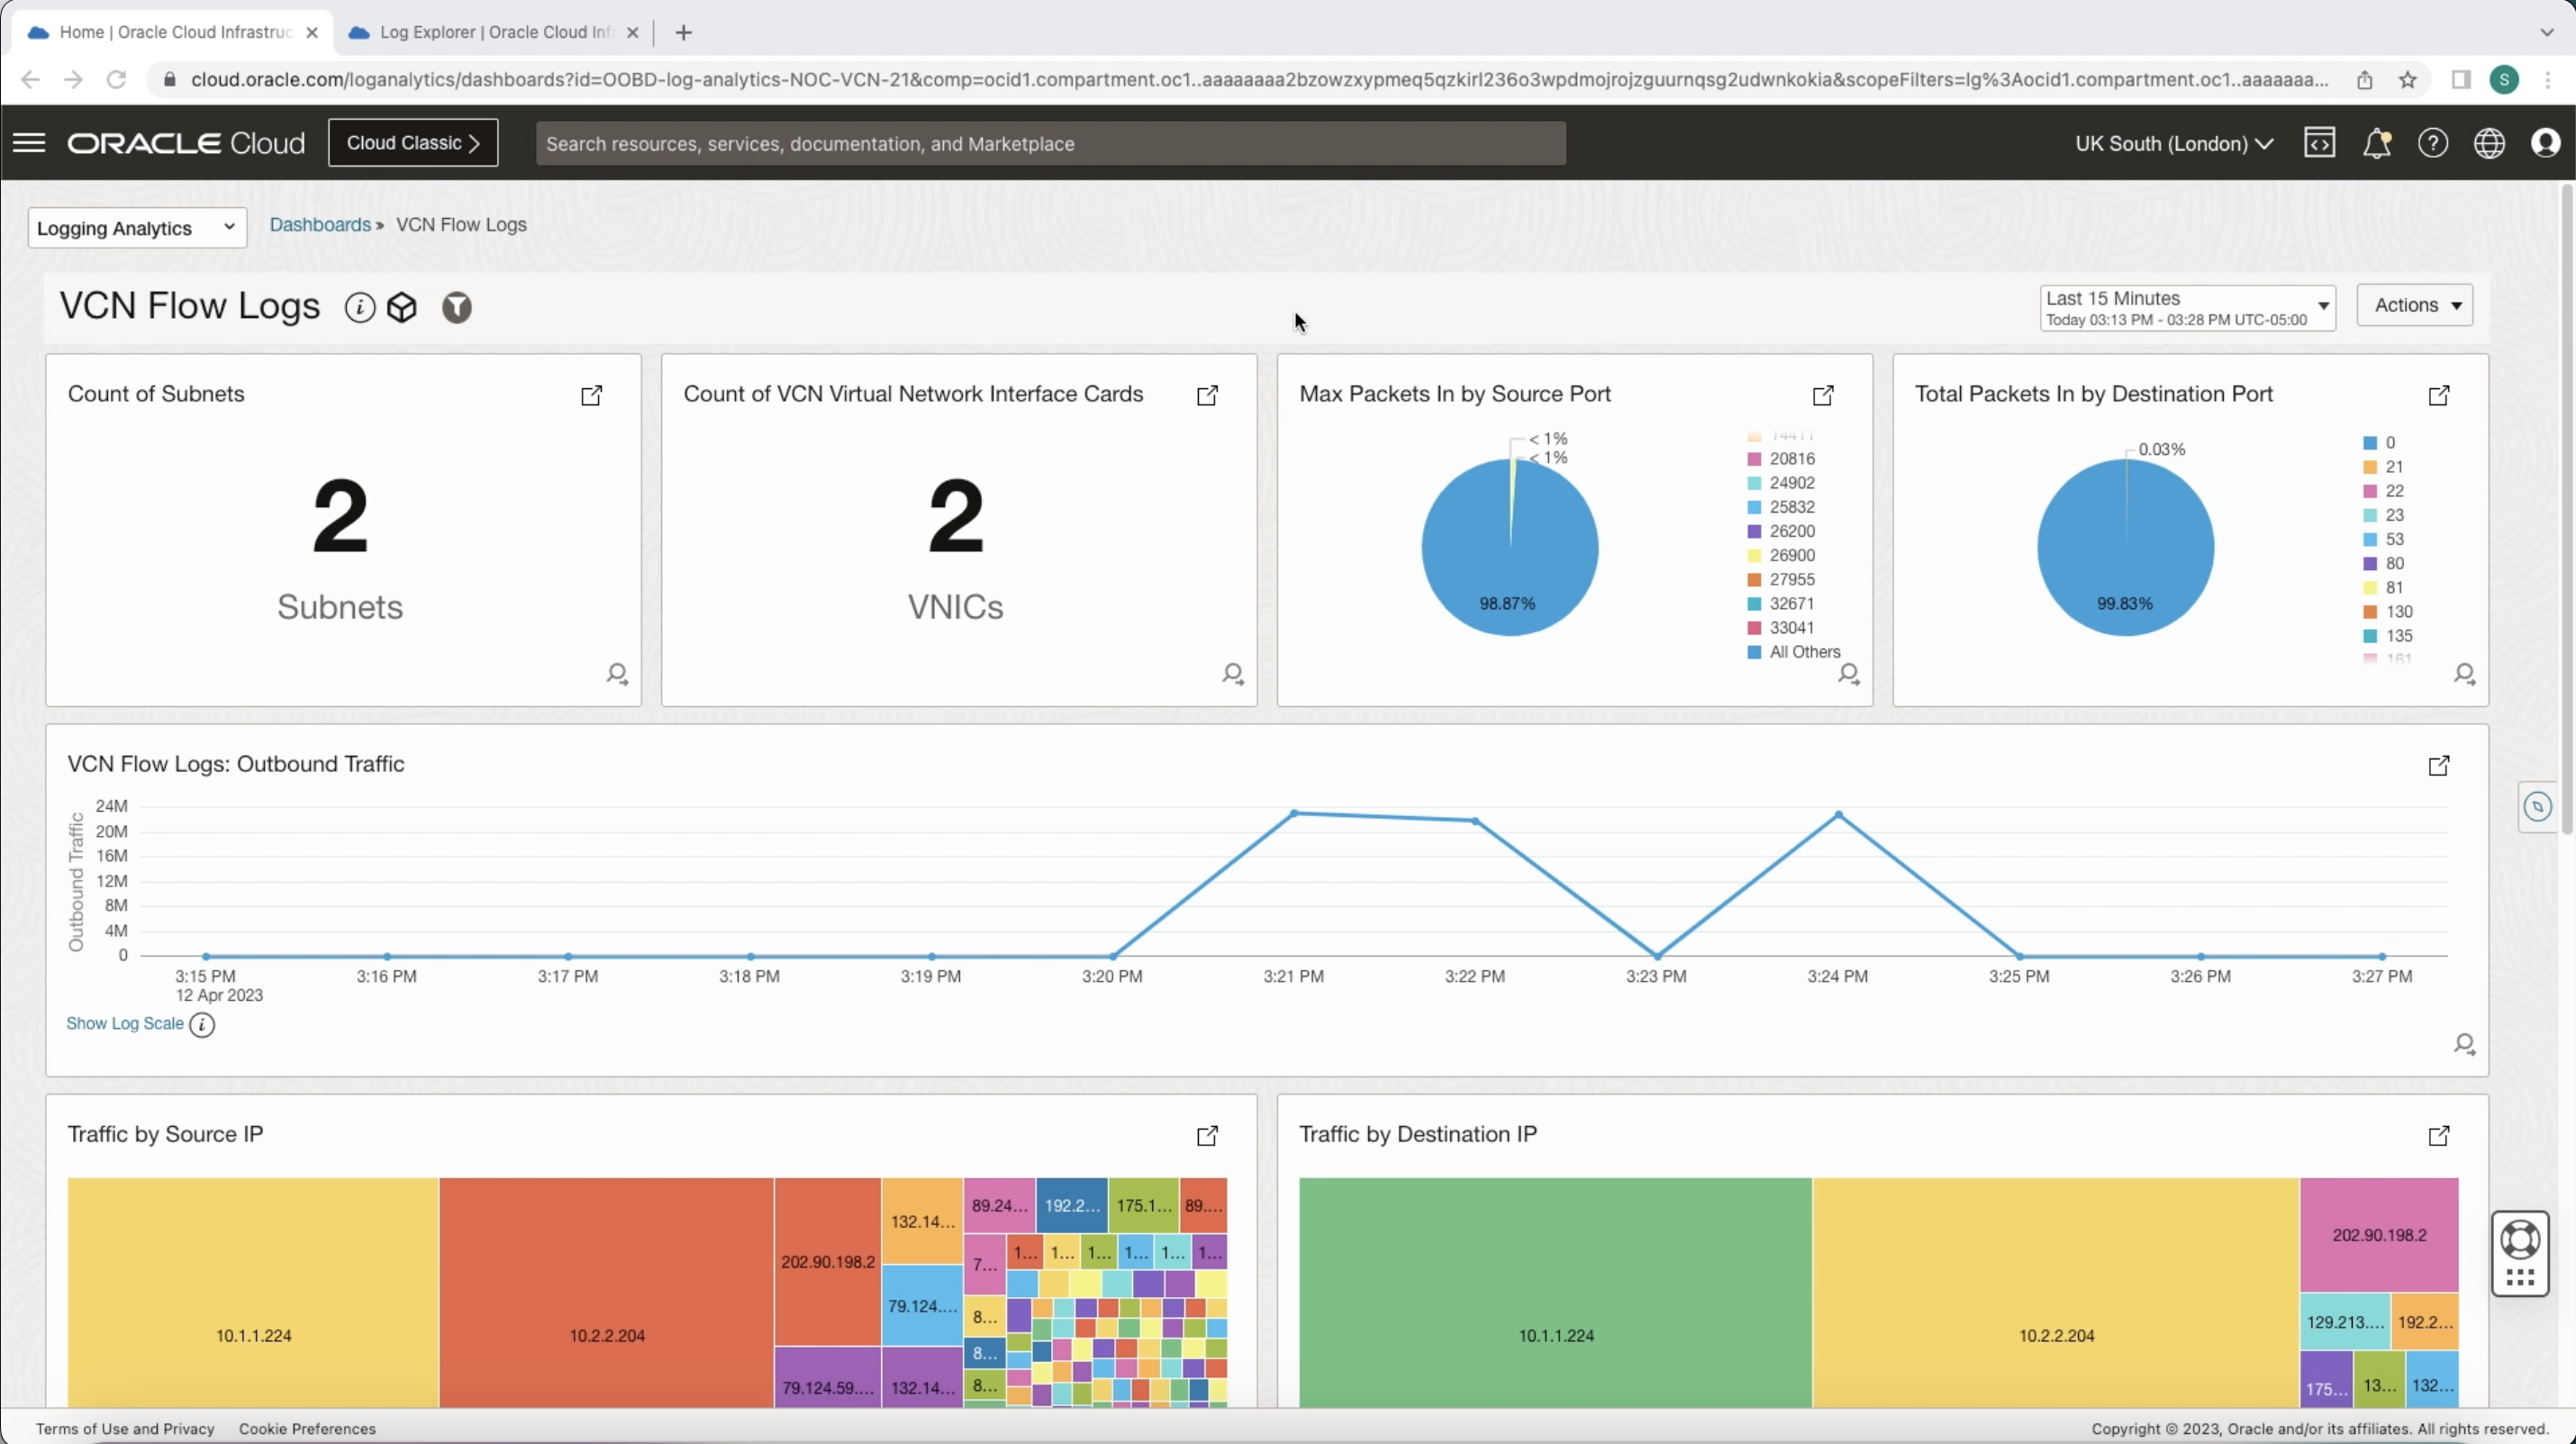
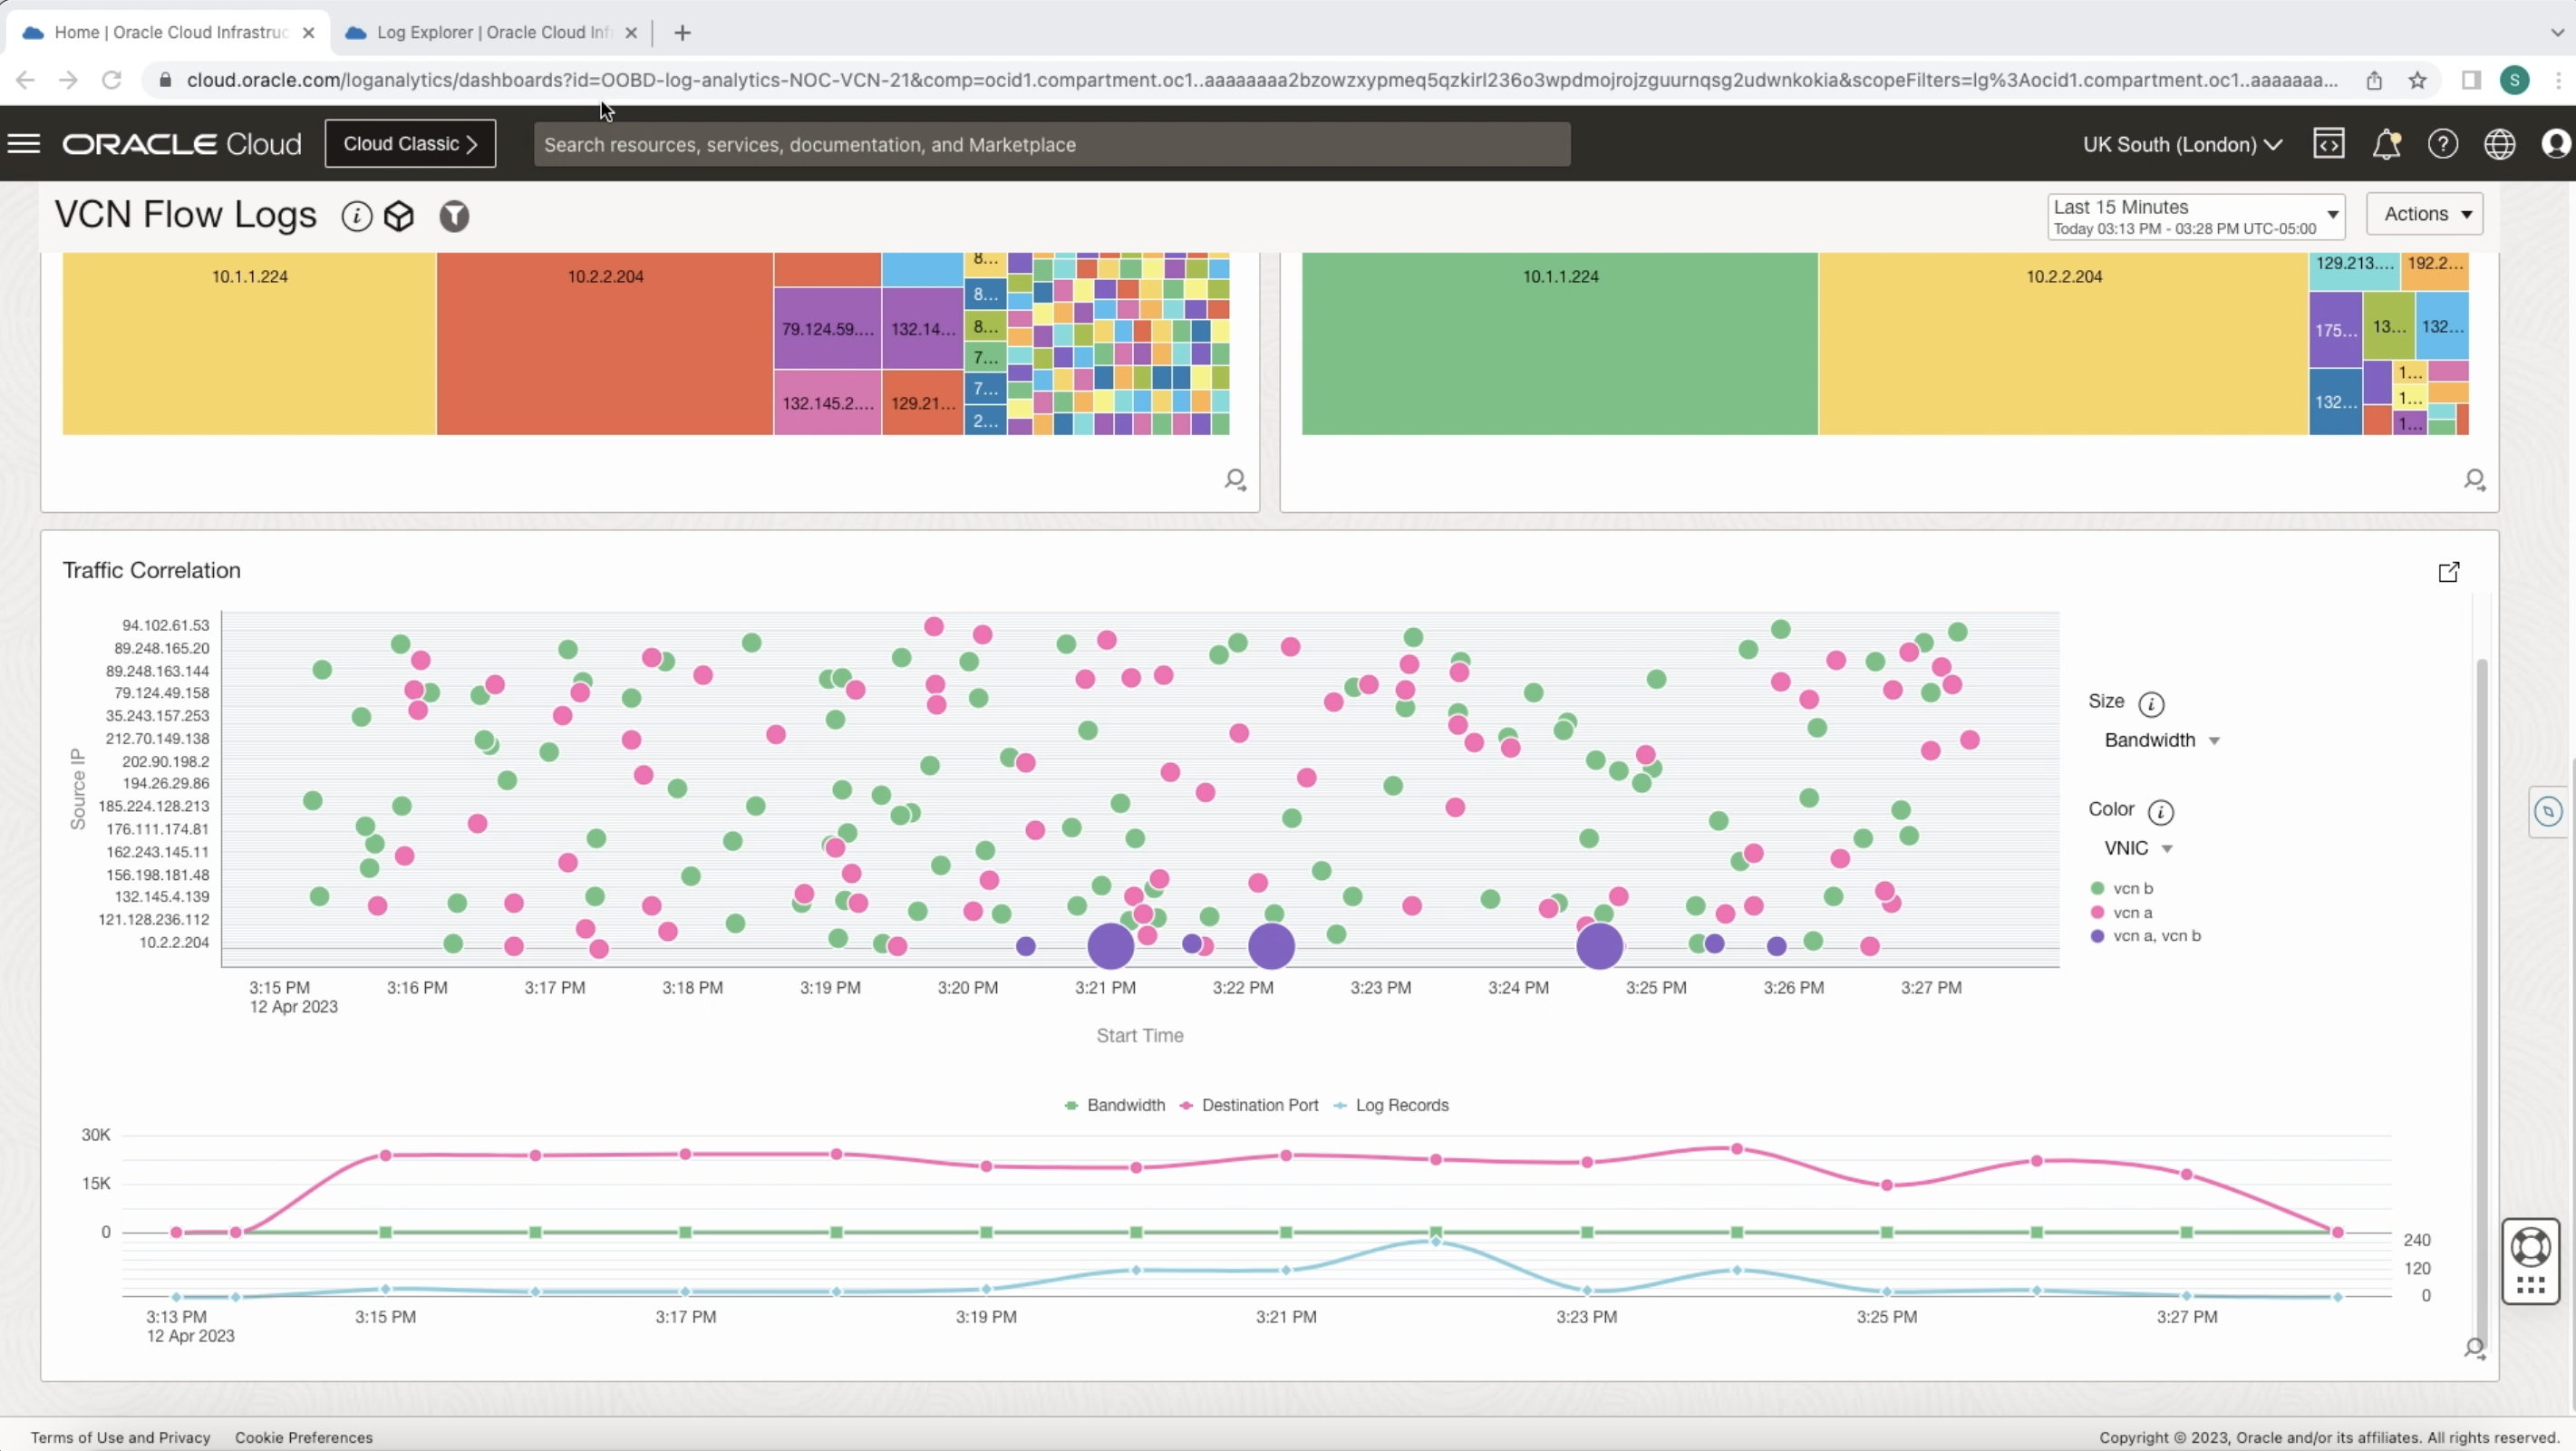
We have other visualization features such as Traffic Correlation which allows you to see common source and destination patterns.
Log Explorer
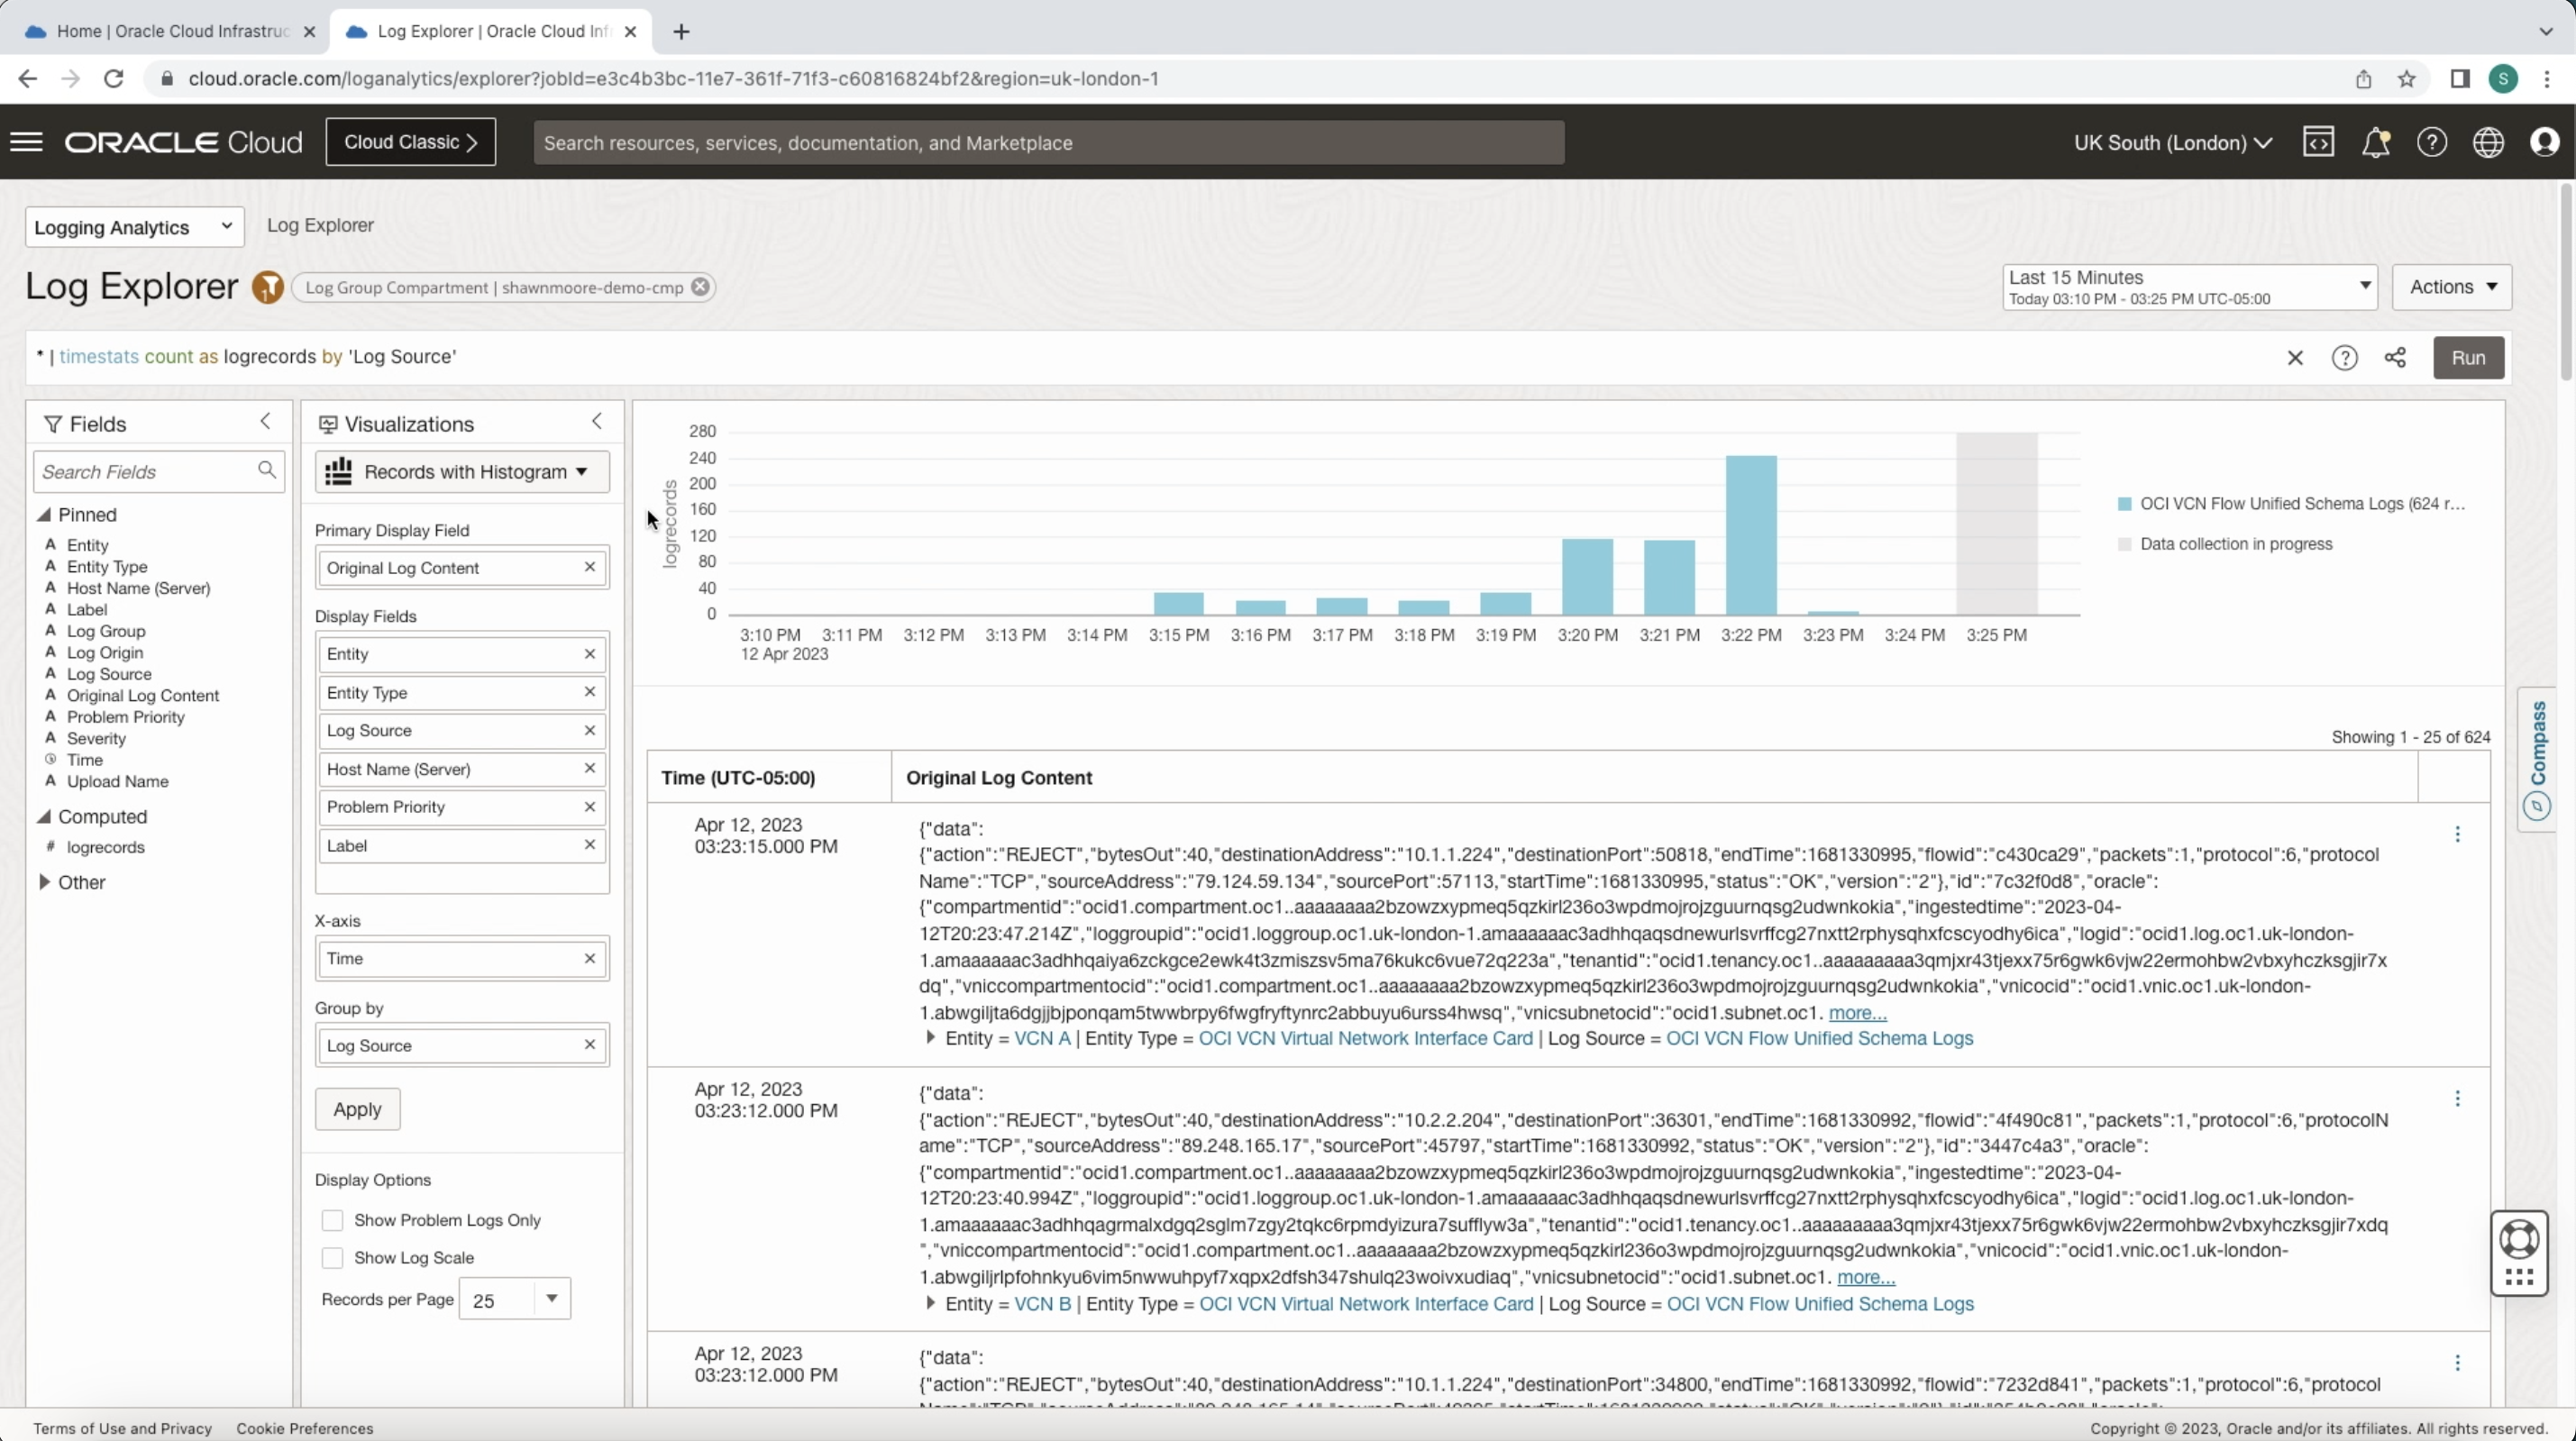
Now take another look at Log Explorer, the interactive data visualizations in Log Analytics enable you to get deeper insights into your log data. Depending on the data you want to filter, group, and compare, you can choose various visualization types, from a rich set of options.
Here we can parse through our VCN Flow Logs and use Visualizations to dive deeper into log data insights. For example, we’re able to view VCN Flow log records in detail and filter based on a rich set of options.
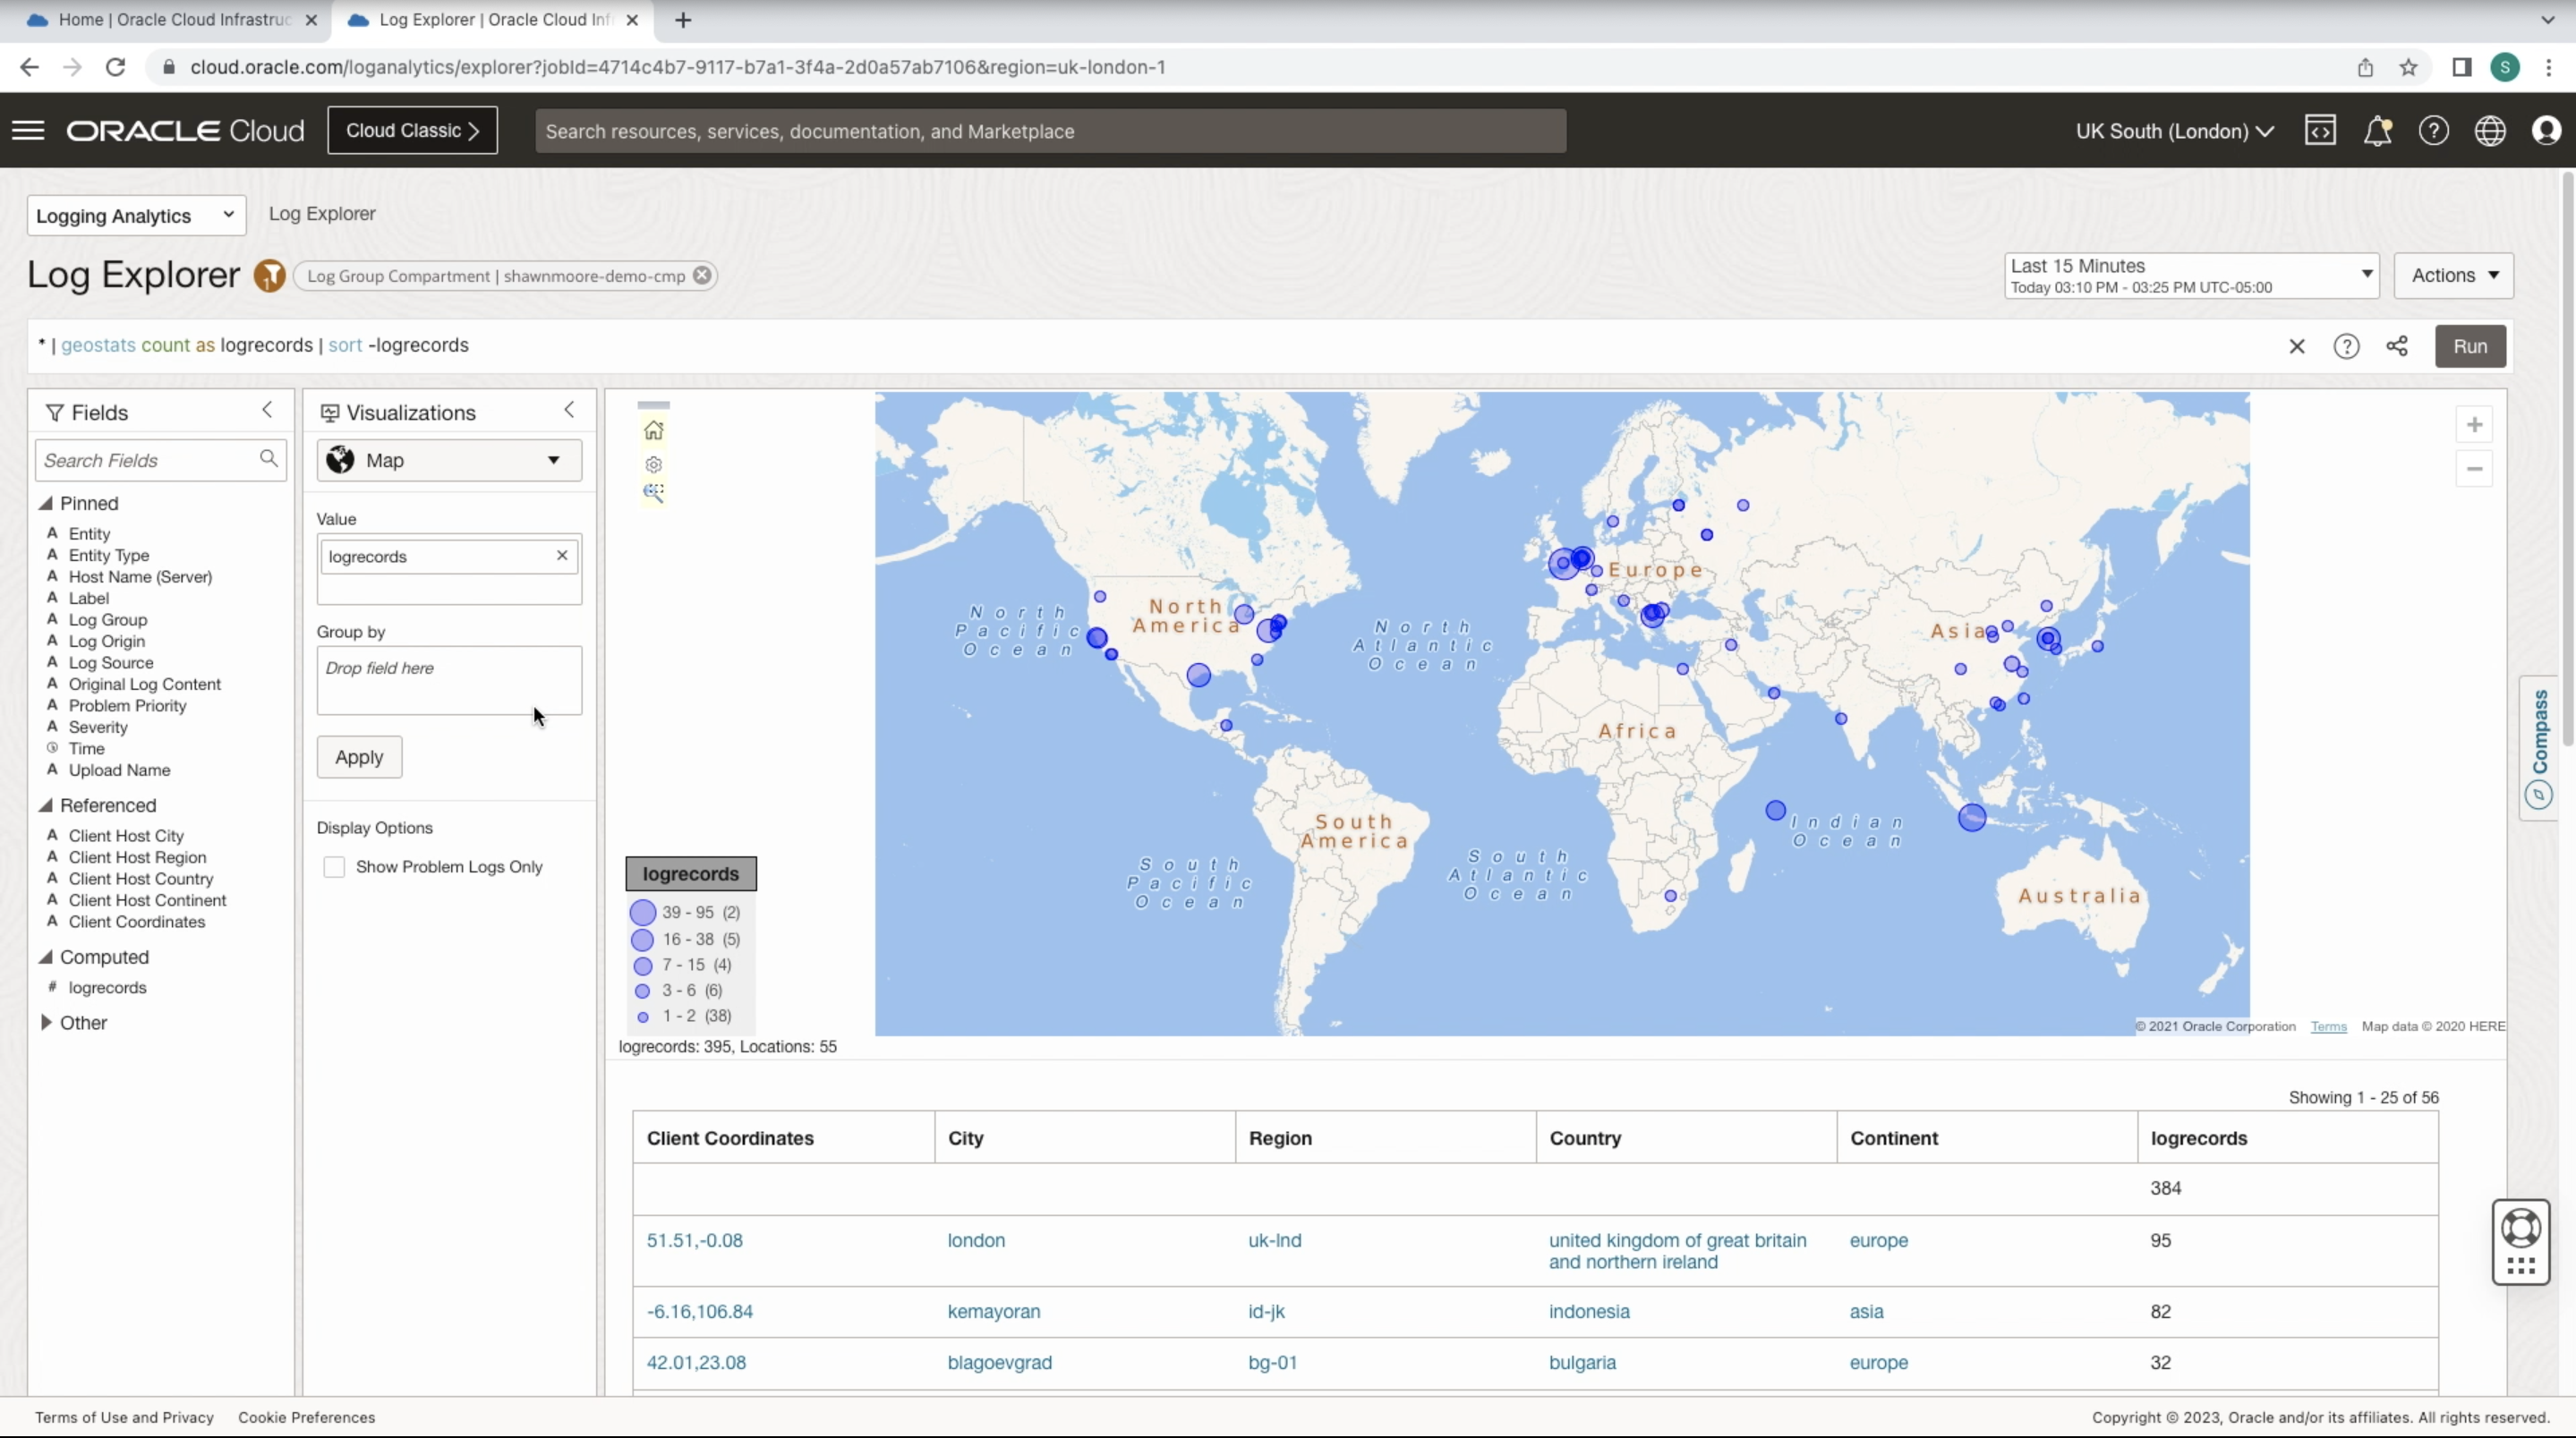
Also, we can view different visualizations of our flow logs, such as a map view of where our source traffic is coming from globally.
Conclusion
Ingesting VCN Flow Logs into OCI Log Analytics is the tip of the iceberg on what’s possible. For further ideas, check the OCI Architecture Center.
Don’t forget to view the companion video for this blog, which shows the VCN Flow Logs to Log Analytics setup process: