Introduction
In the context of a cloud native world (microservices/containers/container orchestration etc.) security, tracing, observability and monitoring are super important and can pause a challenge. The traditional way of doing tracing monitoring and observability invariably involves instrumenting the monitored applications or running agents that do not provide us with the full stack visibility we desire.
Enter eBPF. eBPF provides excellent visibility and enforcement control of policies and lets operators observe all programs running in the user space. Moreover, eBPF incurs low overhead, making it ideal for containers in production. It provides a “drop in”, passive modality for tracing and observability without out the need to instrument our code base. With eBPF it is much more easier to develop monitoring, observability and security solutions.
eBPF runs programs in the OS kernel space without having to change the kernels source code or compile additional modules; and without touching the monstered/observed application. This is all the more desirable with the advent of Container optimized OSes which adopt an immutable container approach with minimal footprint to enhance operation security in a cloud native microservice based ecosystem. This presents us with the conundrum of how to extract deep data for monitoring and securing these platforms? eBPF does this natively and safely without the need for a kernel module or any instrumentation in in the application codebase.
eBPF is an exciting technology that has reached technical maturity. It has a very rich tool ecosystem built around it, with very interesting application usecases for security, monitoring, observability and policy enforcement in cloud native systems.
This blog is a high level teaser that gives you an overview of the technology in the context of a slightly “contrived”, but practical, usecase that showcases how to architect an eBPF program/solution that monitors file name changes on an OS. We will take this example through multiple gestations, from a simple implementation on Oracle Linux, through to showcasing how to dockerize it, deploy it on kubernetes and how to build external integrations that allow us to leverage OCI’s OOB analytics capabilities. This will give us a “feel” for the technology and a glimpse of what can be achieved using it.
I hope you enjoy it!
What is eBPF?
This is the official definition of eBPF: eBPF is a revolutionary technology with origins in the Linux kernel that can run sandboxed programs in an operating system kernel. It is used to safely and efficiently extend the capabilities of the kernel without requiring to change kernel source code or load kernel modules.
eBPF stands for extended Berkley Packet Filtering because it was originally invented to filter packets by attaching probes/programs to the kernel’s network interface in order to efficiently intercept and filter packets.
eBPF provides us with the following benefits:
- Deep observability: Extensive visibility into all parts of the system and applications ranging from detecting low-level microbursts in TCP connections, providing HTTP visibility for monitoring dashboards, or the ability to detect the use of particular vulnerable shared libraries. The possibilities of eBPF are massive.
- Transparent: No application code changes are needed. All observability data is collected transparently from within the kernel. Applications cannot detect when they are being monitored which is ideal for security use cases.
- Low-Overhead: Minimal overhead is imposed on the system. Performing filtering, aggregation, metric accounting, and histogram collection directly in the kernel with eBPF helps to reduce the overhead.
Let’s have a look at how a typical eBPF setup looks like, below.
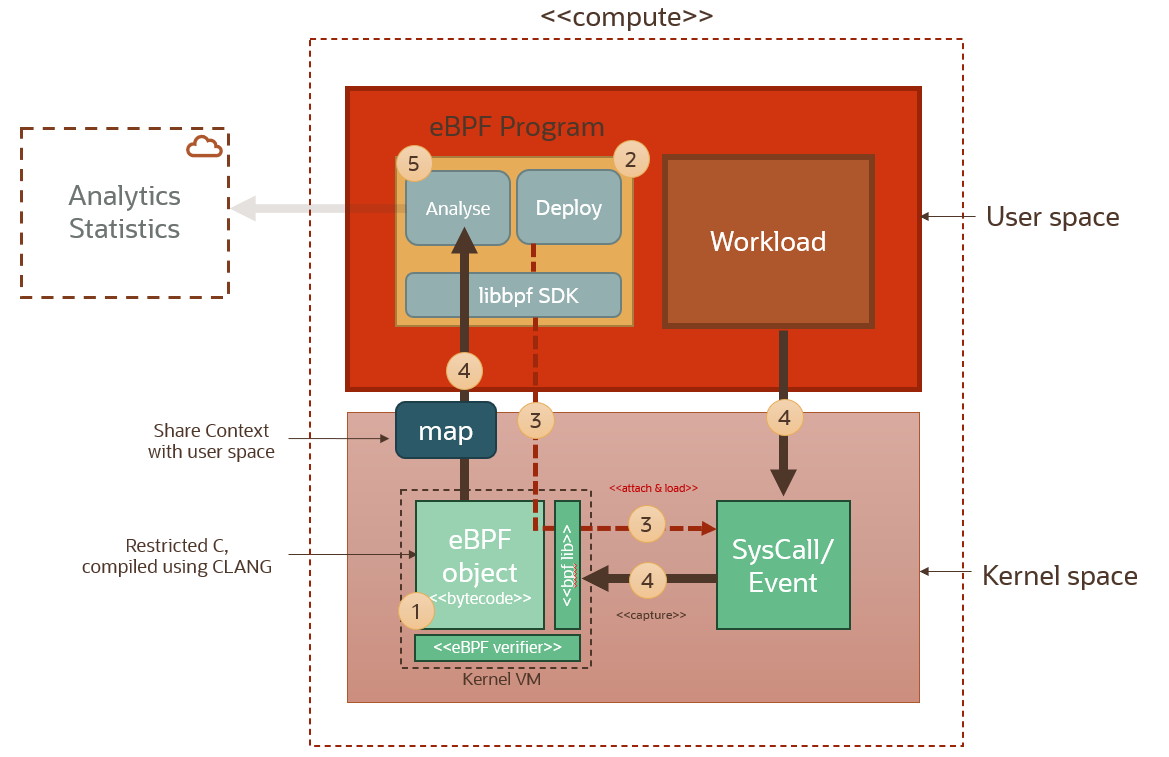
When building an eBPF solution these are the main steps. (The step numbers reference the numbers in the diagram above):
Setup/build a probe (1): Write a probe function that captures the kernel context for the syscall to which it will be attached. This eBPF probe is compiled to BPF bytecode. Then the bytecode is verified to make sure it’s safe when it executes in the BPF VM. These strict verifications guarantee that the machine code will not intentionally or accidentally compromise the Linux kernel and that the BPF probe will execute a bounded number of instructions every time it is triggered. This is to ensure that eBPF probes cannot crash the kernel.
Write an eBPF program (2): The eBPF program running in the user space is responsible for attaching the probe functions to their target syscalls (3). This program needs to call the underlying kernel library libbpf (written in CLANG) in order to initialize eBPF and attach these probes to the syscall hooks. It can use one of several eBPF SDK wrappers available in a number of languages (e.g. GOLANG, Python).
Attach the probe (3): The attached probe will send context and data back to the user space program using a map data structure that can be accessed from the user space.
Start Ingesting (4): Now that eBPF setup is ready and our eBPF program is ready to starting ingesting and processing kernel syscall events. We don’t have to reboot the machine! Or restart the monitored application!
Building our First eBPF Program on Oracle Linux
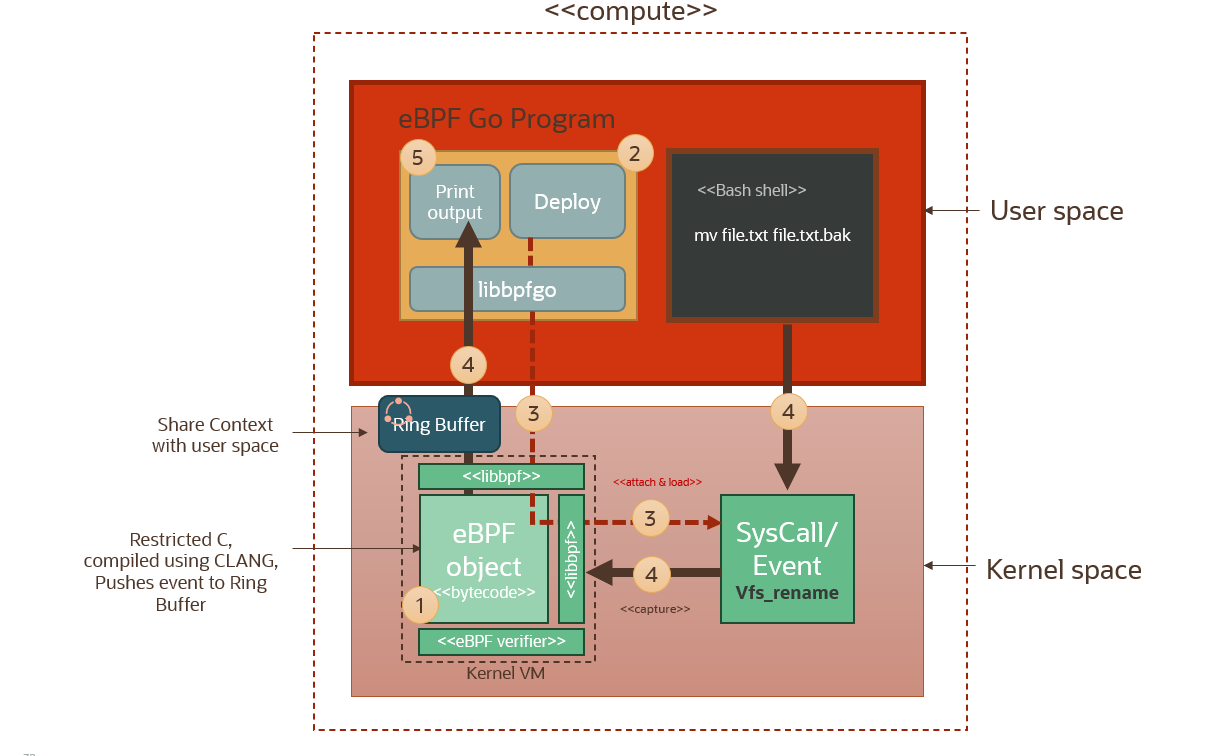
This is the usecase for this setup. Instead of a ‘workload’ we will have a bash shell, running in the user space of course; and we will execute a simple rename file command. The file rename will trigger a syscall and we will capture that syscall event using our eBPF probe (event handler) (step 4 in the diagram above) which will in turn push this through to the eBPF program running in the user space via a map.
There is two main components that we need to develop here. The eBPF event handler (object) which will capture the kernel event and process it and then pipe it to the user space through the buffer; and the eBPF program that is running in the user space. This eBPF program serves a twofold purpose: to load the compiled eBPF probe (event handler) and attach it to the relevant syscall hook; and then to load and extract data from the eBPF map for further processing and analysis. The eBPF program in this usecase is written in GOLANG, and uses a GOLANG wrapper or SDK called libbpfgo that calls out to the underlying kernel libbpf library.
We will implement this usecase using Oracle Linux 8 image. You can check if your kernel has what is called BTF support built-in by looking for the /sys/kernel/btf/vmlinux file. Oracle Linux 8 already comes with BTF enabled out of the box (kernel built with the CONFIG_DEBUG_INFO_BTF=y option), which means it can run eBPF programs and objects. Without going into too much detail, BTF stands for BPF Type Format. Kernels with BTF use an encoding format for BPF VMs that allows us to compile a portable eBPF object/probe once and then use it/attach it everywhere, without having to recompile it every time we redeploy our program on a different Linux system.
Now before we start developing and building our eBPF objects and programs on this machine, we will need an additional development library that supply us with the requisite headers needed that declare the bpf_helper functions that our user space program and eBPF object will need for invoking eBPF functions, like e.g. functions to capture map data, and functions that load eBPF objects and attach objects to kernel sys hooks etc.
These are the development packages needed: libbpef-dev, lebelf-dev, bpftool and gcc-lsmultilib. On Oracle Linux 8 they can be downloaded and installed using the following command: sudo rpm -i install <pkg-name>. The RPM package files need to be downloaded first from this location: OL8/UEKR7 Repository.
With the requisite header files, we can now proceed with building our eBPF event handler (probe). Let’s go through the main highlights of the code for the probe that will run in the kernel, as well as the main eBPF program that will run in the user space and will be responsible for deploying/attaching the probe object and interrogating the data coming back from it via the map buffer.
Below is a snapshot/excerpt from the eBPF probe code:
In lines 6-9, we’re declaring the events map buffer that we will use to send data to the user space program. We declare its type as a RING buffer. Ring buffers are basically fixed length arrays with two pointers: one that represents the head of a queue, and another that represents the tail. The eBPF object pushes bytes (data) to the tail of the queue, and the user space program pulls bytes (data) from the head of the queue in the order they were added. Notice the use of the eBPF SEC macro, which basically designates the events variable as an eBPF map.
In lines 13-14, we are declaring the actual probe function that will attach to a kernel syscall. We’re using the SEC macro again to declaratively designate the types of probes we’re implementing. Here we’re declaring the function as a kprobe and we’re attaching it to the vfs_rename syscall. That is the Kernel syscall that gets triggered whenever a file name change occurs.
Notice that we’re using kprobes in this usecase. kprobes are the “event handlers” that attach to kernel syscalls and events via eBPF hooks. This is as opposed to uprobes which are event handlers that can attach to shared libraries and application tracepoints running in the user space. uprobes can be very powerful in monitoring data transfer in applications, and can be surgically attached to SSL libraries for example to monitor unencrypted data in applications before it’s encrypted and exfiltrated… but that’s another story for another blog!
But back to kprobes. There are some 300+ different system calls in the Linux kernel. Applications/workloads running in the user space interact with the kernel using syscalls. e.g. if an application wants to do something like access a file, communicate using a network or even find the time of day, it will have to ask the kernel do it on the application behalf via a syscall; hence by attaching these probes to syscalls we’re able to judiciously monitor what applications are doing in the user space. A list of all kernel syscall identifiers for a kernel can be found in this file: /proc/kallsyms. Here is an excerpt:
In lines 18-21 we’re extracting the uid and pid of the workload process that is triggering the syscall. In line 24 we reserve space on the ring buffer, using the size of the proc_info custom structure that we will use to package the information that we will send back to the user space. In line 33 we get the name of the process using the bpf_get_current_comm function; and finally populate the process_info structure with the uid, pid, and pname information before submitting the process_info into the buffer.
At this point we have the eBPF probe deployed and attached to a syscall in the kernel; but nothing is consuming the data it is capturing.
So let’s move on to the user space program, and see how we can pull and process this information from the RING buffer.
The user space program above is written in GOLANG. It is responsible for deploying and attaching the compiled probe function, and also reading tracing/event data that is flowing back from the probe via the Ring buffer we talked about above. The program uses the libbpfgo library which is and SDK that wraps around the underlying libbpf libraries written in C.
In line 3, we’re importing a pseudo package called “C” that allows us to interface with C libraries, which is required in order to be able to load the compiles probe object file and attach it to Linux syscalls. In lines 14-19 we declare a custom data structure that represents the data we want to capture from from syscall events. we will be capturing the process id that is triggering the syscall event, the userid of the process, the process name, and a custom message that will identity the captured event. In line 23 you will see how we load the compiled probe object. In line 29 you see how we’re extracting the probe function. We’re using the same function name that we declared in the probe function discussed previously, viz kprobe__vfs_rename. In line 34 we attach the probe function to the syscall using the syscall identifier. We’re attaching our probe to the vfs_rename syscall in order to capture file rename events in our system. In lines 39-43 we’re basically instantiating/initializing the ring buffer that is going to send data coming from the probe back to the user space. In lines 50-64, we’re reading and printing out events as and when they’re pushed into the ring buffer from the probe.
Now, once the probe and the main program are compiled and linked (see Makefile in the Github repo linked below) we are now ready to test. We will need to execute the main program as root for this to work. In order to be able to attach probes to kernel syscalls we have to be root. There is no escaping this requirement! Executing the main program as sudo in one terminal whilst executing filename changes in another terminal we see the output below… Which is cool! We’re now monitoring filename changes on our OS! You could see that my user has mv‘ed (renamed) a couple of files, and also that the system-journal daemon is renaming and rotating files. Nice result!
Running our eBPF Program in Docker
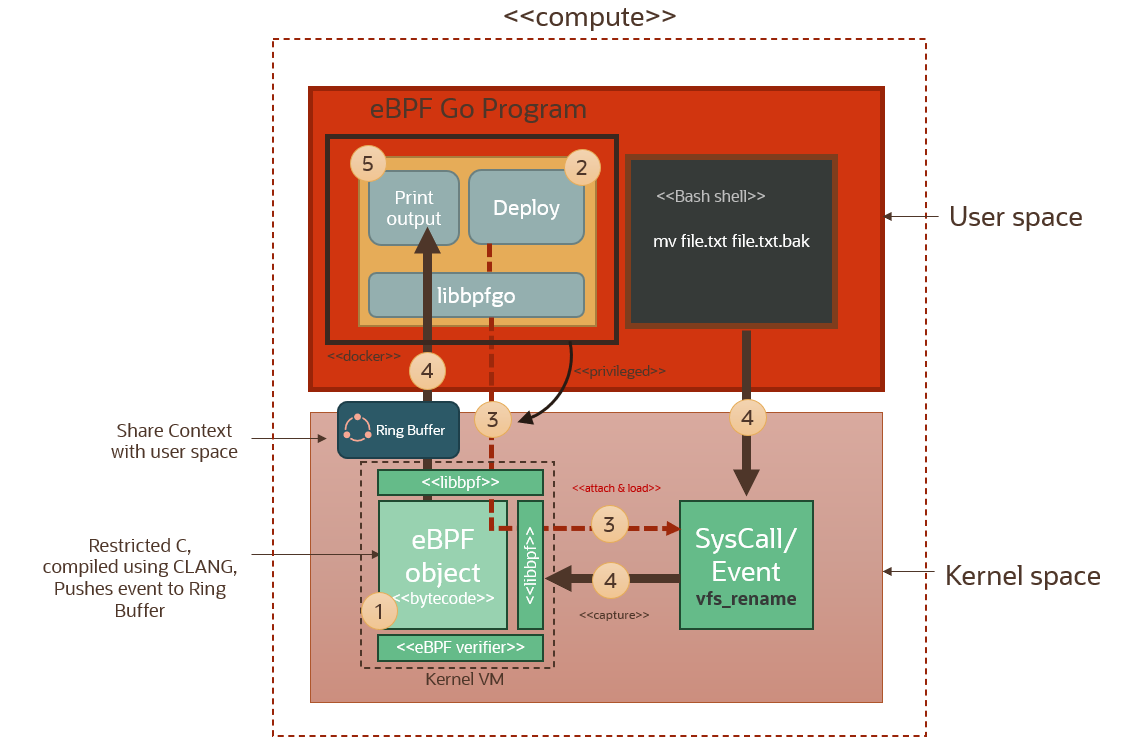
Here we redeploying the same setup discussed in the previous section, but using a docker container instead to compile the eBPF object and run the eBPF program in the user space.
We build the image using the docker file below.
The docker file above is installs all the required BPF development libraries, installs the GOLANG runtime, copies our codebase into the /app folder and then runs the Makefile which compiles the eBPF probe and the GOLANG eBPF program.
When a docker image is deployed it is sharing the host kernel and filesystem. Isolation is performed using user namespace isolation, cgroups (for resource allocation), process namespace isolation etc. Processes running inside the container run as root in the created container user namespace, but this is a virtual root (allowing the an unprivileged user to effectively behave as root only WITHIN the containerized process). This local root user is mapped to my user id (uid=1000) in the host user namespace. Any process running inside the docker container will effectively run as root in the container user namespace, but will show as running under user uid=1000 in the host process space. And therefore the process running in the container will have a restricted set of sys capabilities. In order to successfully run the eBPF program inside our container, it will need to take on the root identity on the host. The only way we can do this by using the --privileged switch when running our container. The --privileged switch gives all capabilities to the container and allows it to do almost everything that the host can do, also run processes as host root.
Let’s run this container and have a look. We’re running it in interactive mode. We launch the eBPF program inside the container. Notice that when we run ls inside the container shell, we see the probe.bpf.o file. This is the CLANG object file for the probe. The eBPF program will load this object and will be able to attach it to the host kernel since it’s running as host root because of the --privileged switch.
We can see here the eBPF program pulling events from the ring buffer which is connected to the deployed kernel probe that is pulling events from the kernel vfs_rename syscall. Another nice result!
Deploying to Kubernetes (OKE)
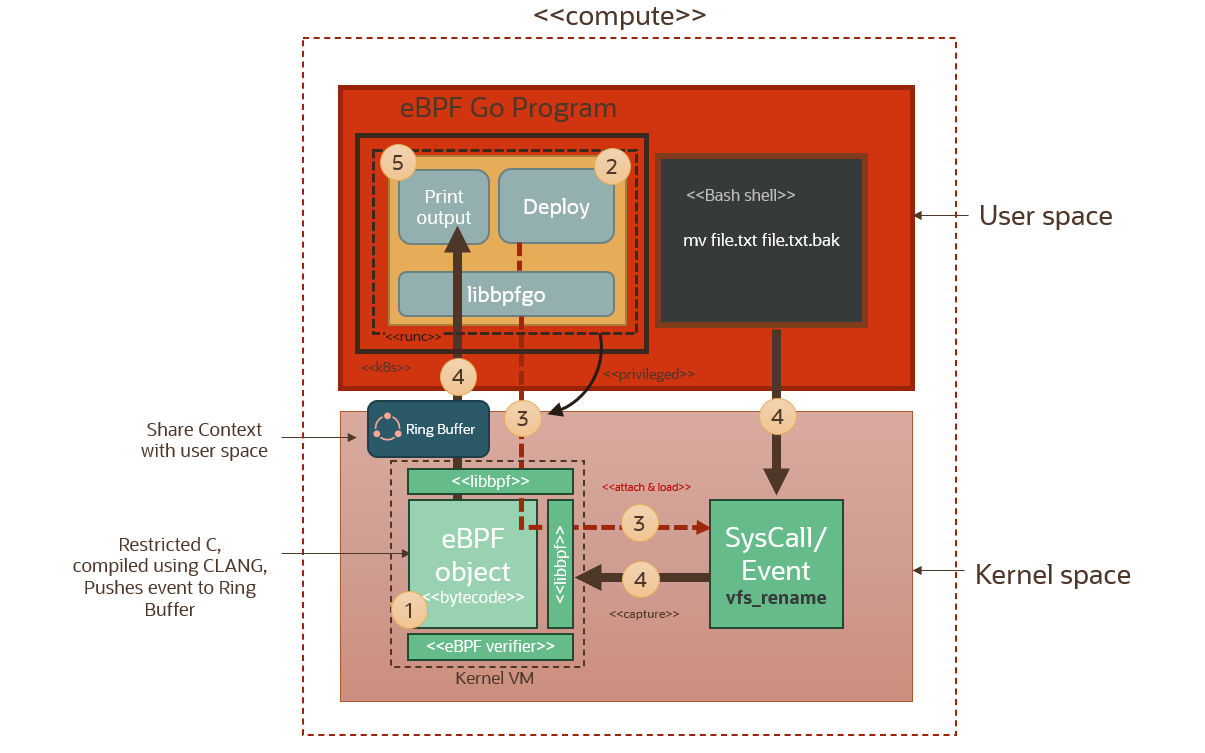
Now that we’ve seen how the eBPF program and the probe can be deployed in a docker container running in privileged mode, let’s see how we can deploy this container as a deamonset running in kubernetes. As we will see below, a number of solutions/frameworks based on eBPF are packaged as containers and can be deployed on kubernetes. The containers will be running in privileged mode of course, with the daemonset ensuring that each pod is running on each worker node in the cluster. This way the eBPF pods will be able to access and attach probes to the kernel and unobtrusively monitor for events across any workloads running on this cluster, and across all worker nodes in the cluster.
We use workload resource descriptor for the daemonset as highlighted below. We’re using a resource template for the containers. The template specifies the container settings for the pods that will be deployed as part of this daemonset. The image is the name of the image deployed in OCIR, and notice the securityContext that explicitly specified privileged mode (lines 27-28 below). The container runtime which OKE uses, runc, will make sure that containers are started in privileged mode, so that our eBPF programs can run as privileged host root users with access to the host kernel space.
This is the toplogy of the cluster after deployment:
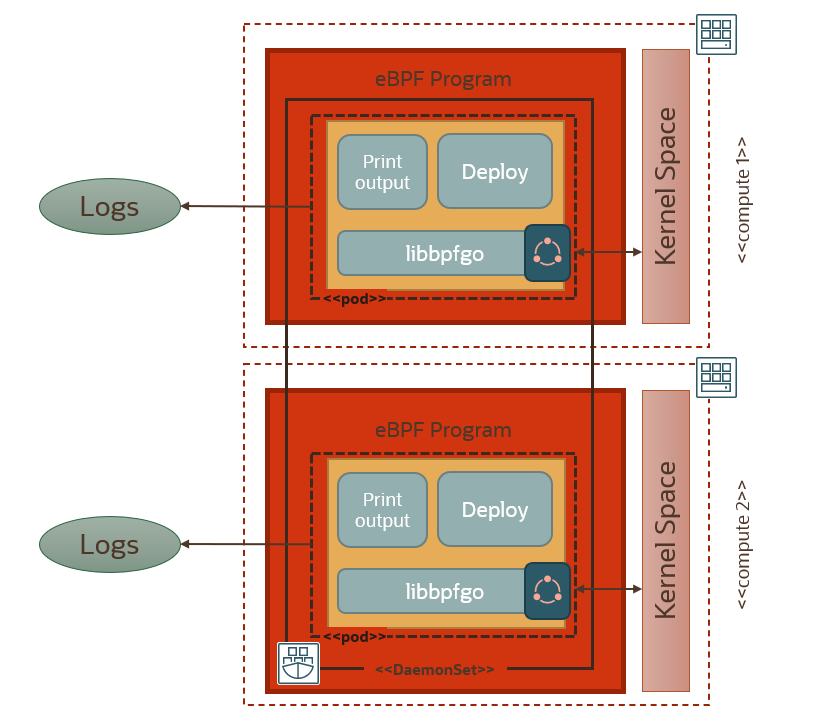
Now in our 2-node cluster each pod/container will output logs locally. After deploying the daemonset and checking that our pods are running, we can start interrogating our container logs generated from the two pods running in the daemonset that is spanning the cluster.
You can see above that we are streaming the logs from both containers to the terminal, and we can see how each pod is capturing the eBPF syscalls on its respective worker node. To centrally monitor logs in one place across the whole cluster, we can integrate with logging analytics via streaming. We will explain how to do this in the next section.
Integrating With Logging Analytics in OCI
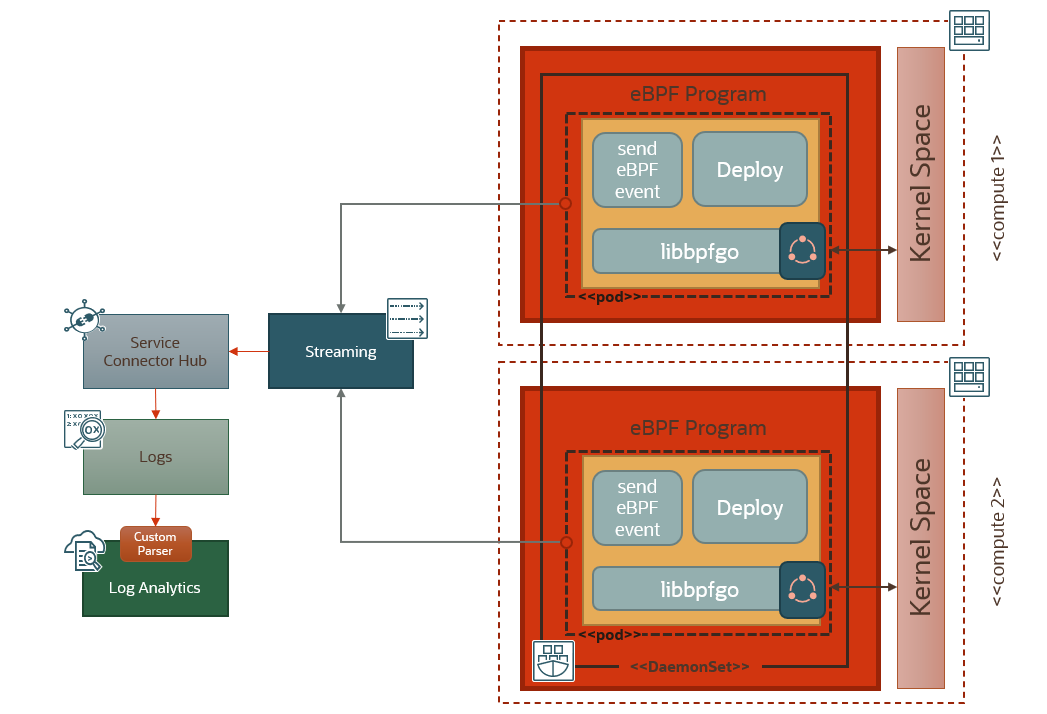
To centralize the monitoring of the eBPF events, we use an OCI stream as an ingestion mechanism. We modify the eBPF program running in the user space to enable it to connect to the OCI stream endpoint and submit the captured eBPF events, using the OCI SDK. A Service Connector Hub pipeline is configured to pick up streamed eBPF events from the source stream and deposit them in a Logging Analytics log. Logging Analytics picks those events, parses them using a custom parser and populates a dashboard. Below is an overview of how the solution works.
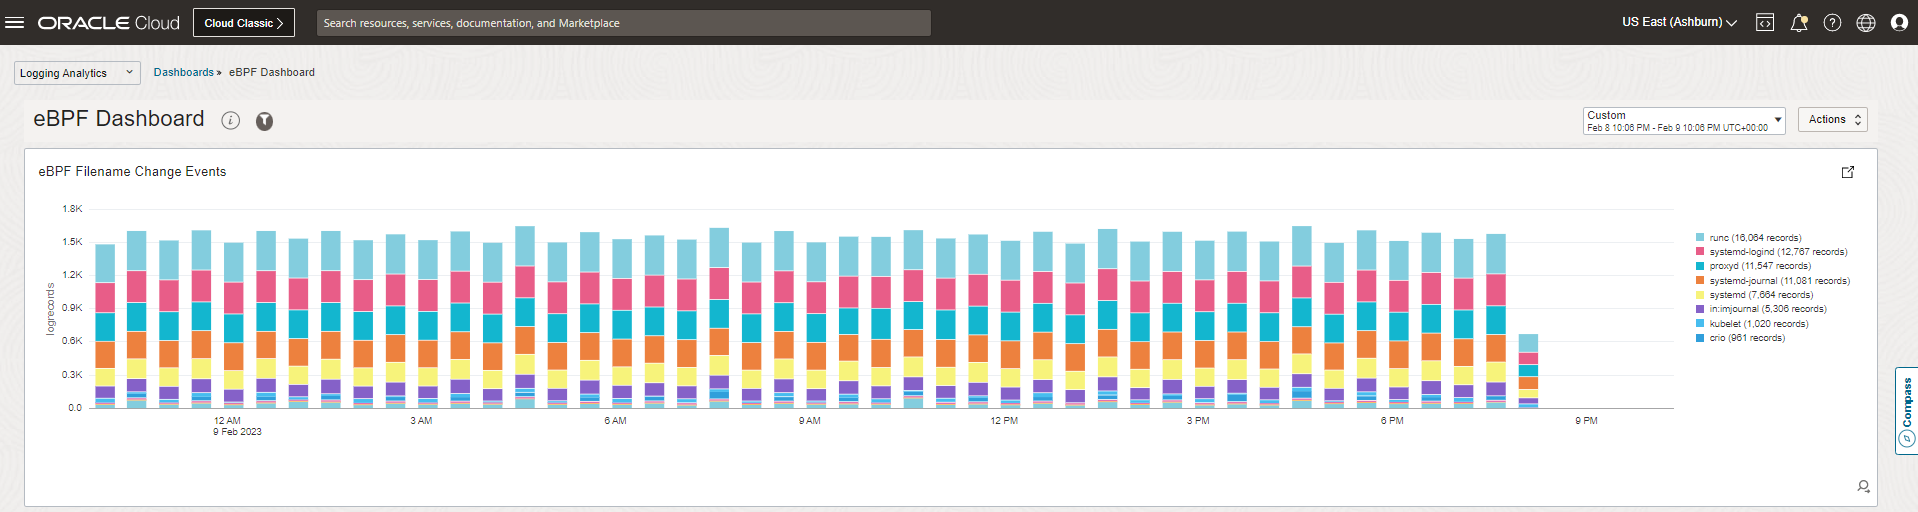
Here is a snapshot of the Logging Analytics dashboard in OCI, showing the flow of eBPF file rename events flowing in through streaming, and grouped in real-time by process name.
Solutions That Leverage eBPF
Now that we have an appreciation for what is eBPF and how it works, let’s go over the two main patterns applied by eBPF solutions, and see how they are being leveraged by current eBPF-based security/observability offerings in the market.
Passive Monitoring/Observability:
This is exactly the pattern that we’ve highlighted in the usecase above. Using eBPF probes to monitor OS events like monitoring API traffic, file access, performance monitoring, telemetry data, etc. The pattern is as below.
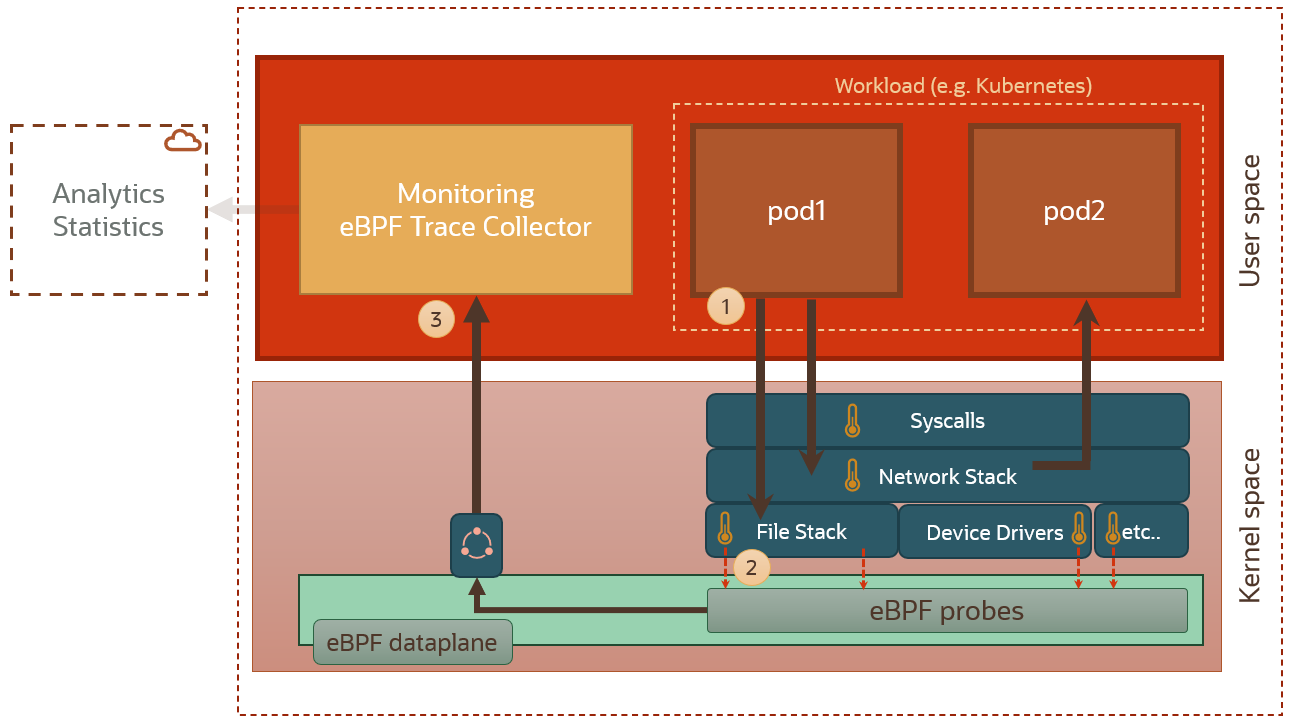
In this pattern, a monitoring agent or trace collector (3) in the user space gathers captured data from the eBPF probes (2) in the eBPF dataplane. There are lots of solutions out there that provide collectors that capture data/metrics from eBPF, and process and analyze this data either locally or in the cloud. We will give a glimpse of them at the end of this section.
Proactive Monitoring/Observability:
We can build proactive systems using eBPF. These systems can monitor, detect and proactively enforce policies.
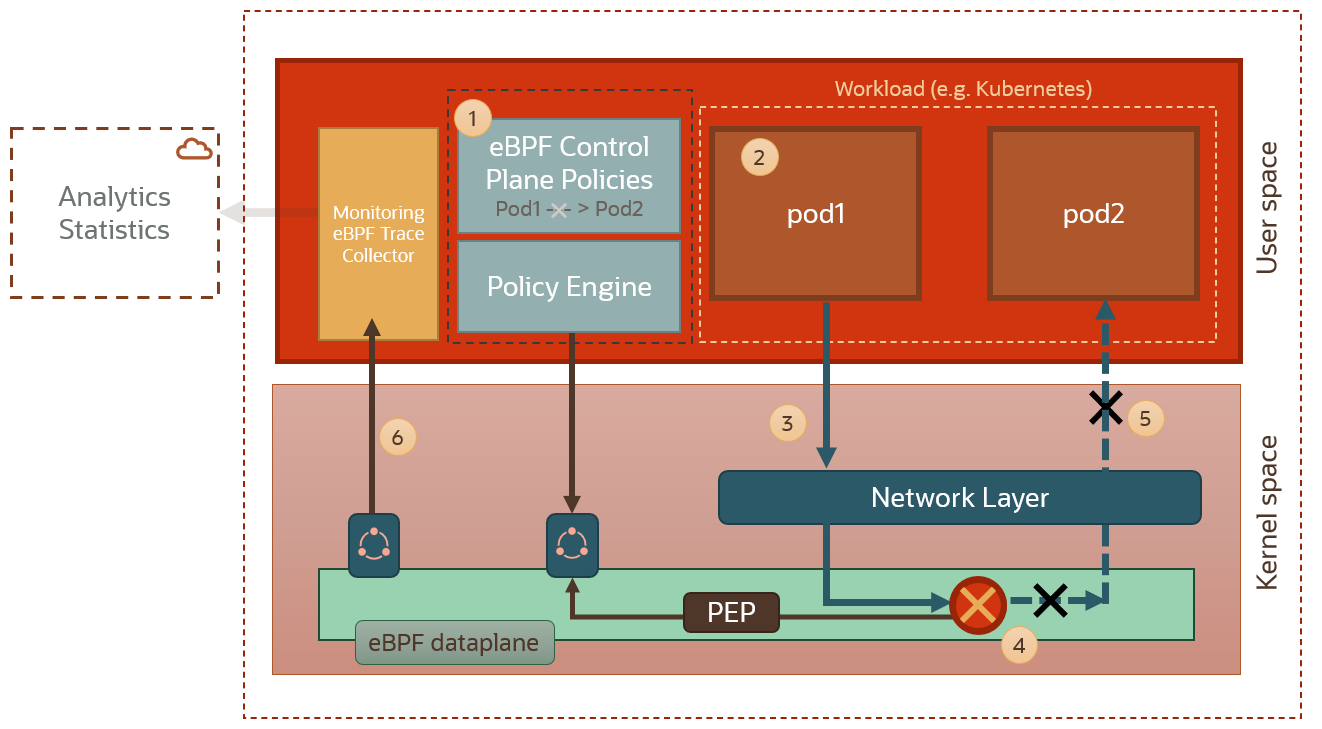
An example is networking policies. eBPF can monitor packets. We can use e.g. the ability to drop or modify packets using eBPF to block network connectivity between pods in a kubernetes cluster. In the diagram above we can see how the eBPF dataplane is intercepting network traffic between two pods, and blocking it based on a policy decision from the policy engine. Also, since we can send packets using eBPF and change the destination for a packet, eBPF allows us to create powerful networking functionalities, such us load balancing across pods and routing.
These kind of proactive eBPF capabilities also open up the possibility of next-generation service meshing because we do not need to instrument pods with sidecars anymore and can, instead, implement service mesh capabilities at kernel level with all the performance benefits that this approach entails. So dynamic routing between pods can happen in the eBPF dataplane, without having to inject physical sidecars in our kubernetes setup.
Established eBPF Frameworks/Solutions:
Below are some of the eBPF-based observability/monitoring/security frameworks that are making waves right now in the cloud native world.
- Akita: The Akita agent use eBPF to watch API traffic from the outside of your services. Using eBPF makes it possible to drop into any system without needing to change code or use a proxy. Akita implements the passive monitoring pattern.
- Celium/Tetragon: Provides runtime aware network policy capabilities that can allow us to leverage the eBPF context to granularly specify policies that are runtime aware (eg we can say pod A can talk to pod B only if pod B is running nginx, e.g.; the kind of policy that only runtime-aware engines can provide). Tetragon also provides full monitoring/profiling capabilities allowing complete/granular application behavior inspections. Tetragon implements both passive and proactive monitoring patterns.
- New Relic/Pixie: is an open source observability tool for Kubernetes applications. Pixie use eBPF to automatically capture telemetry data without the need for manual instrumentation. Pixie is especially useful when monitoring kubernetes clusters. It leverages eBPF to view the high-level state of a cluster (service maps, cluster resources, application traffic) and also drill-down into more detailed views (pod state, flame graphs, individual full body application requests). Pixie implements the passive monitoring pattern.
- Tigera/Calico: Calico eBPF solution is an example of how eBPF can be leveraged to augment the Linux network pipeline. Calico offers an eBPF dataplane solution that replaces kube-proxy, offering multiple benefits like reducing packet latency, preserving source IP addresses and incurring less CPU consumption. These type of capabilities cannot be offered while using kube-proxy and the standard Linux networking pipelines.
Conclusion
We’ve seen how in this blog how metrics can traverse all the way from the kernel to the cloud, via glibc, clang, libbpf, golang, docker, kubernetes, deamonsets, pod resource templates, OCIR, Streaming, Service Connector Hub, a custom logging analytics parser and a Logging Analytics dashboard… In real-time!
eBPF will be ubiquitous and available to everyone. Solutions in the security, observability and monitoring space that leverage it will transform developer and end user experience (they already are!). People may not recognize necessarily eBPF by name, but they will recognize it by its capabilities: through solutions that will revolutionize how security/observability and monitoring are implemented; solutions that will extend more effectively on capabilities that can be achieved currently through more traditional approaches.
We will be following up on this theme with blogs covering cloud native security frameworks and some of the solutions that are built using eBPF; and will showcase how they can be used to enhance security and monitoring for cloud native workloads running on OCI. So stay tuned!
References
- https://ebpf.io/blog/ebpf-for-all
- https://isovalent.com/blog/post/2022-05-16-tetragon
- https://www.tigera.io/learn/guides/ebpf/
- https://docs.cilium.io/en/latest/bpf/architecture/
- https://nakryiko.com/posts/bpf-core-reference-guide/
- https://github.com/aquasecurity/libbpfgo
- https://docs.oracle.com/en-us/iaas/Content/Streaming/Concepts/streamingoverview.htm
