Overview
Oracle Business Intelligence (OBIEE/OAS) and Oracle Business Intelligence Applications (OBIA) are mission-critical platforms that enable organizations to make data-driven decisions. These systems are complex and span multiple tiers — including databases, WebLogic servers, BI components, and ETL tools.
Without proactive monitoring, performance issues, component failures, and integration problems can go unnoticed until they impact end-users or critical reporting processes. By using Oracle Cloud Infrastructure (OCI)’s Observability and Management services you can create a unified view across all tiers of your BI platform, enabling your operations and support teams to collaborate effectively.
This blog explains how to monitor OBIEE/OBIA environments using Oracle Stack Monitoring.
Why Use Stack Monitoring for WebLogic and Oracle DB?
- Allows you to auto-discover your application stack.
- Predefined metrics and dashboards for WebLogic and Oracle Database.
- Topology views of interconnected services.
- Predefined Alarm templates to proactively monitor and notify resource health.
Discover WebLogic Domain and Oracle Database
Prerequisites
Please ensure the prerequisites for enabling stack monitoring have been completed – refer to the documentation in the References section.
- Oracle Cloud Infrastructure (OCI) tenant with O&M Stack Monitoring enabled
- An O&M Management Agent installed and running on the target hosts including the Database nodes
- Access to WebLogic Admin Console URL
- Weblogic Account and Password
- Database Monitoring User Setup Completed
- Database Monitoring Username and Password
- Proper IAM policies for Stack Monitoring to access resources
Discovering WebLogic Domain
Step 1: Navigate to Stack Monitoring
1. Log in to the OCI Console.
2. From the navigation menu, go to: Observability & Management → Stack Monitoring
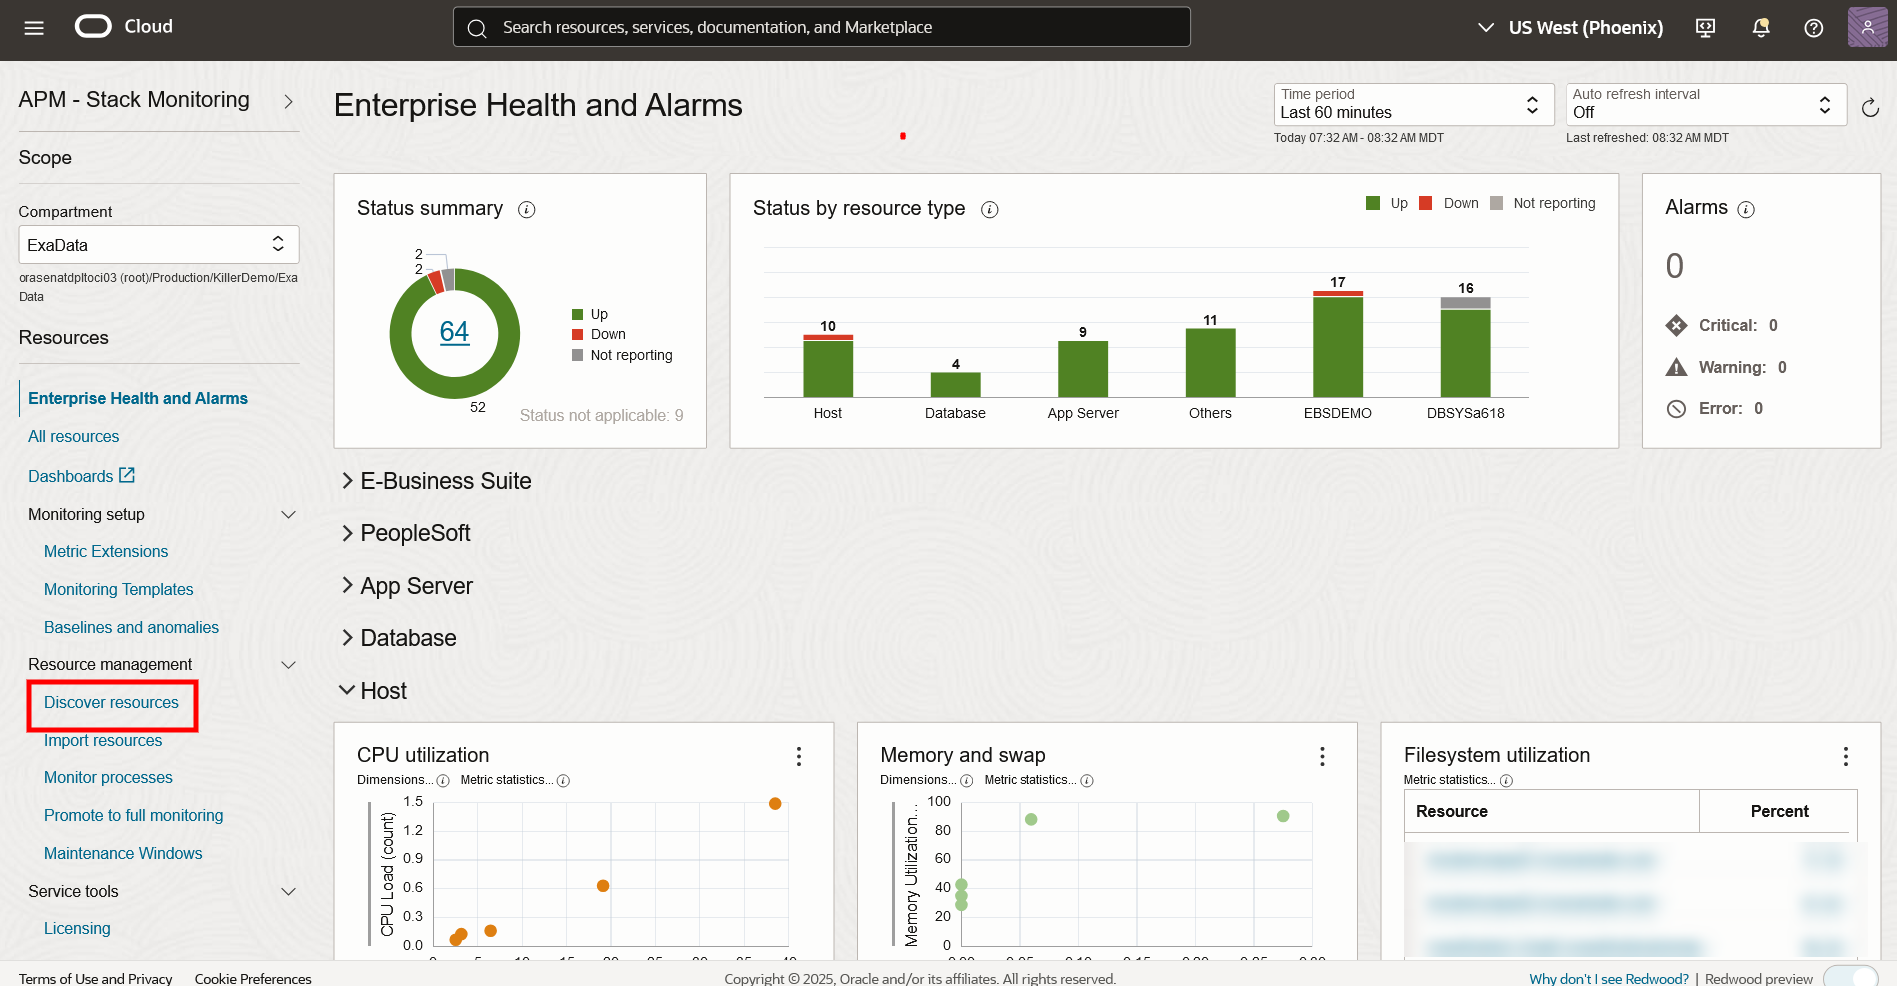
Step 2: Discover Oracle WebLogic Domain
Select Resource Type
Choose WebLogic Domain and click Next.

Step 3: Provide Discovery Details
- Resource Name – Domain Name
- Admin Server Host and Port
- Select the Management Agent on the Admin Server Host
- Credentials – Weblogic Admin Username and Password
- Discover in – Stack Monitoring and Logging Analytics (this is recommended even if you are not using Logging Analytics currently)
- License – Select Standard Edition – You can always change to Enterprise Edition later if you want to use additional features provided by Enterprise Edition
Step 4: Discover and View Weblogic Resources
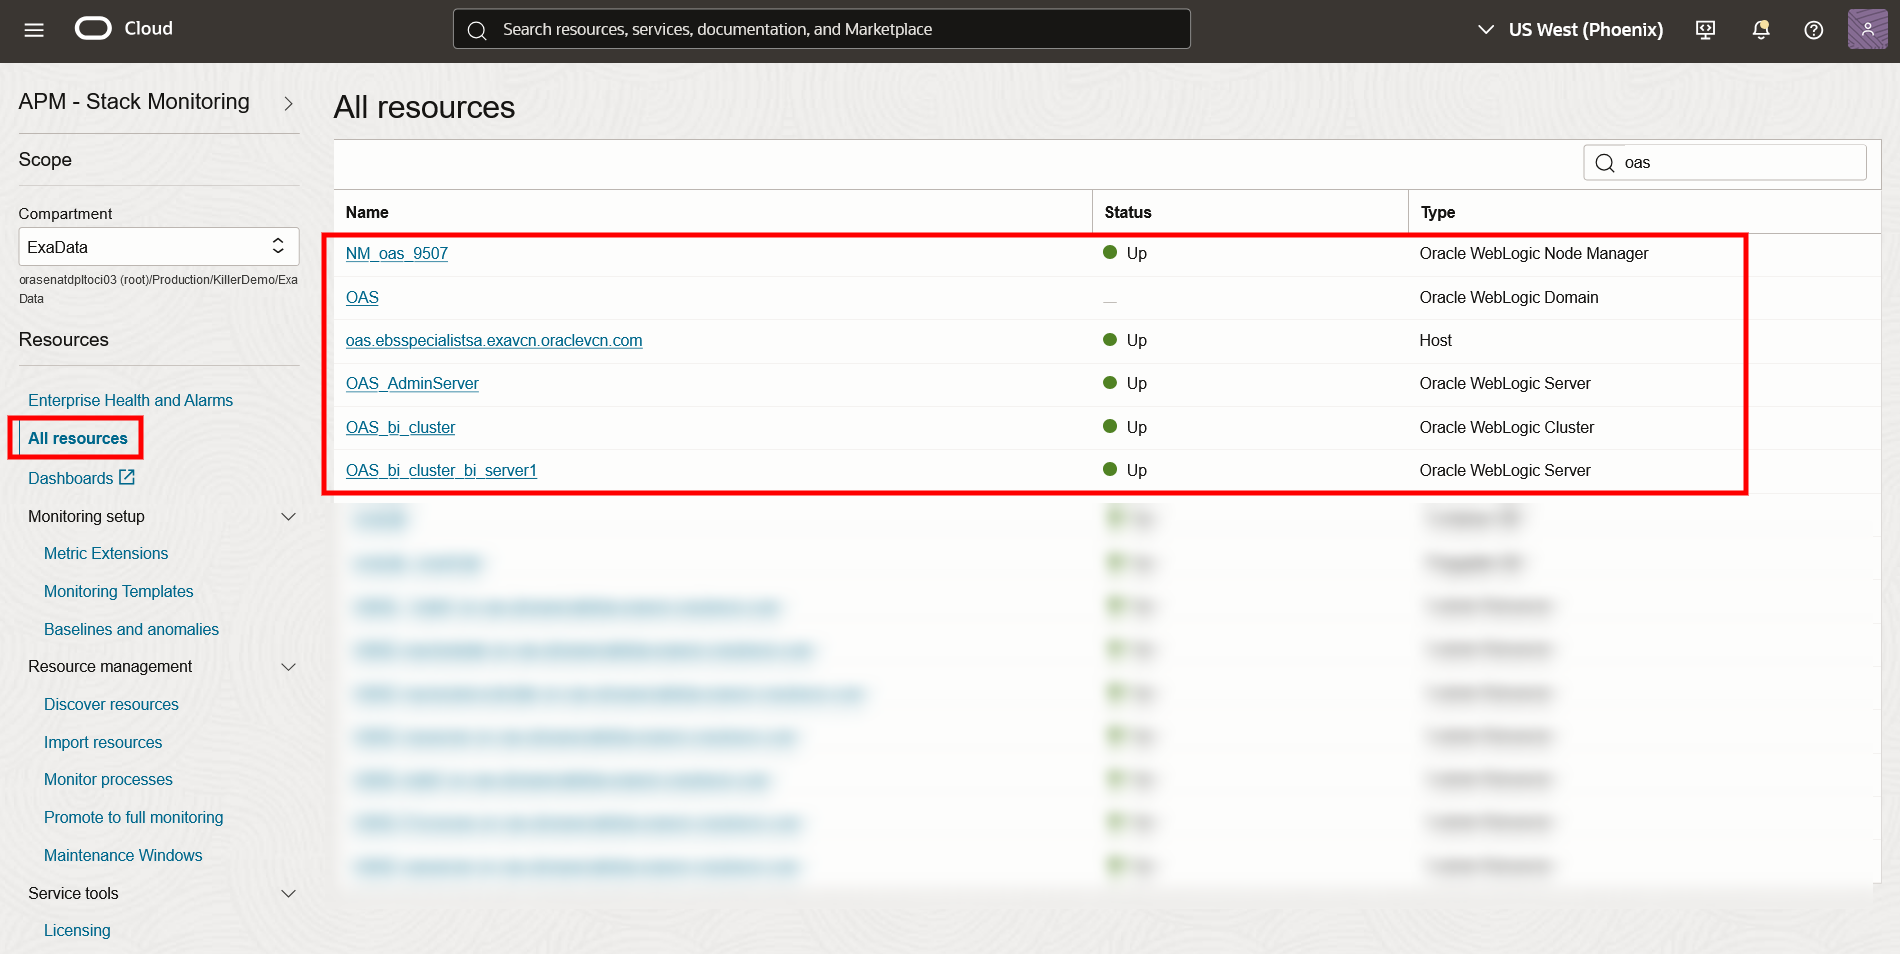
Click Discover New Resource. If successful, you can see the list of resources discovered – domains, clusters and managed servers.
You can Click on All Resources in the Side Menu to see the discovered resources as well as go into details of the configuration and metrics collected for each resource
Discovering Oracle Database
Step 1: Select Resource Type
Choose Oracle Database and click Next.
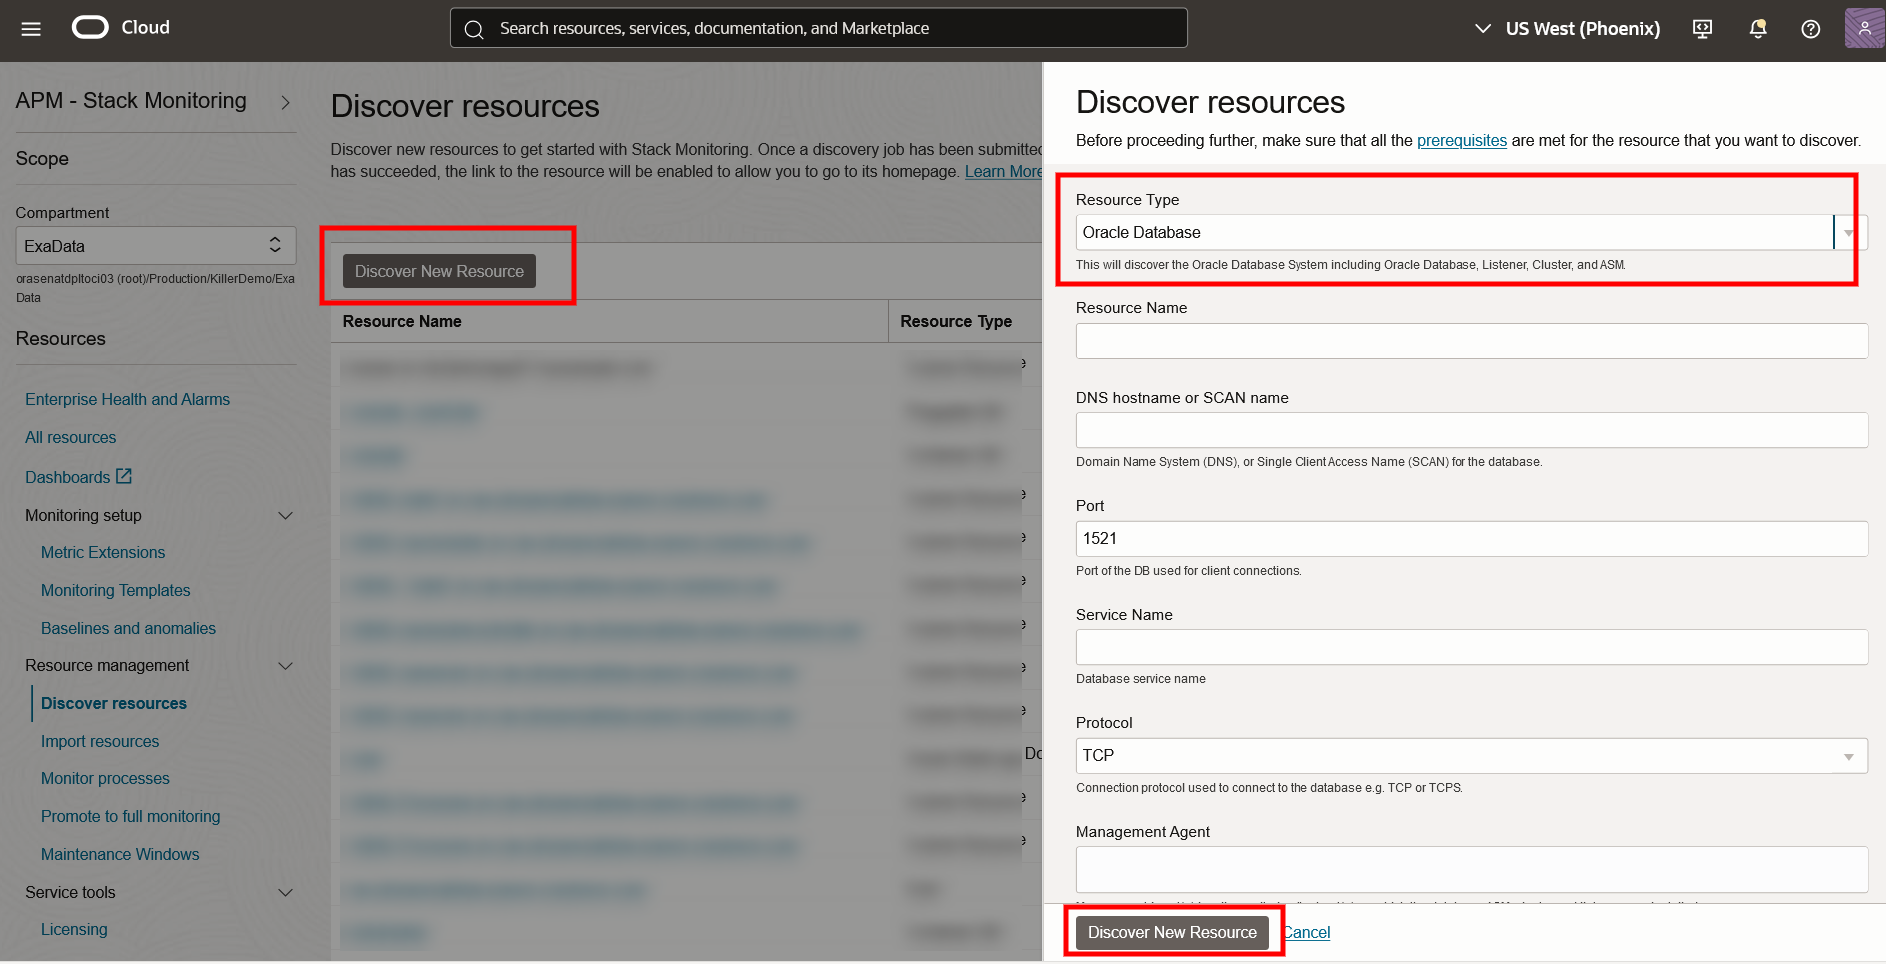
Step 2: Provide Discovery Details
- Resource Name – Container Database Name
- Database Scan Address
- Database Scan Port
- Database Service Name
- Select the Management Agent on the Database Node (For a multinode Database or Exa System, Select a management agent from any of the nodes)
- Database Credentials – DBSNMP or similar monitoring user (Please make sure pre-requisites for setting up this account in the database have been completed)
- If you like to discover associated ASM storage – Please provide the ASM connection and user details otherwise Choose the Disabled radio button
- Discover in – Stack Monitoring and Logging Analytics (this is recommended even if you are not using Logging Analytics currently)
- License – Select Standard Edition – You can always change to Enterprise Edition later if you want to use additional features provided by Enterprise Edition
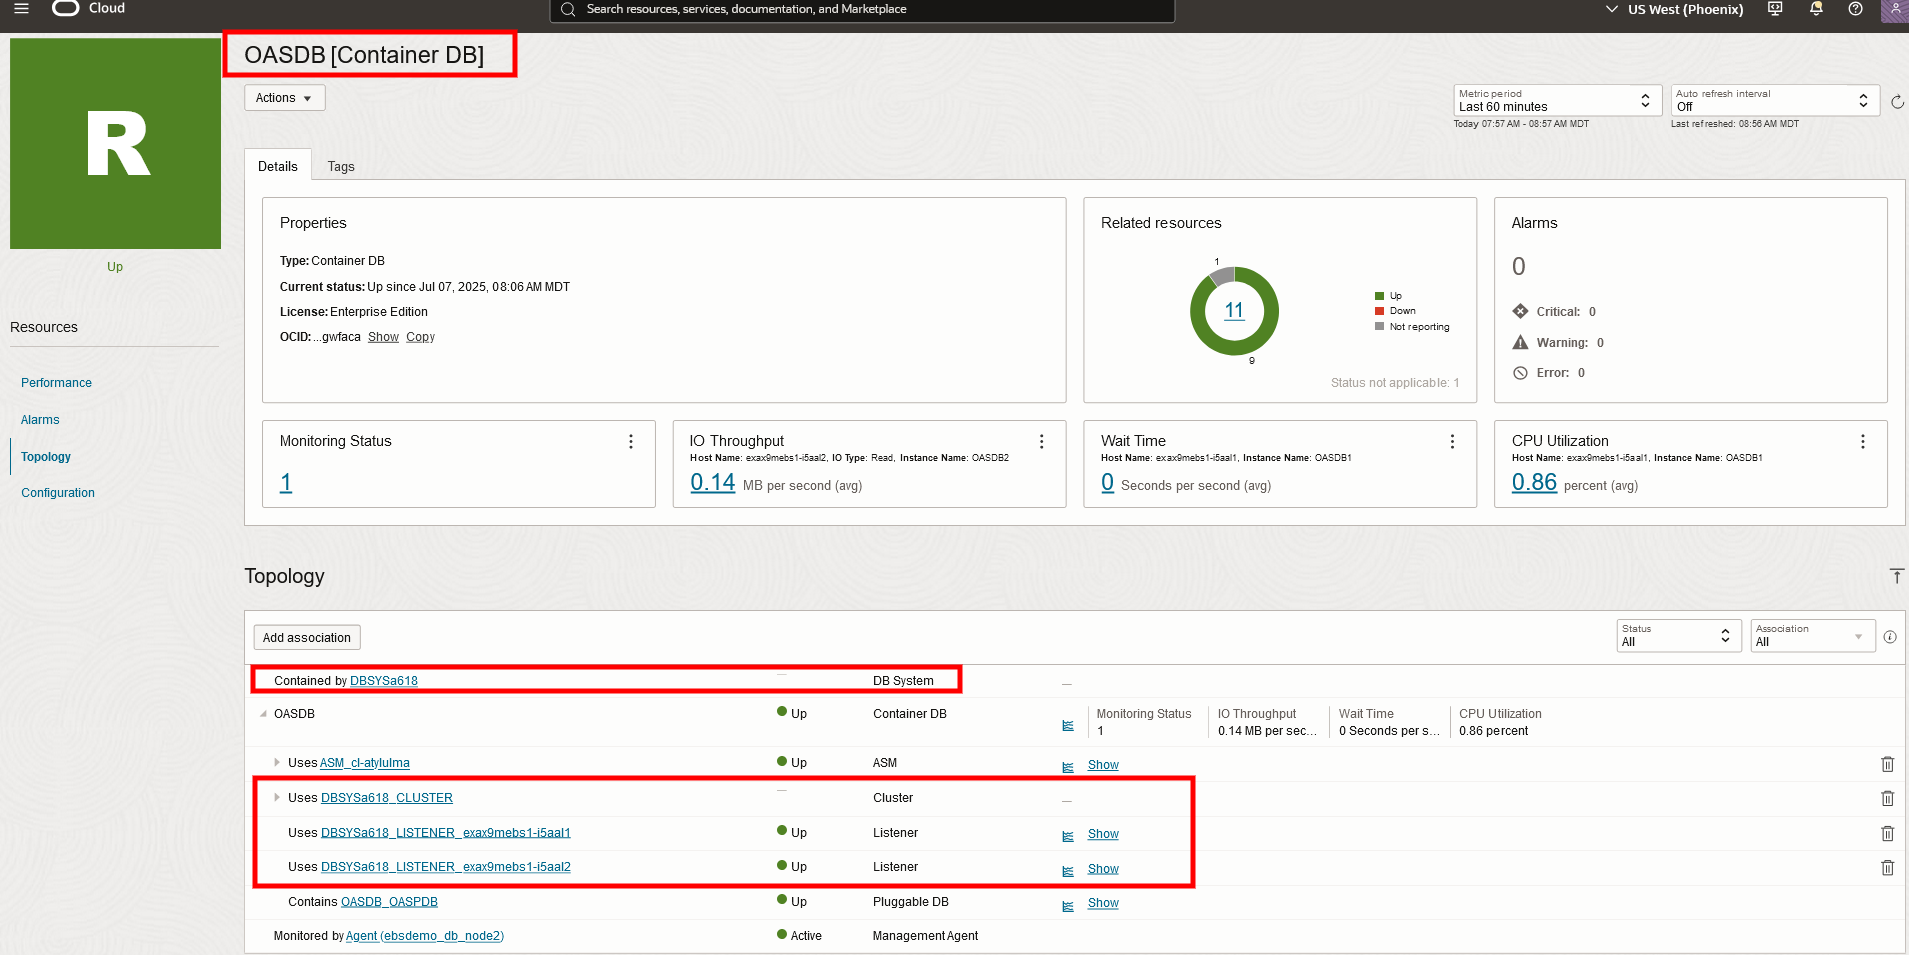
Step 3: Discover and View Database Resource
Click Discover New Resource. If successful, you can see the database system, associated listeners and container database.
You can Click on All Resources in the Side Menu to see the discovered resources as well as go into details of the configuration and metrics collected for each resource
Complete the discovery of Pluggable Database by repeating the same process but specify Pluggable Database as the resource type. You will need to provide the connection details for the Pluggable Database.
Add BI Services as Custom Process Targets
Key OBIEE/OBIA Services to Monitor
| Component | Process Name |
|---|---|
| BI Server | nqsserver |
| Presentation Server | sawserver |
| BI Scheduler | nqsscheduler |
| Cluster Controller | nqsclustercontroller |
| BI Java Host | obijh |
Creating Custom Process Targets
Step 1: Navigate to Stack Monitoring
From the OCI Console, go to:
Observability & Management → Stack Monitoring
[Insert Screenshot: OCI Navigation to Stack Monitoring]
Step 2: Add a Custom Process Resource
- Click “Add Monitored Resource”
- Under “Resource Type” select Custom Process
- Click Next
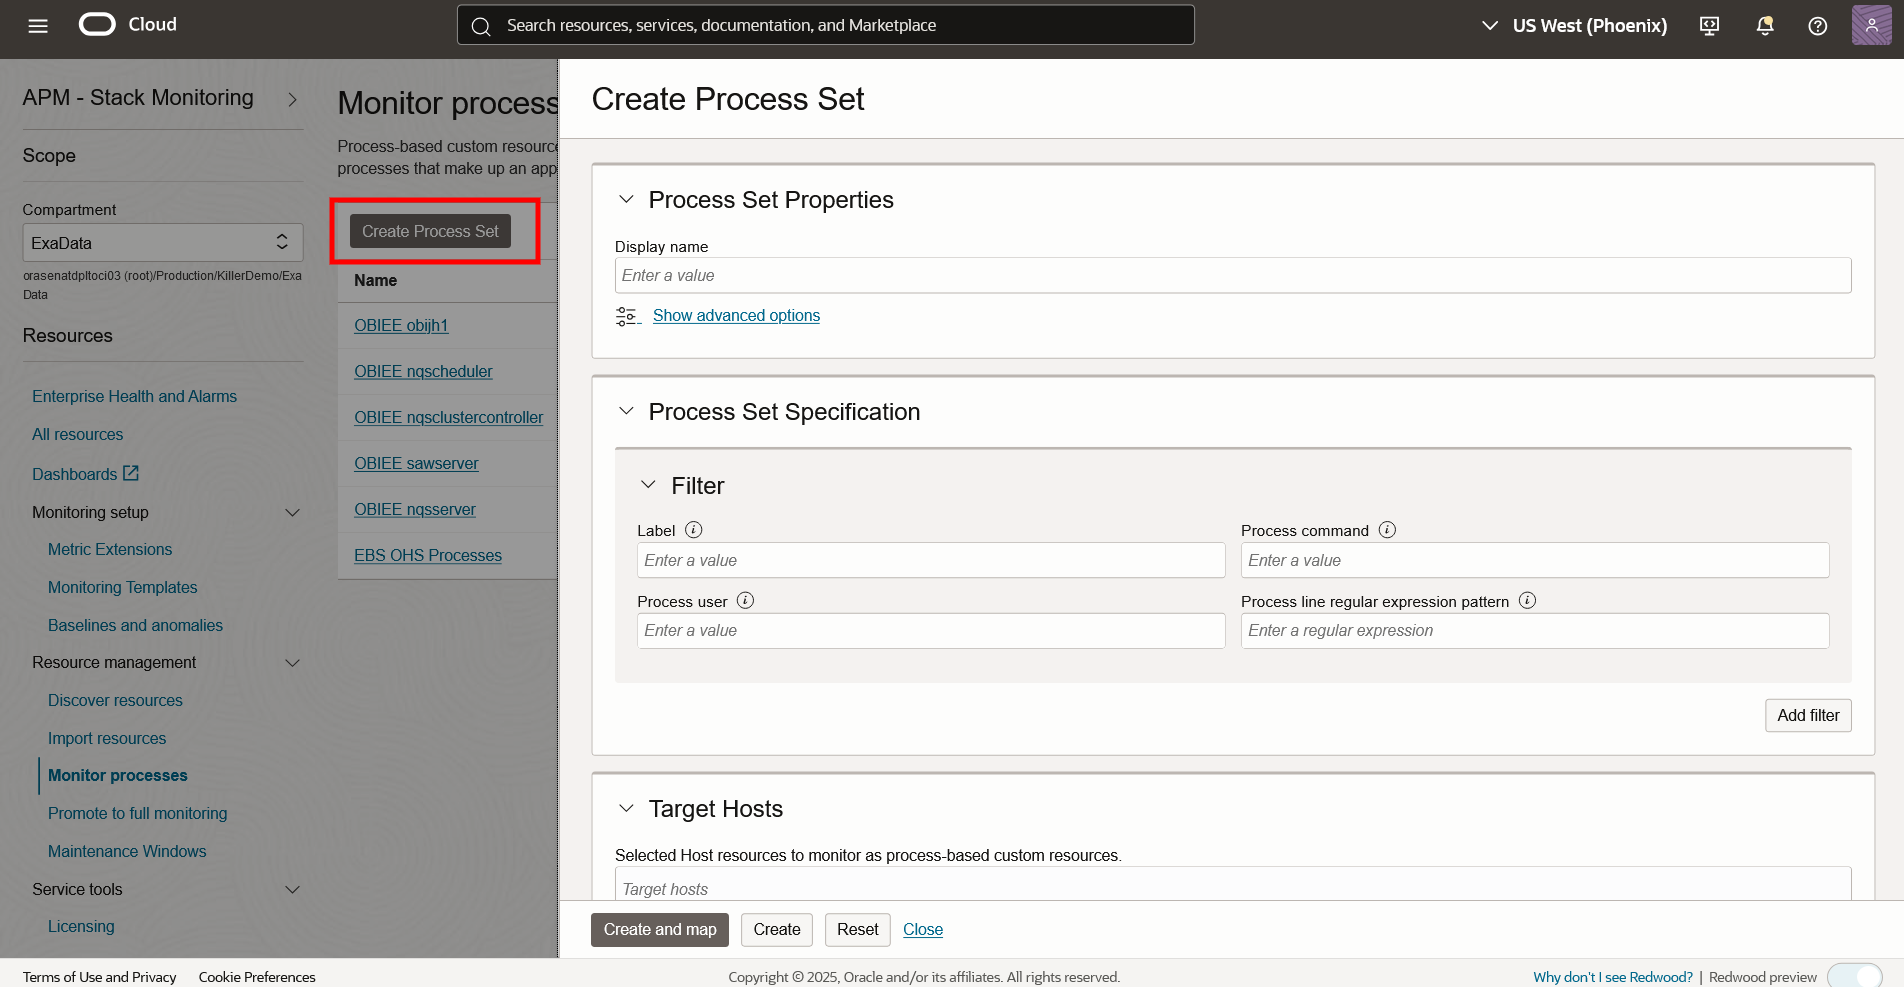
Step 3: Define Process Match Criteria
Specify the process you want to monitor:
- Process Name / Pattern: Match a part of the process command line (e.g., java -jar myapp.jar)
- Host: Choose from registered agent hosts
- Instance Name: A logical name for this resource in Stack Monitoring
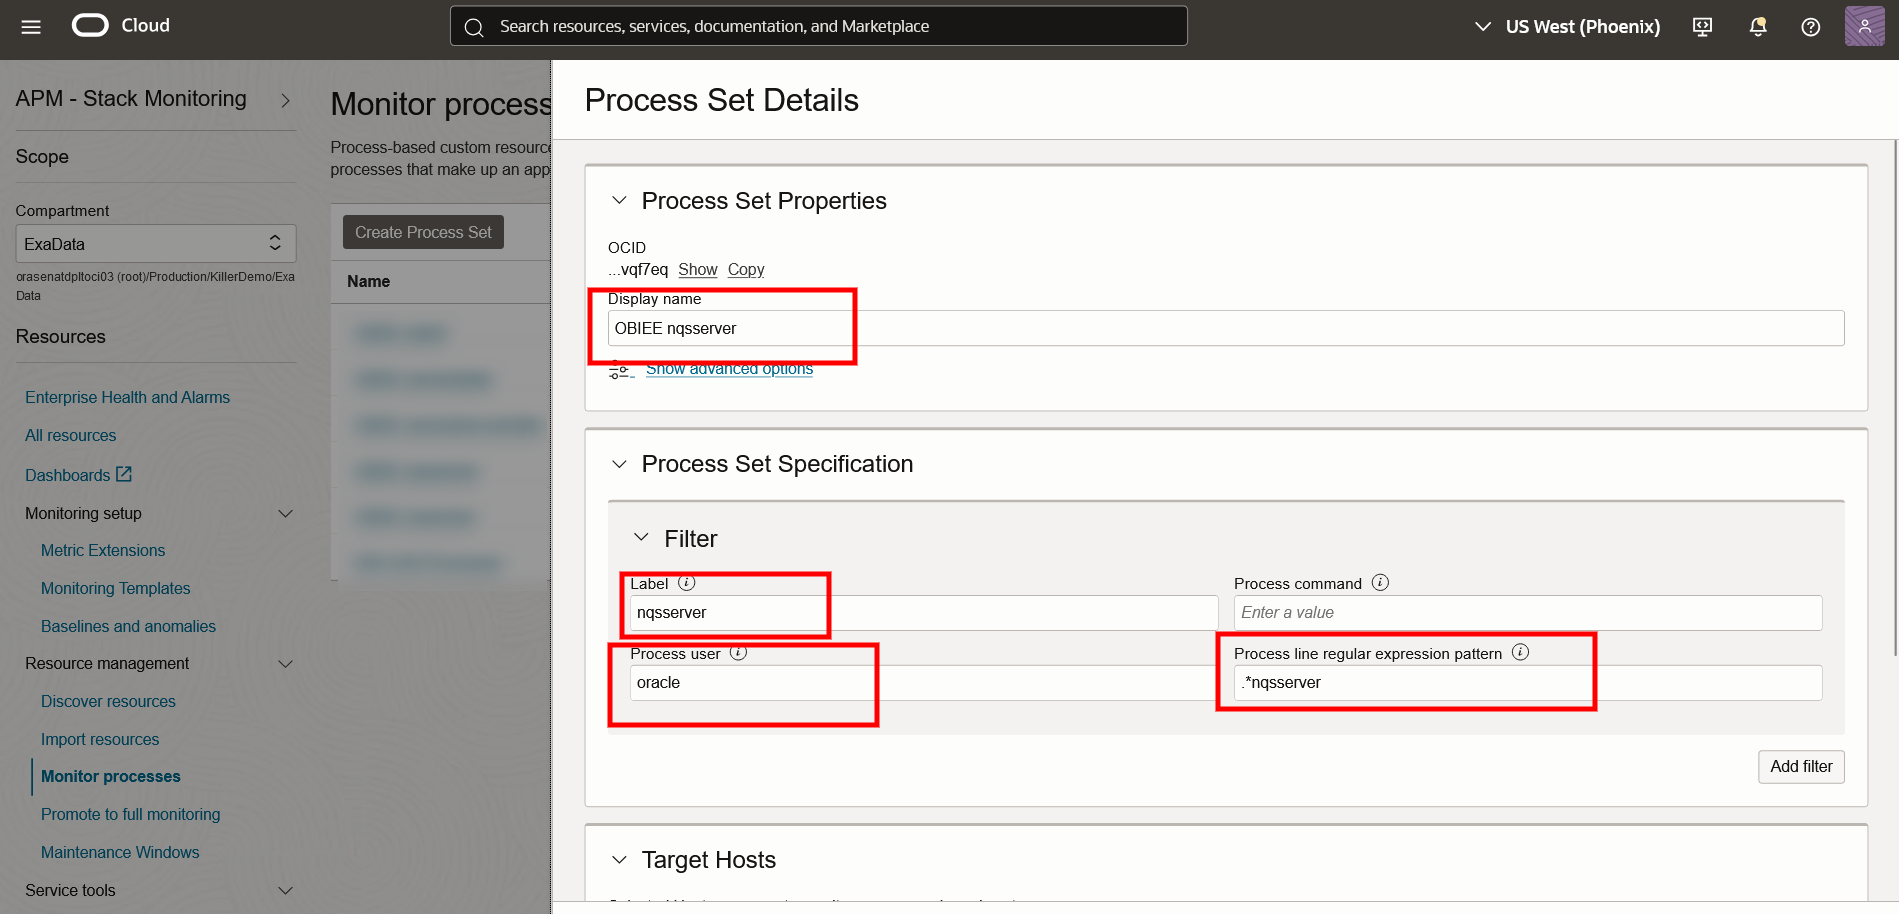

Click on Create and Map, the Agent will search for the processes on the selected server and start monitoring them if the patterns match running processes.
Repeat these steps for Creating Process Sets for the rest of the BI Processes listed above along with any ETL processes you have.
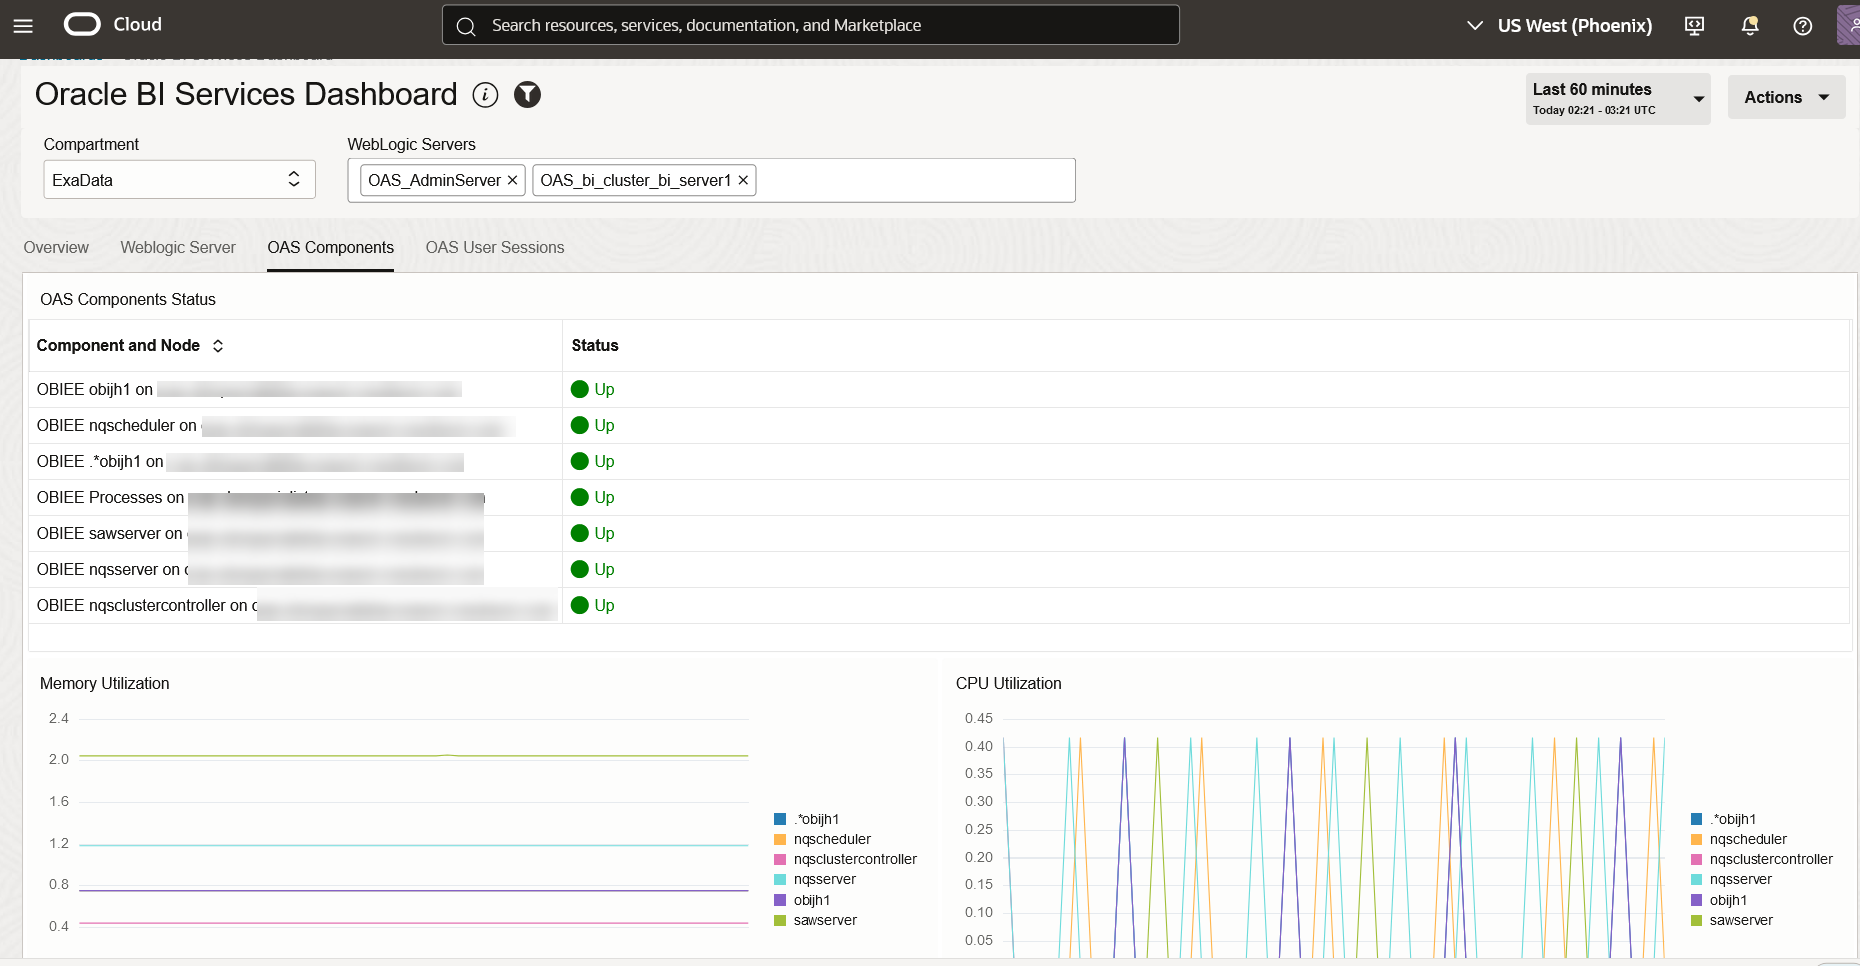
Step 4: View Custom Process Metrics
Within a few minutes, the process resource will appear in your Monitored Resources list. These Processes will show as type – Custom Resource

Metrics include:
- Up/Down Status
- CPU Usage
- Memory Consumption
- Number of Processes running


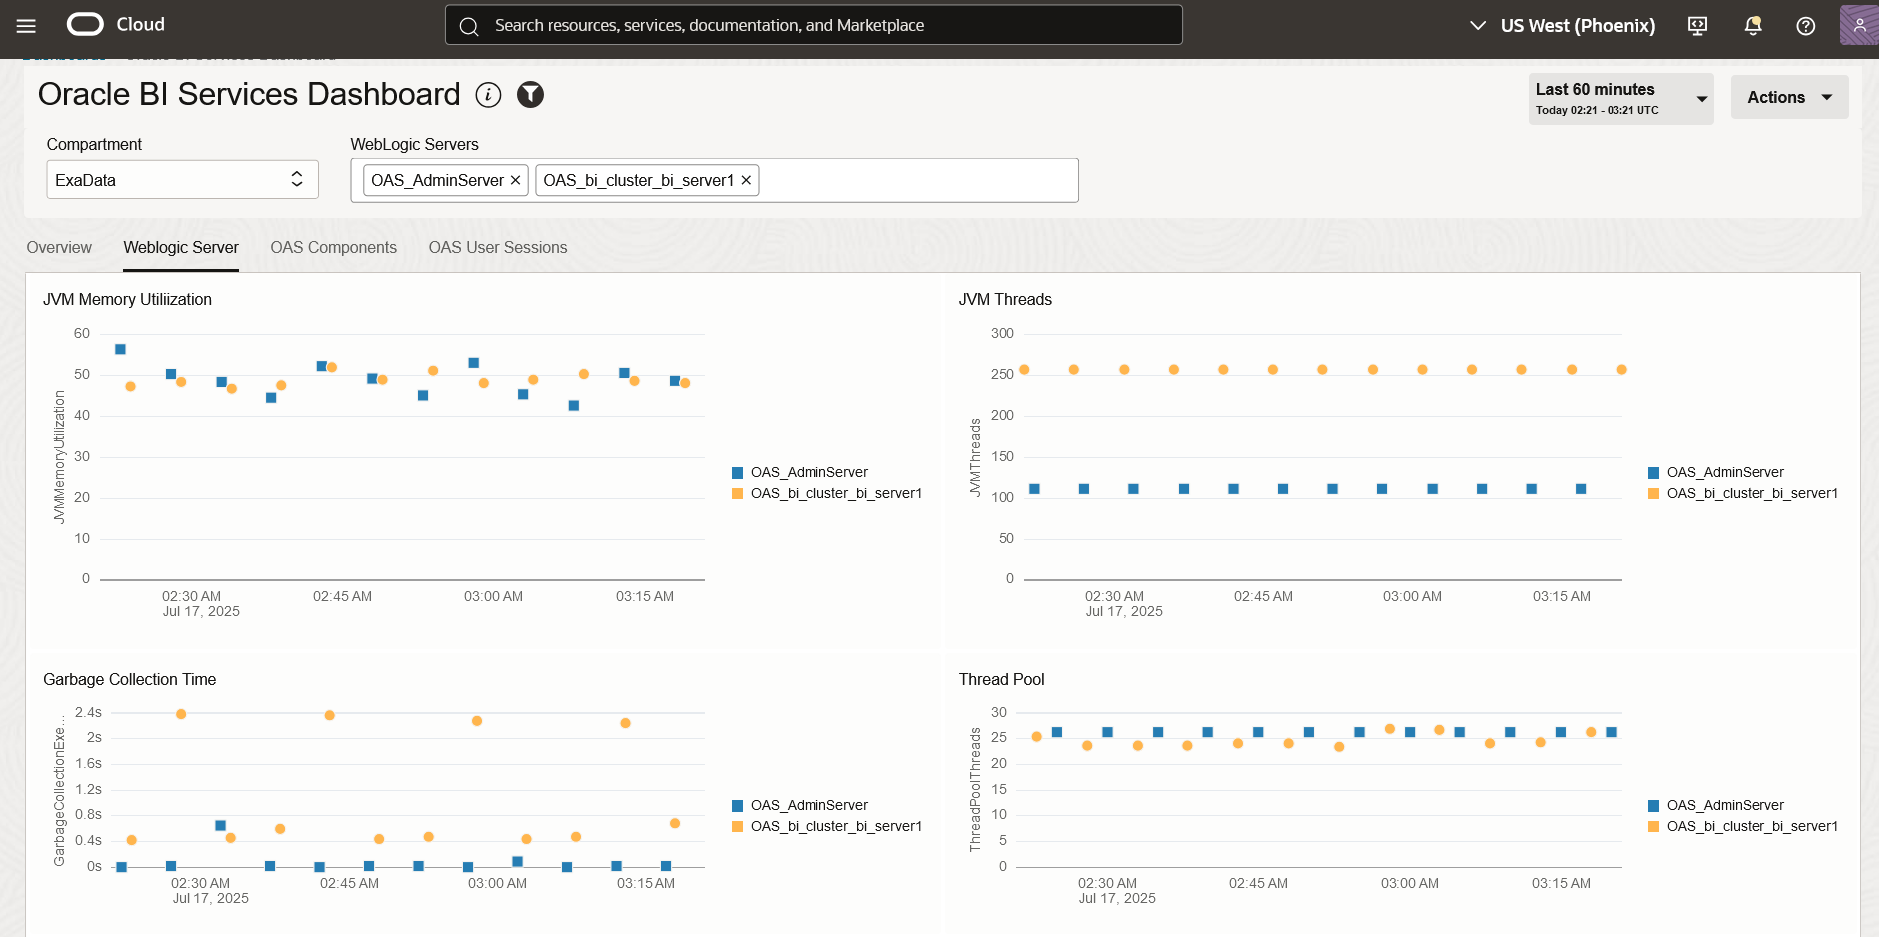
Create a Health Dashboard
You can create a dashboard from scratch or duplicate a seeded dashboard and modify to add new widgets.
Here is a dashboard that has been created to include all the components of the OBIEE/OBIA Stack in multiple tabs.
.
Summary
Monitoring the OBIEE/OBIA application stack using Oracle Cloud Infrastructure (OCI) Stack Monitoring is essential for maintaining high availability, performance, and reliability in enterprise analytics environments.
In this blog, you learned how to:
- Discover and monitor WebLogic Domains and Oracle Databases
- Add BI service components (e.g., BI Server, Presentation Server) as Custom Process Targets
- Create a Custom Dashboard for OBIEE/OBIA
By integrating all components into a single observability layer, you gain a full-stack view of your BI platform, reduce downtime, and improve troubleshooting efficiency. Whether you are supporting OBIEE/OBIA or ETL pipelines, you can use the features provided by Stack Monitoring for a proactive approach to system management.
Note: A reminder that Oracle observability and Management services can be used to monitor applications running in other Clouds as well as On-Prem.
Next up: In the next part of this series, we will look into collecting OBIEE/OBIA User Audit data and adding this information to the dashboard.
Resources and References
- Stack Monitoring – Discover WebLogic Domains
- Stack Monitoring – Discover Oracle Databases
- Stack Monitoring – Expand Monitoring Capability with Custom Resources
- Stack Monitoring – Monitor the Status and Performance of Your Enterprise