Application Performance Management is a powerful service OCI provides for Monitoring performance of Applications. The tracing functionality captures spans(events) created by user interactions on the application’s user interface as well as any API calls made from and to other services. While this powerful capability allows operations teams to resolve support issues, we are always looking to optimize the cost of the service to justify the deployment of the service for critical business applications.
In this blog we will review the options available for optimizing the cost of APM trace service without losing the capabilities that allow for tracking the bottlenecks in the use of an application UI as well as backend API calls.
The key to figuring out what events are being captured and charged and optimizing the collection is to find the events that are not critical to diagnose and resolve performance issues. This means eliminating events that take insignificant time to complete can be eliminated while keeping the more expensive and time-consuming activities. This will not only help the support teams to review the events for a particular business flow faster but also help in reducing the overall cost of using the service.
A dashboard that provides information of the events(spans) using the metrics provided by APM will help with this effort. You can import this prebuilt APM Traces Dashboard into your tenancy.
APM Pricing
APM Tracing service is charged based on number of events collected. There is No extra charge for viewing and retaining trace data, regardless of the number of VMs, CPUs, and hosts.
Try Application Performance Monitoring for free:
• Included in the 30 days OCI free trial
• Included in Always Free tier—always free, never expires, limited by ingest volume
Pricing includes:
• One hundred thousand events per hour is considered a unit for billing purpose. As this varies over time based on the working hours of the users you will only pay for events generated every hour thereby paying a reduced amount during non-peak usage hours. One unit is the minimum usage billed even when there is no usage if the APM domain is active.
• You can estimate the expected cost using the Cost Estimator. Link is included in the Resources and References Section at the end of this blog.
Using the APM Events Dashboard
Please download and import the Events Dashboard. While importing where there is an option to select the compartment, please select the Compartment where the APM domain was created. This dashboard uses the APM Events ingested in the current APM domain.
You can now open the APM Events Dashboard:
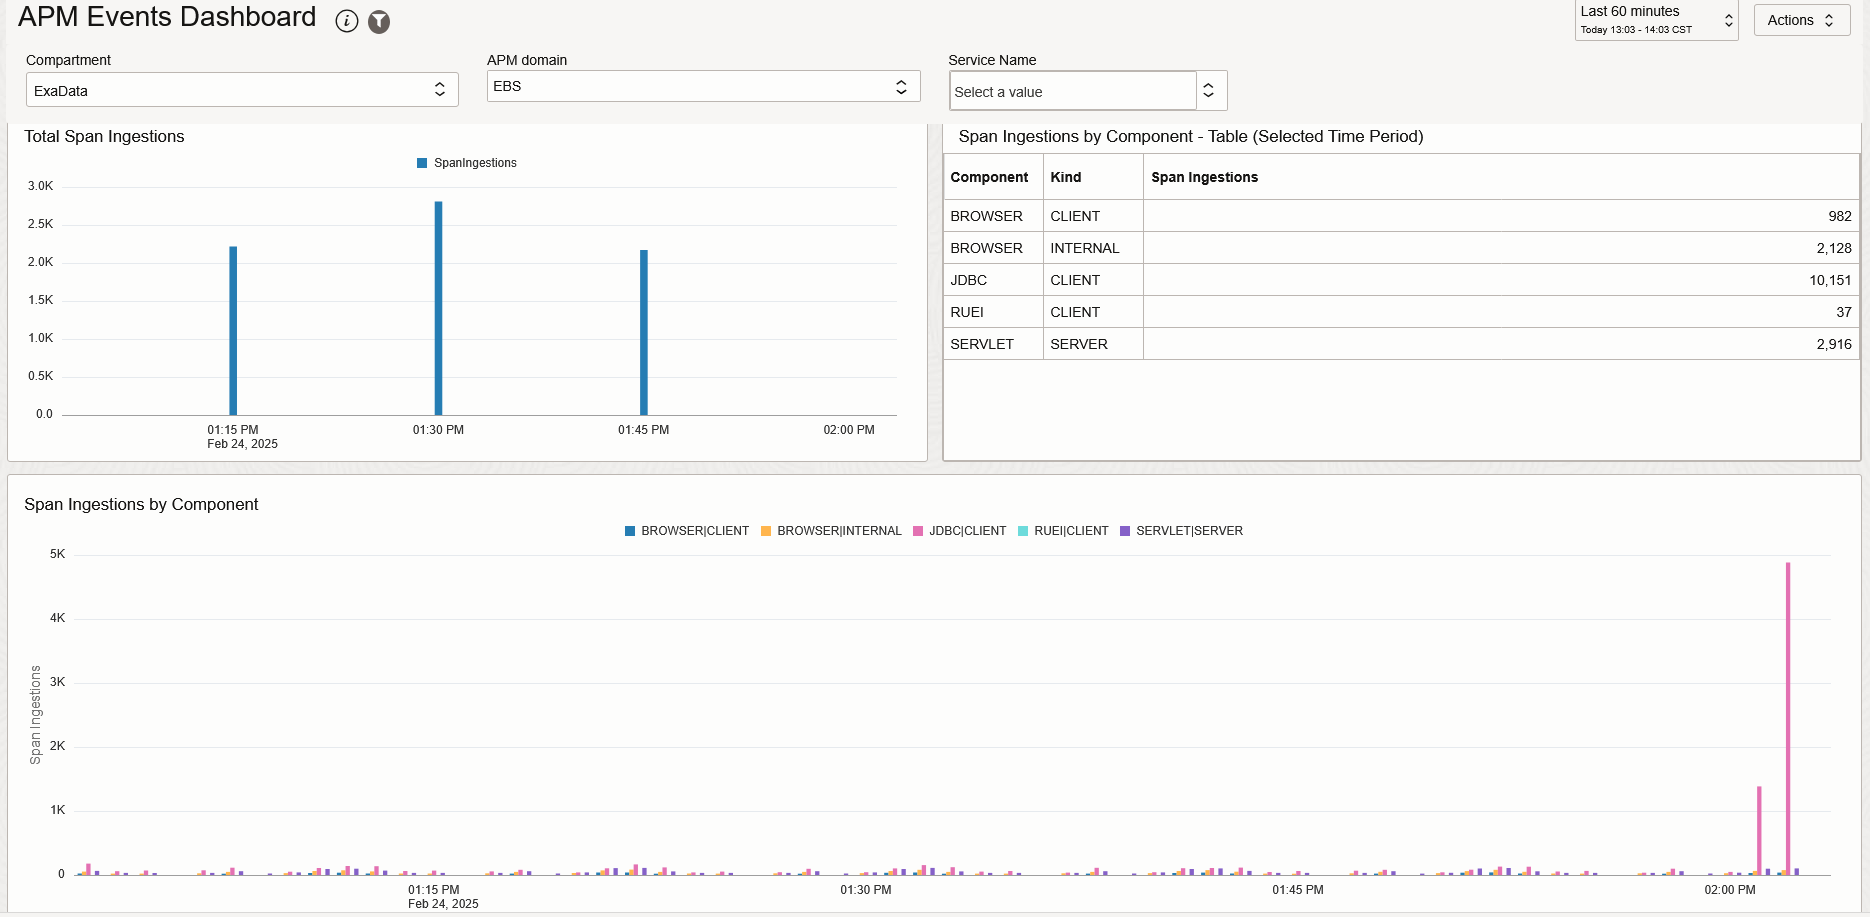
Identify the category of spans that have the most span counts. Based on the Count of Spans and the Duration taken, you can decide which type of spans we can filter so they are not collected any longer.
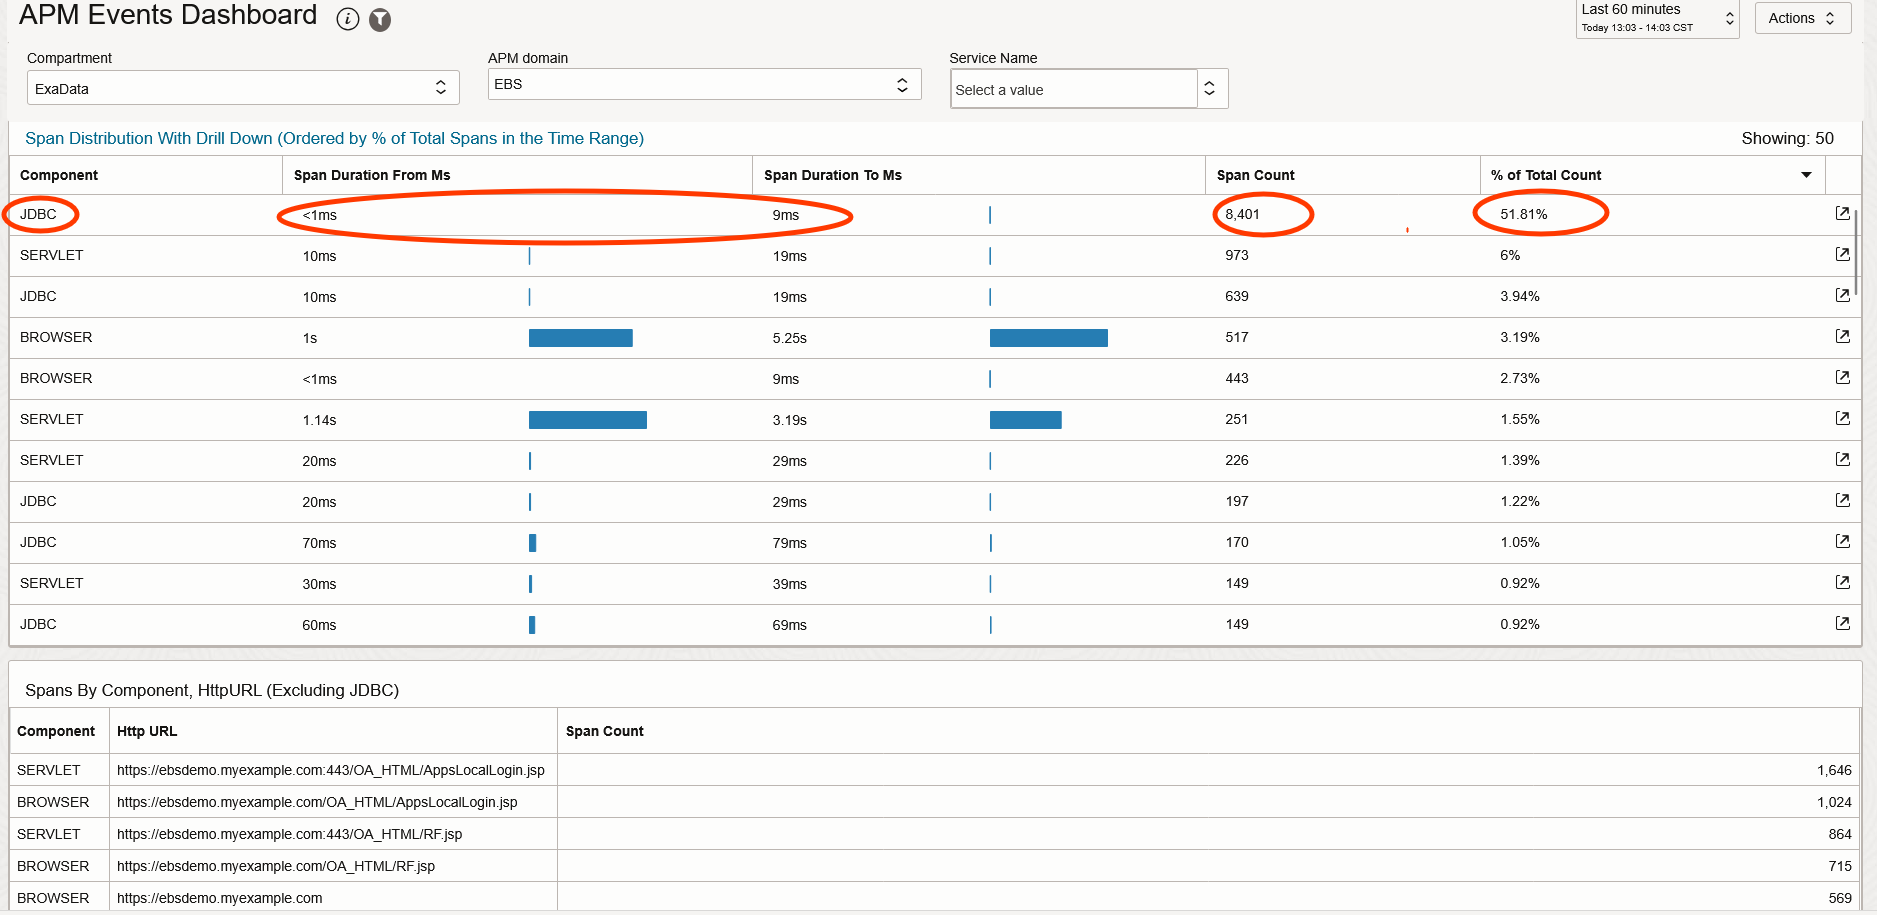
Example: In the diagram above, the JDBC spans with a Span Duration of 1 – 9 Ms have the highest count (8401) and are making over 50% of the total spans collected.
Since spans that are completing faster are not very useful for evaluating performance, these spans can be ignored. As a first step we can reduce the spans that are taking 5 Ms or less.
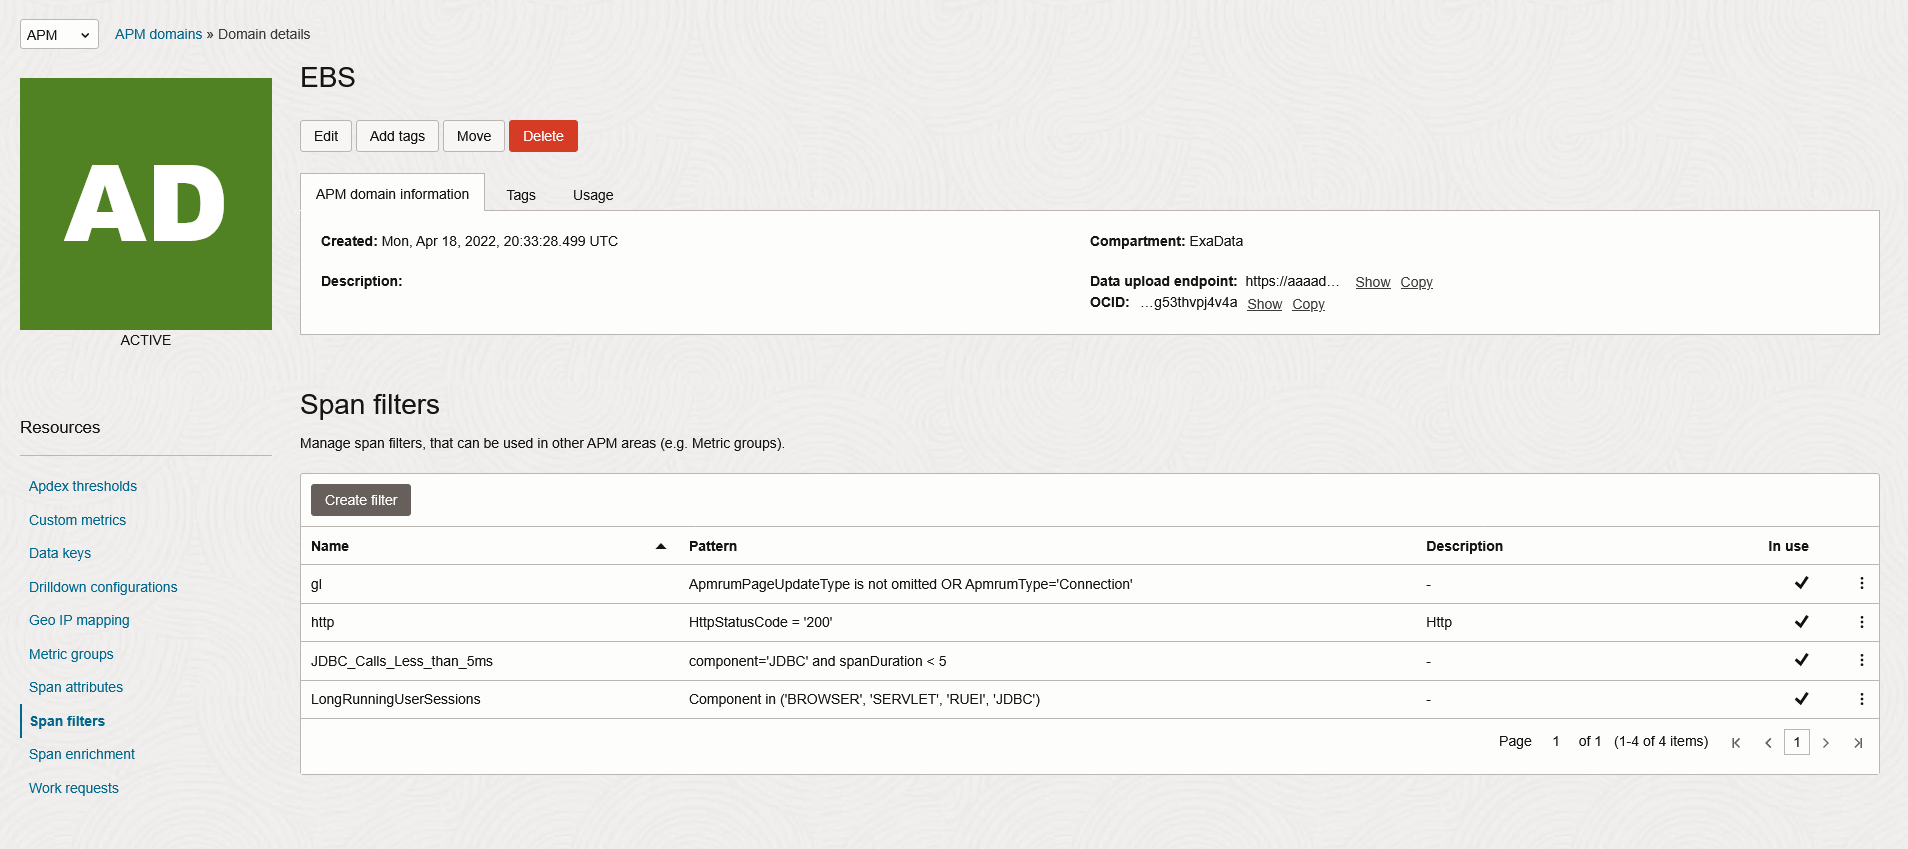
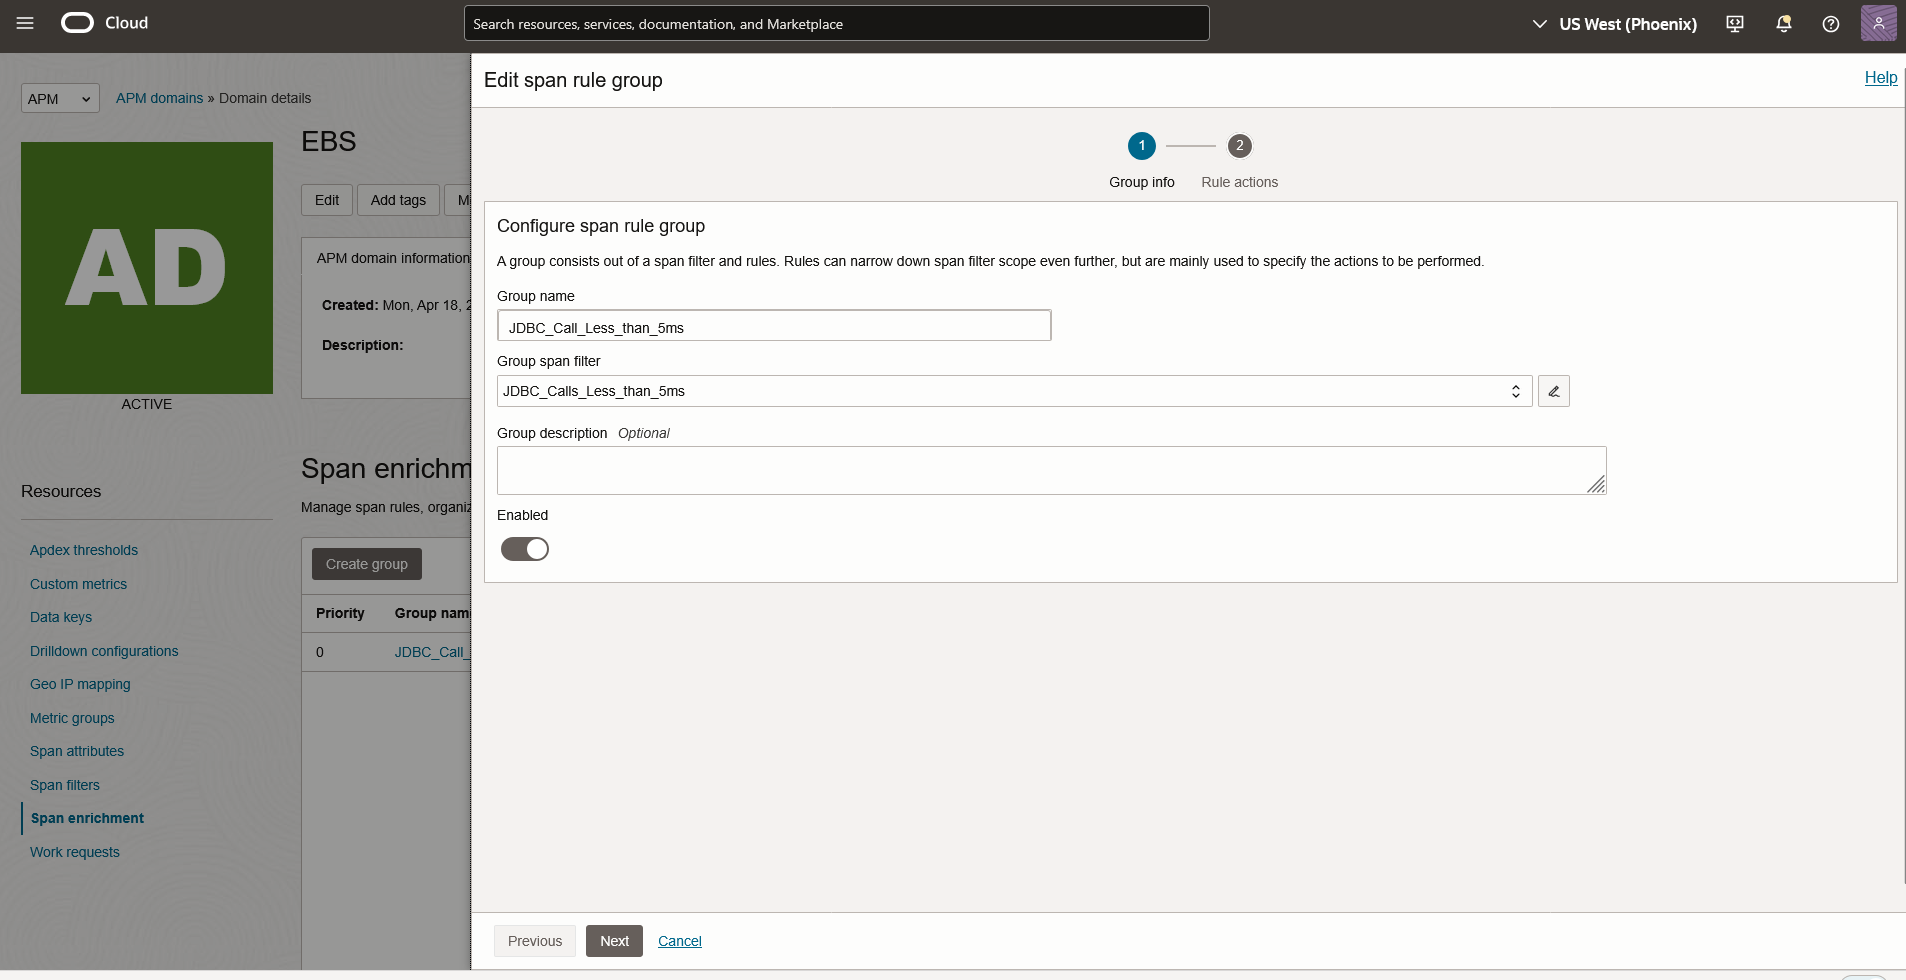
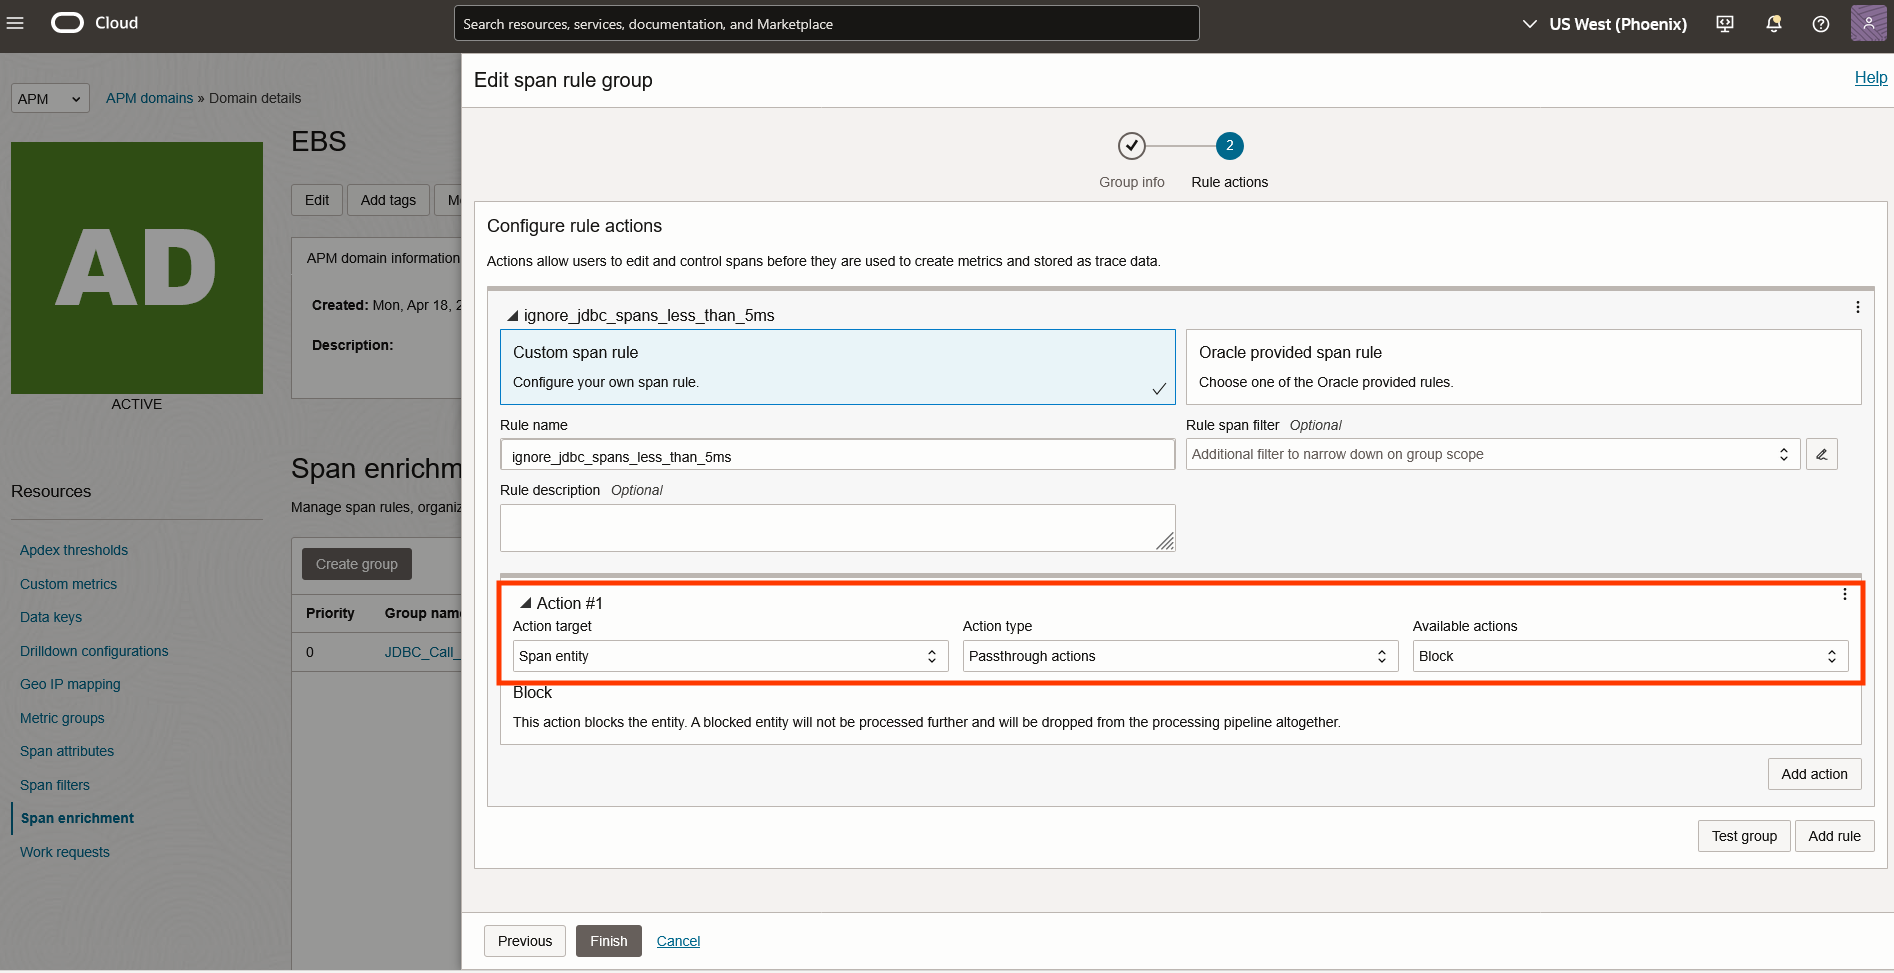
Create Filters to optimize Event collection and retention
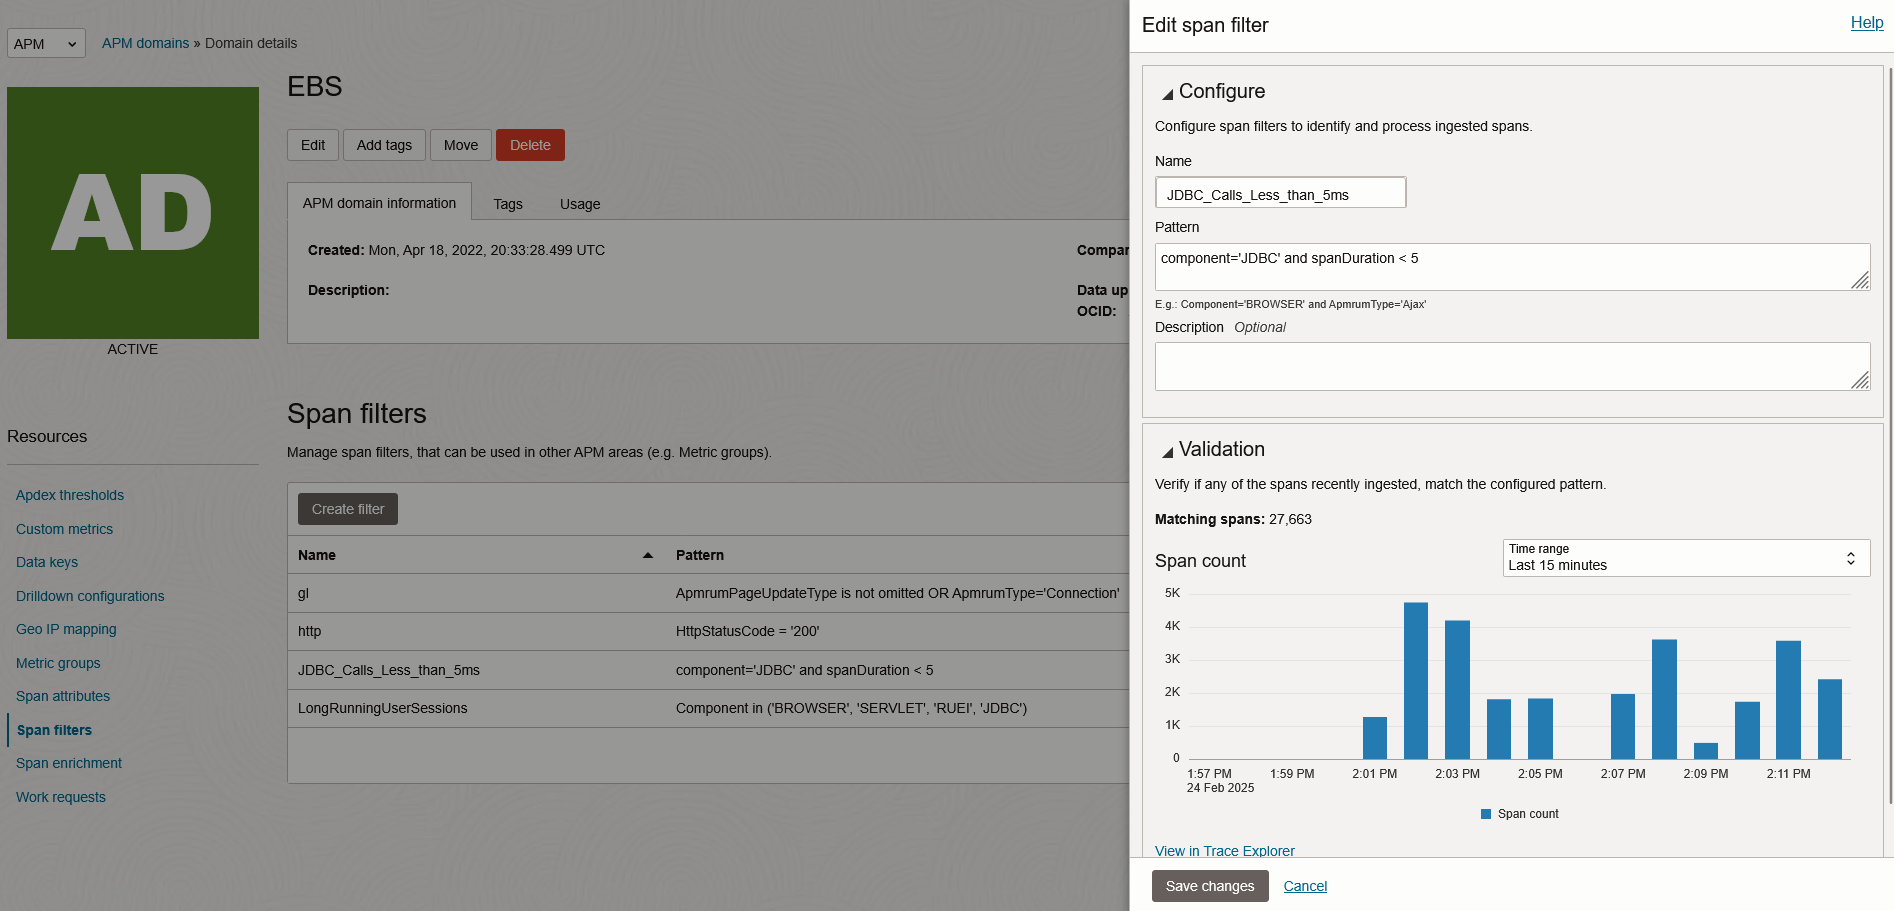
Once the spans that can be filtered are identified, create Filters in APM Administration.
After the Span Enrichment is enabled, revisit the APM Events Dashboard and compare the difference in spans from the previous data set.
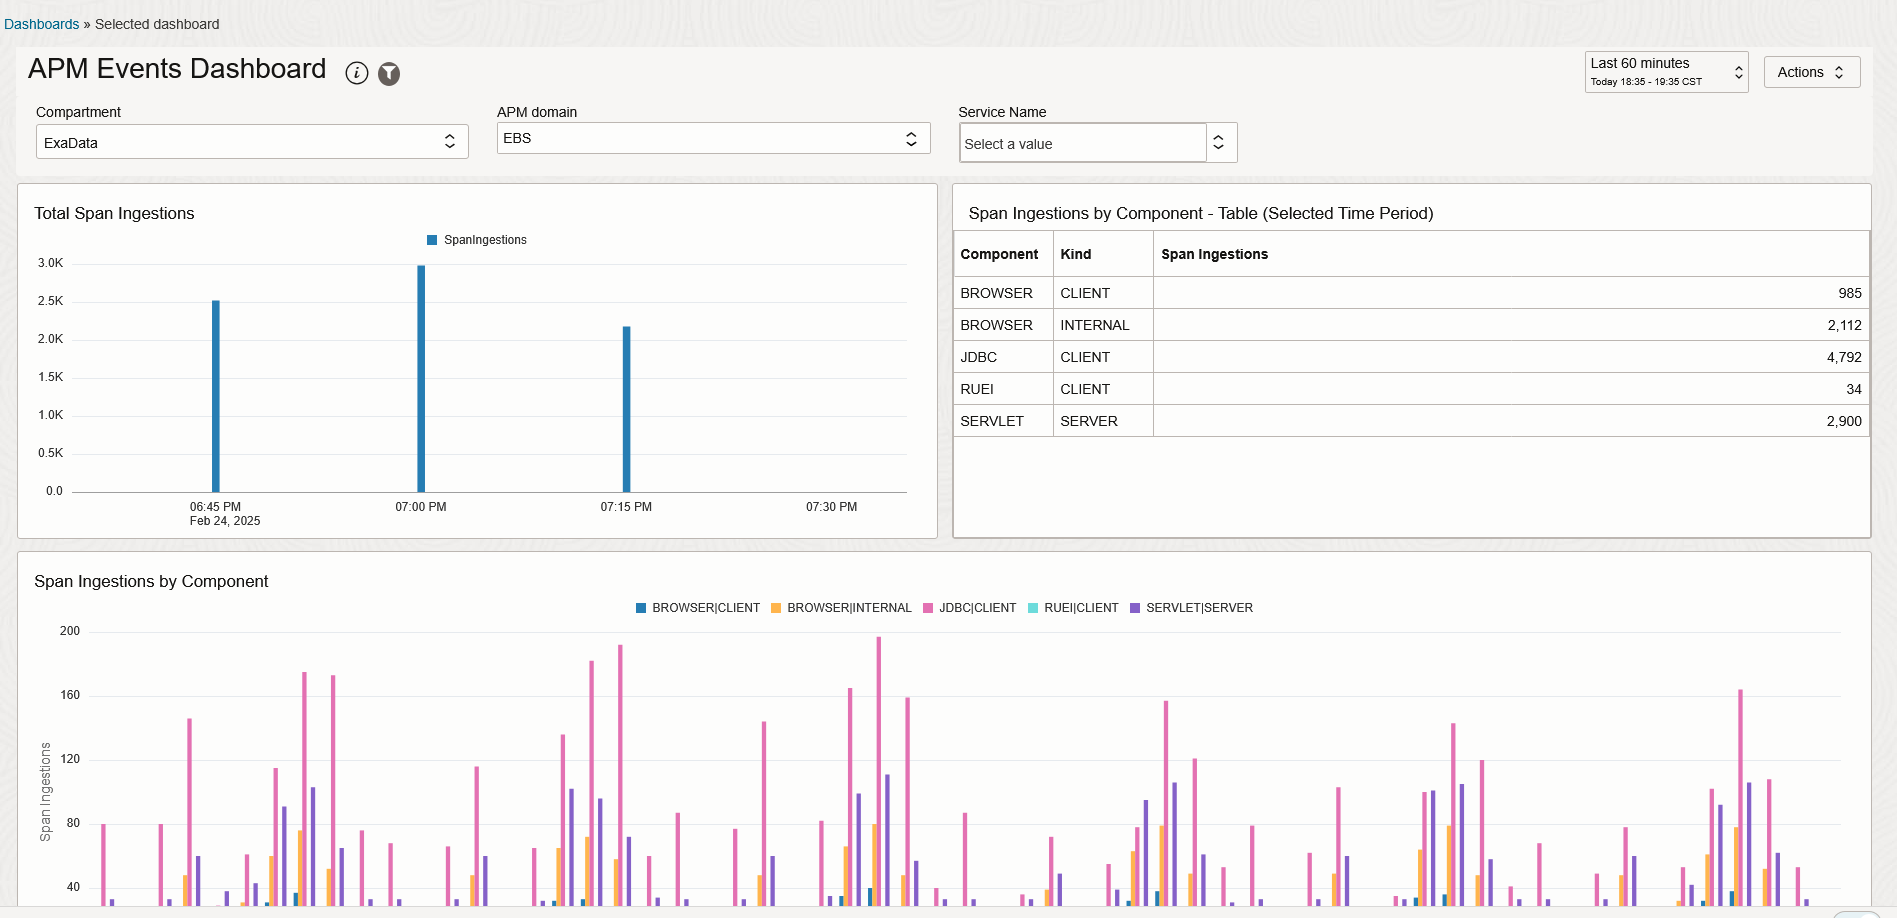
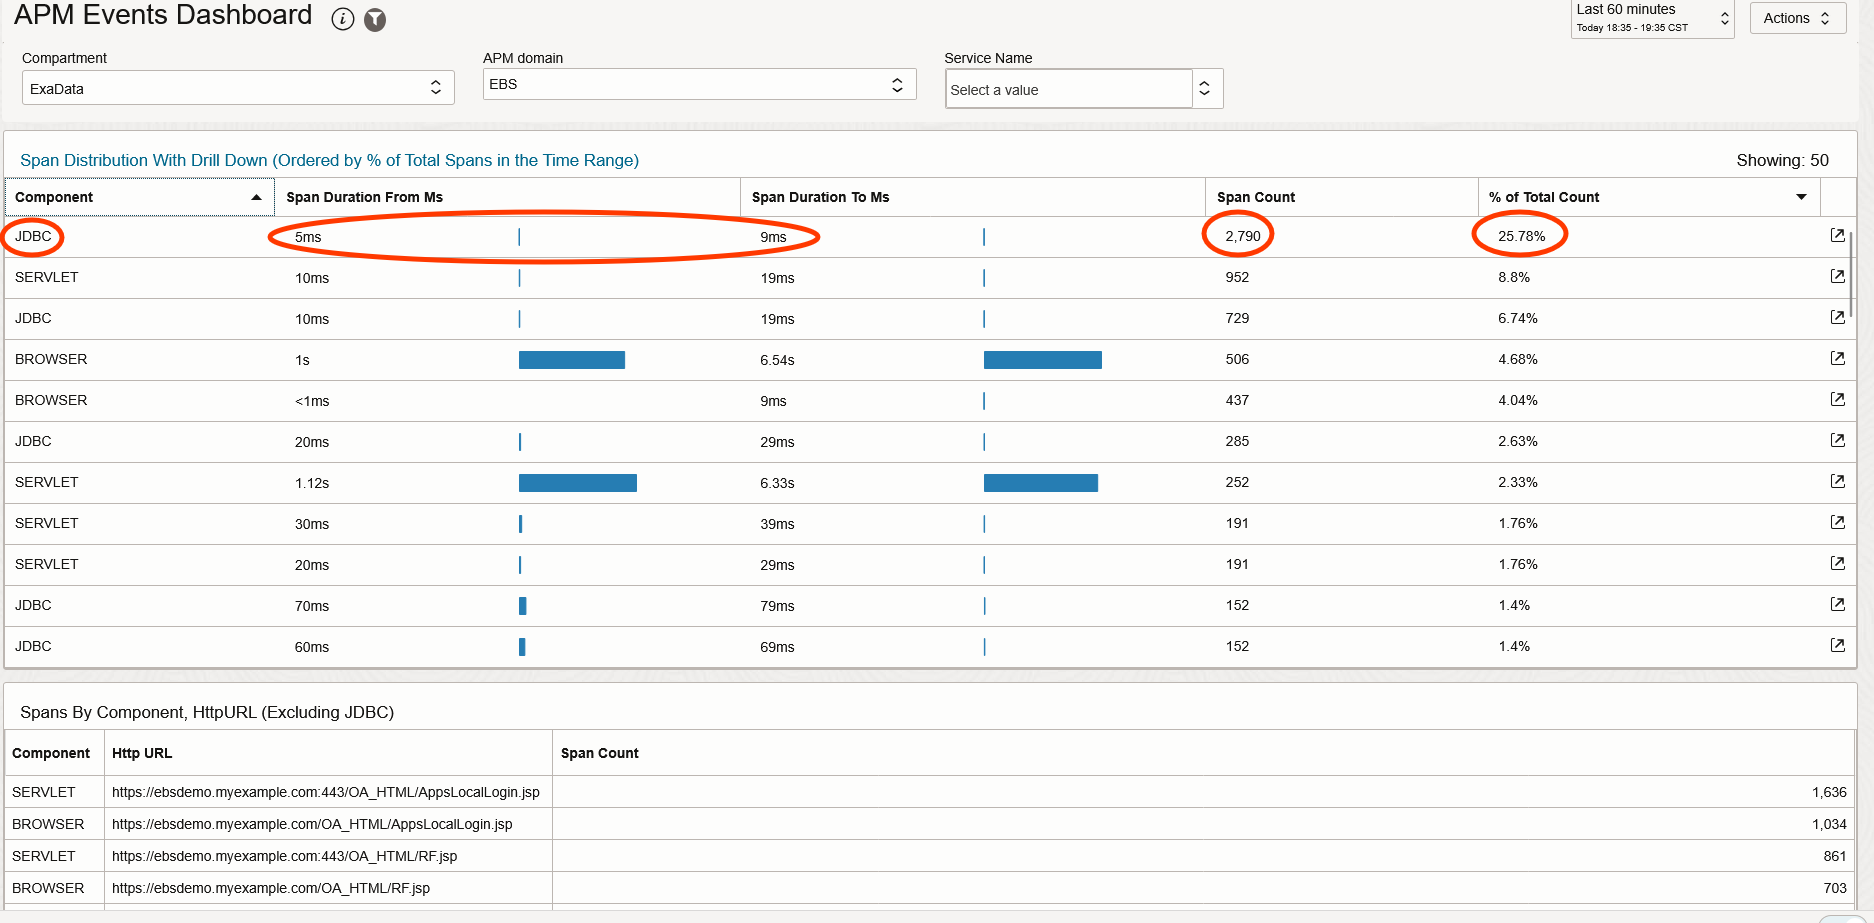
The span count for JDBC calls has dropped from 10151 to 4792 and the span distribution shows there are no JDBC spans below 5ms, there has been a reduction in from 8401 spans to 2790 which is 66% change in span count.
This cost savings will be reflected in the APM Service Cost immediately. If there is a need to view all spans when troubleshooting a business flow where you will need the entire data set, you can disable the Span Enrichment and re-enable it once the diagnosis is completed.
There are other options like creating span enrichment using sampling to optimize the APM cost. APM java agent has a Probe Configuration file that also allows setting filters and limits on quantity of events generated. These will be covered in a separate blog.
Event Monitoring Alerts
Monitoring the Event Metrics and setting up Alarms for alerting abnormal usage is a recommended approach.
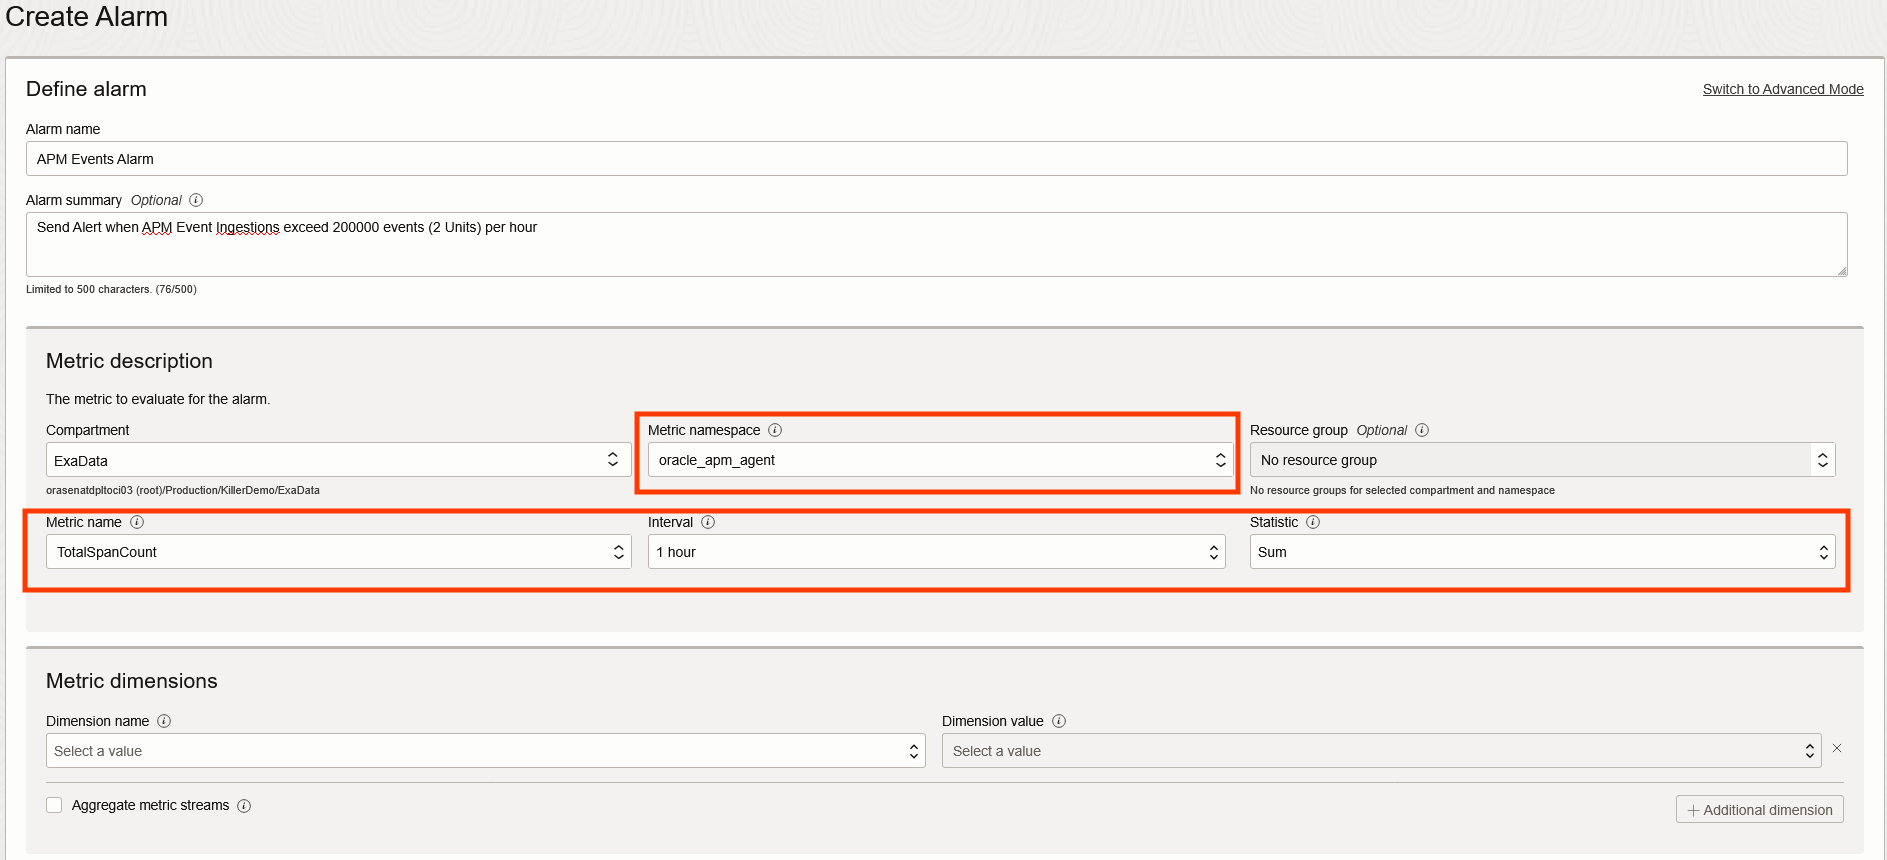
The APM metrics are available from the namespace : oracle_apm_agent
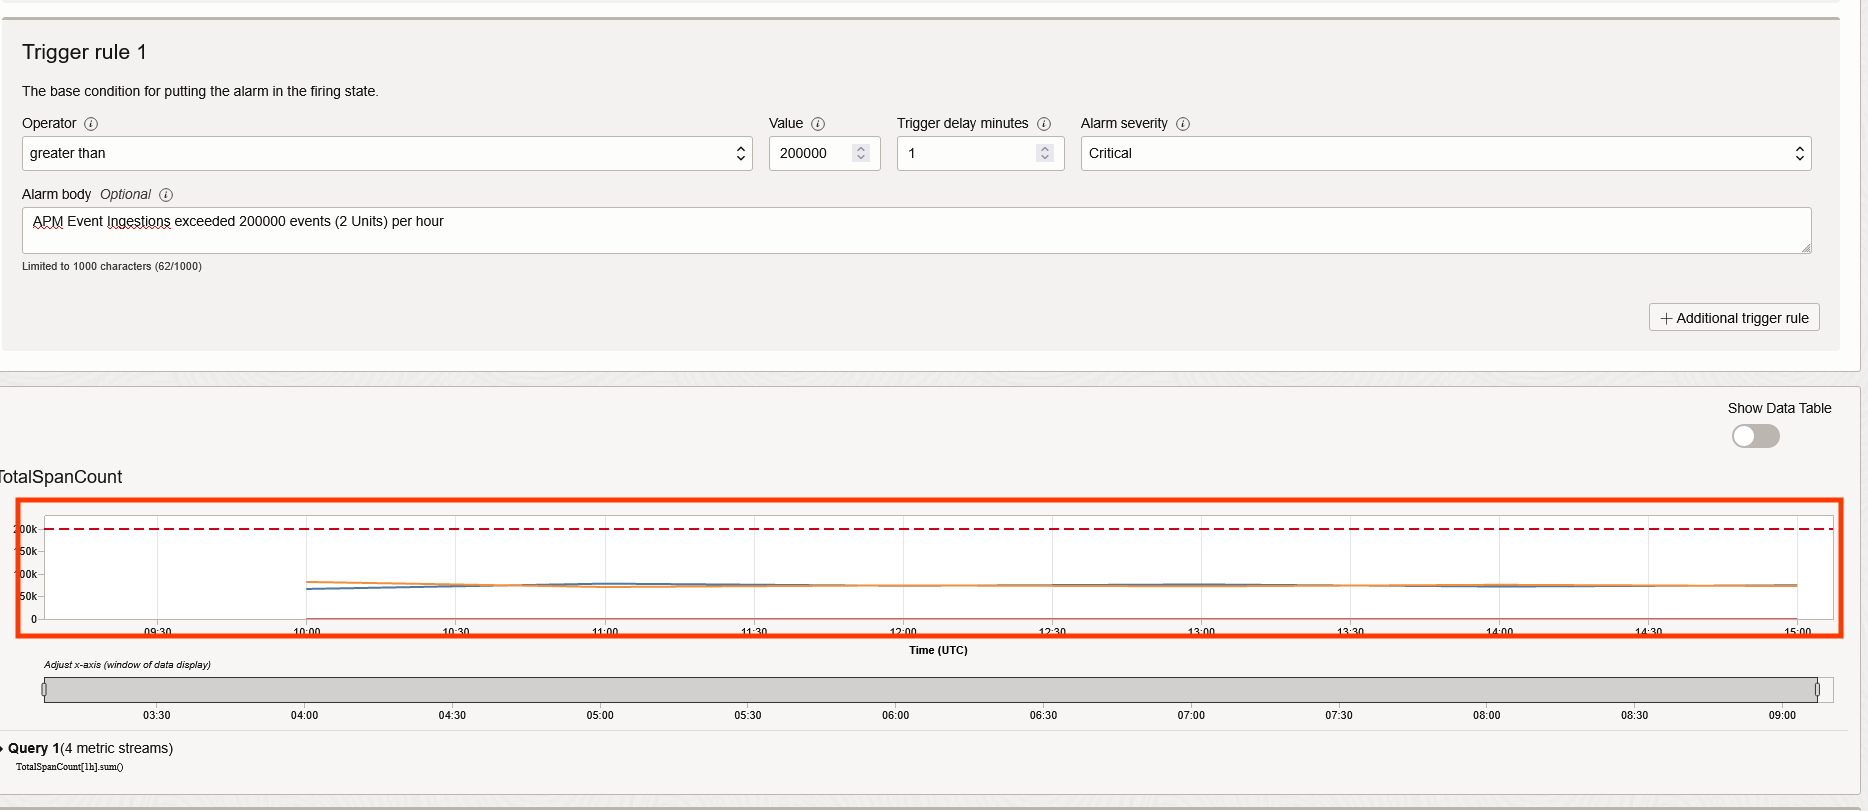
Observing the peak usage for the metric TotalSpanCount over a few workdays helps identify the maximum span count generated during normal use of the Application. You can now create an alarm to get notified when the metric breaks the threshold. This can be due to an exception or a change in application usage.
You should regularly check the APM Event Dashboard to identify categories that are causing a spike in spans and determine if new span enrichments should be added.
Budget Alerts
OCI Billing & Cost Management allows you to set up Alerts based on Budgets. You can set up alerts to notify you when your APM spending exceeds a threshold.
Resources and References
APM Home Page: APM Home
OCI Pricing Information: OCI Pricing
Download APM Events Dashboard: APM Events Dashboard