Virtual Cloud Network (VCN) Flow Logs provide a powerful way to monitor network traffic in and out of your VCN subnets. But as your cloud environment grows, so does the volume of logs, making troubleshooting difficult; that’s where filtering comes in. In part one of this series, we’ll explore the following:
- How to access VCN filtering syntax when enabling VCN flow logs.
- Different methods of viewing, filtering, and extracting data.
- A few tips to help you quickly surface the data that matters when troubleshooting.
We’ll cover specific filtering details and techniques in part two. If you’re new to VCN Flow Logs, view my previous blog, which covered VCN Flow Logs and how to enable this feature. The following video also demonstrates what we’ll cover in both blogs:
What is VCN Flow Log Filtering
Flow logs capture metadata about IP traffic flowing in and out of a VCN subnet, specifically to the vNICs located within the subnet. Without filtering, you need to dig through each flow log to find the specific data flow you want. With filters, you can target the exact subnet communication stream based on IP address, protocol, and port. OCI lets you view and customize the filters in myriad ways, which we’ll review below.
Accessing VCN Flow Log Filtering Settings
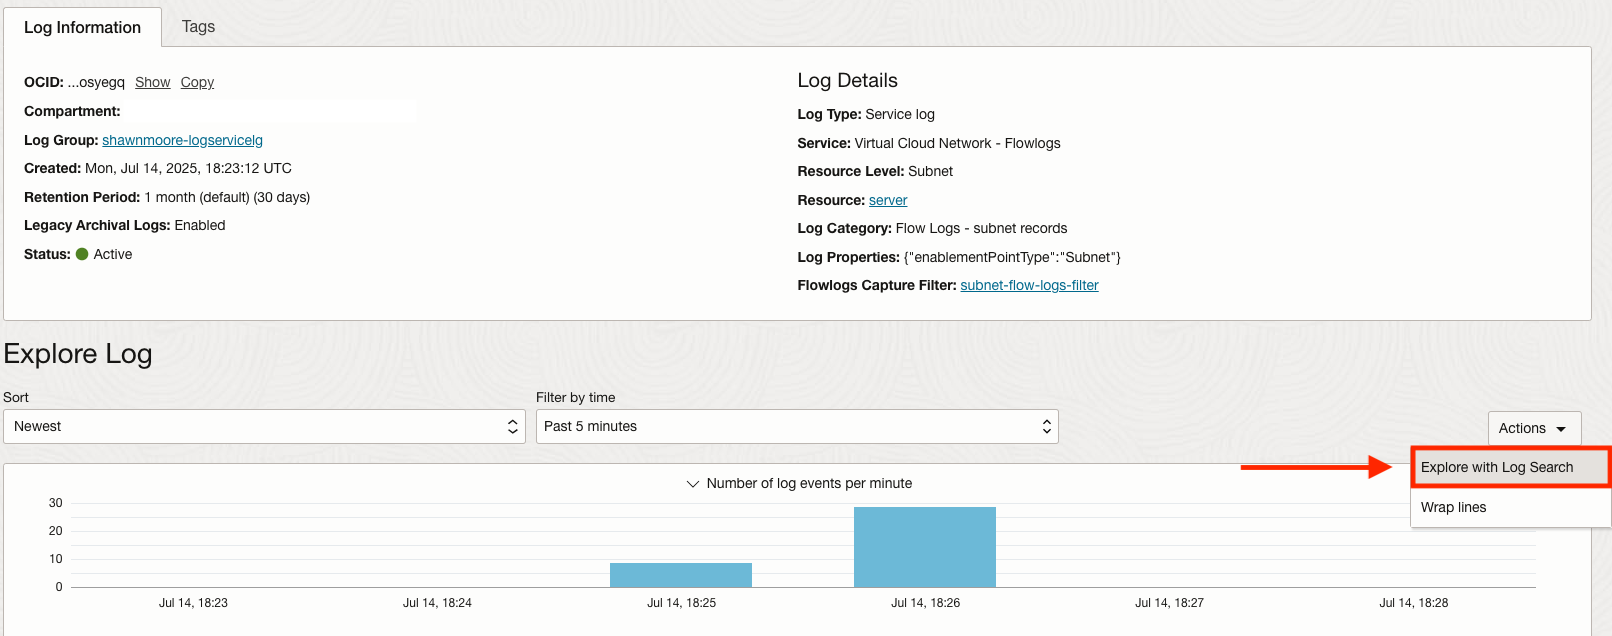
Once a Flow Log session is established, data can be filtered by selecting the right Actions dropdown and clicking Explore with Log Search:
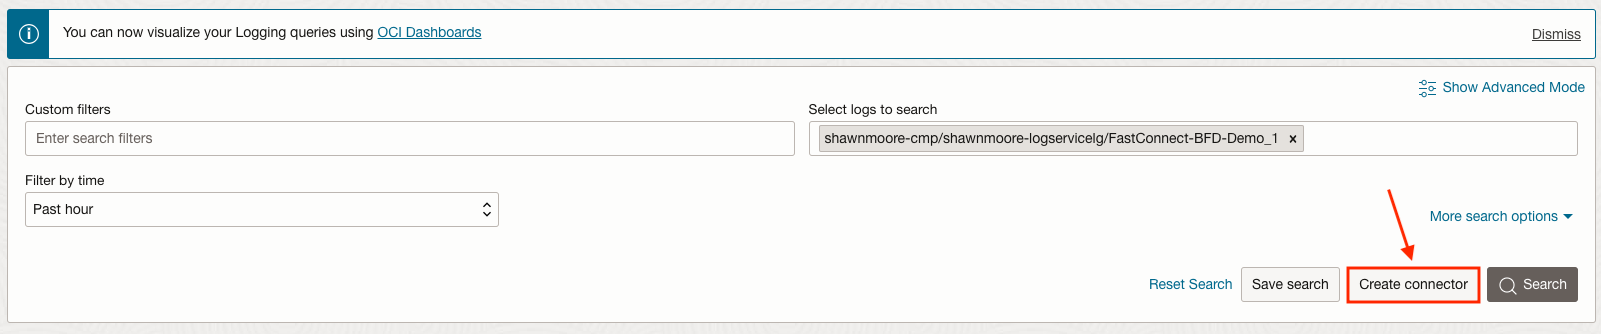
At the top of the Log Search page is where you’ll enter in custom search filters, specify how far back in history to run the filter, and specify the logs to search. I want to highlight two areas, the first is the Advanced Mode:

While not a part of this blog series, if you need to execute more in-depth filtering techniques, Advanced Mode allows you to filter with operators, expressions, and sorting methods. Additional details can be found here.

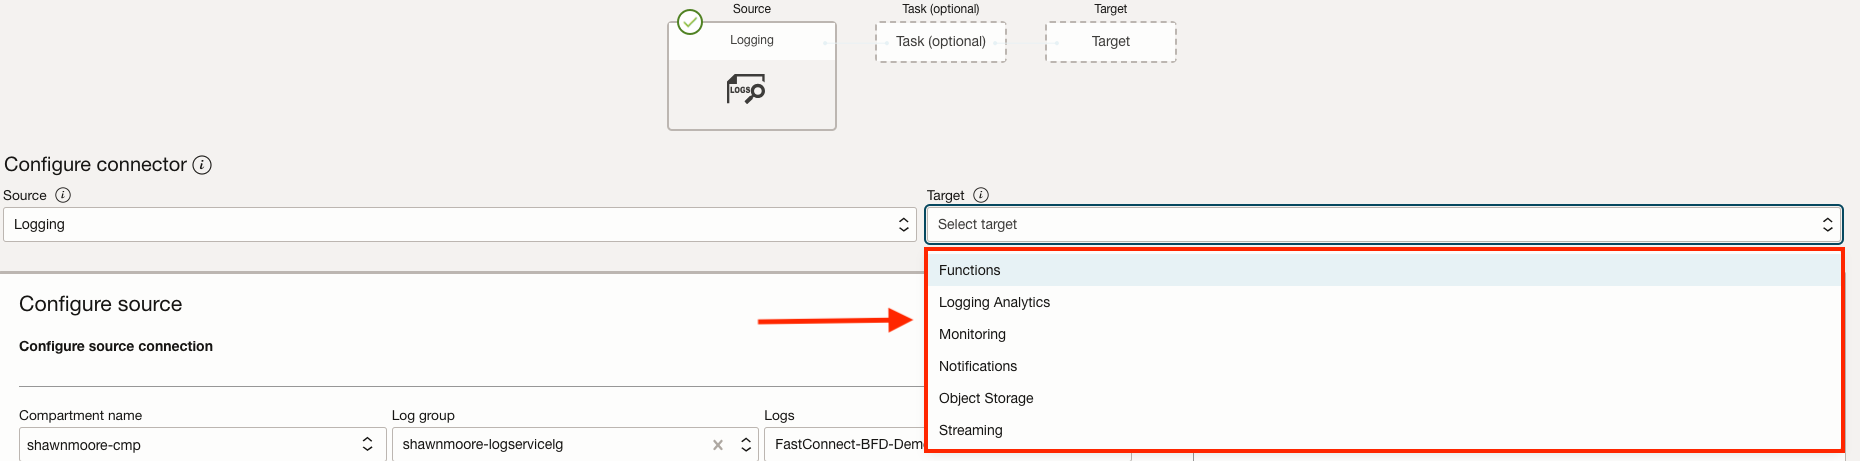
The second area is the Create connector option. This button allows you to export log data to an external service such as Logging Analytics or OCI notifications service. Which can be used to send alerts if specific criteria are met in the log data.
Optimizing VCN Flow Log Filtering Settings
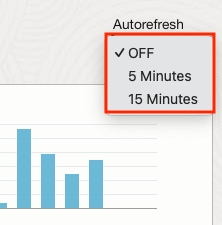
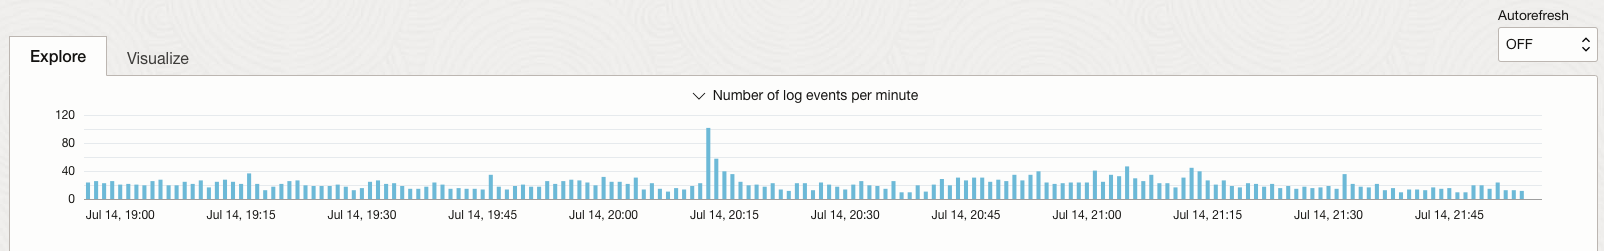
By default, Log search will contain static log data from when you accessed the page and the past 5 minutes. The historical data to filter can be adjusted with the filter by a time drop-down. You can also gather the latest log data by refreshing your browser’s page or auto-refreshing with the right Autorefresh drop-down.
Moving down the page, you’ll notice a visible chart for any logs captured for the time period. This chart has two tabs: the default is Explore mode, and the other is Visualize mode. Explore simply shows the log events captured within a one-minute time interval:
Visualize mode allows you to adjust how the filtered data is presented. Such as changing from a bar graph to a pie chart and grouping by a specific attribute:

For example, you can set the graph to only present the number of times destination TCP port 22 generated a log event within a 30-minute interval:

Filtered VCN Flow Log Events
Below the chart is the detailed log events shown in sequence, starting with the latest log event and descending in time based on the timeframe selected. Each event log has a drop-down on the right side that will provide granular details about the specific event. We will cover this in part 2 of this blog series.

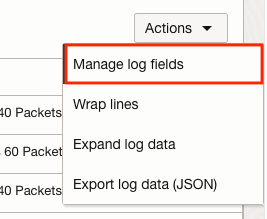
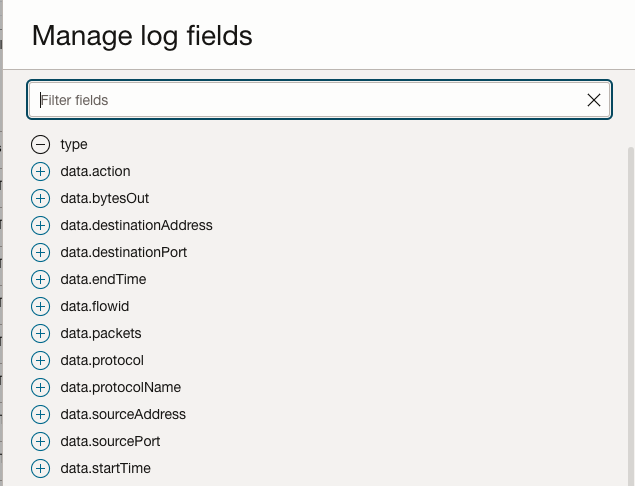
This table can be modified to present different data by selecting the Action button directly below the bottom right of the chart.
Conclusion
This covers the majority of adjustments and options to be aware of when filtering on VCN Flow Logs. I find this helpful for understanding the flexibility and power when searching for specific Flow log data. Especially where time is of the essence when troubleshooting, in part two, we’ll cover filtering patterns and adjustments to help you quickly uncover the correct data you’re looking for. Hope to see you there!