Introduction
In my previous post, I discussed how to integrate OCI Streaming service with Azure Sentinel. Many customer use Sentinel as their enterprise SIEM/CSPM platform. You can also use OCI Logging Analytics service and configure the Security Fundamentals Dashboard for security/networking specific analysis. Another option that is gaining traction is integrating OCI Streaming with OCI OpenSearch Service. OpenSearch is an open source, enterprise-grade search and observability suite. With OpenSearch you can visualize your data in real-time. OpenSearch allows you to create a Data Prepper or Pipeline to ingest data from a source like OCI Streaming Service.
This will be the topic of my post today; I will be detailing how to integrated OCI Streaming with OCI OpenSearch. Specifically, streaming the OCI Audit logs to OpenSearch. OpenSearch is being used as an ‘Audit Analyzer.’
Let’s begin with high-level s teps:
- Configure OCI Logging with OCI Streaming Service.
- Create an Open Search cluster in OCI.
- Create Configure an compute node to access the cluster.
- Create a pipeline in. the cluster to access the stream.
- Access the Open Search portal.
Details
Configure OCI Logging with OCI Streaming Service
Setting up the OCI Logging Service with OCI Streaming is out of scope for this article as there are many great resources that cover this topic. Here are a few links to get you started:
- Integrate OCI Streaming with Microsoft Sentinel new (Preview) Module
- From Oracle documentation: Ingest Custom Logs from OCI Streaming Service Using Service Connector
Once the service connector is configured to send logs to stream, make sure you can download the ‘Recent messages’ from the stream as shown below:
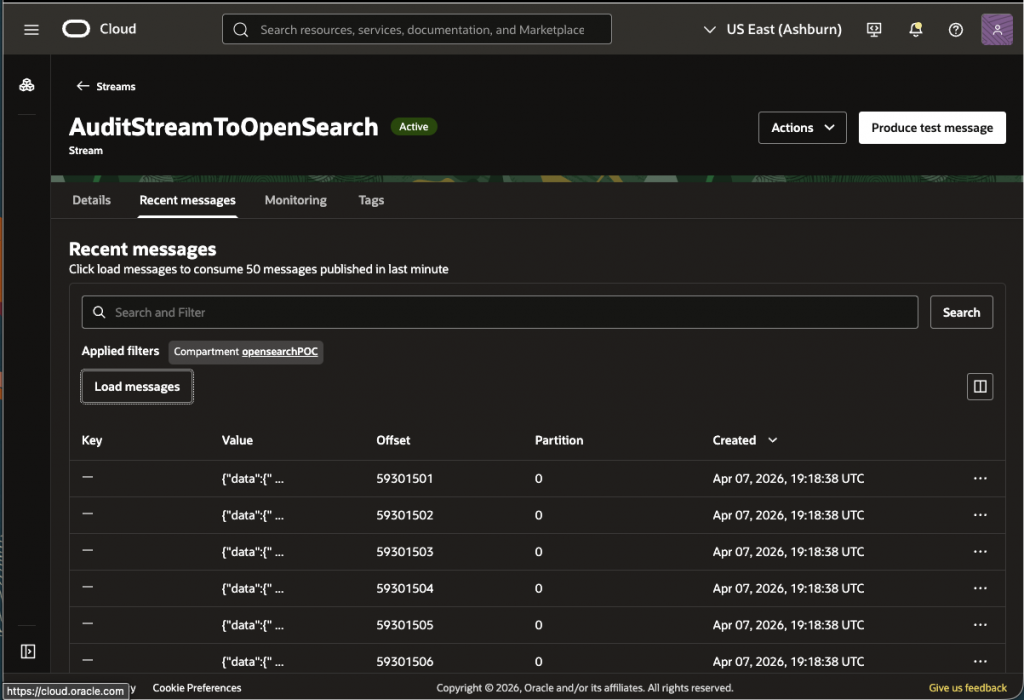
Do not proceed until data is being sent to the stream.
Create an Open Search cluster in OCI
Now let us create the cluster. In the console’s hamburger menu search for ‘opensearch’ and select Clusters->Create cluster.
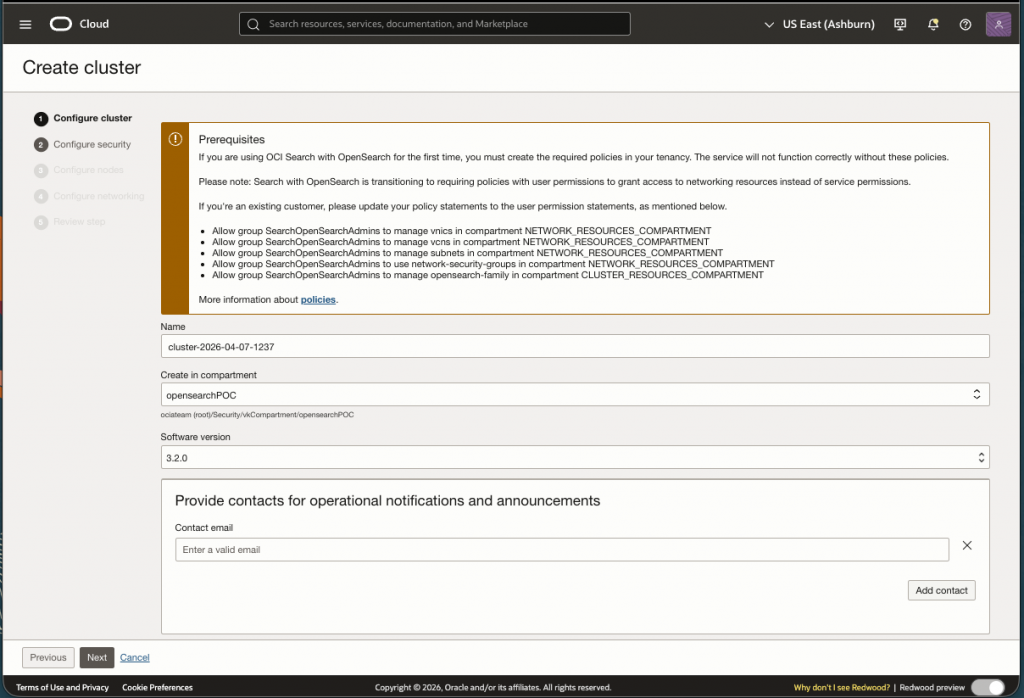
Don’t forget to setup the IAM Policies as described on this initial page.
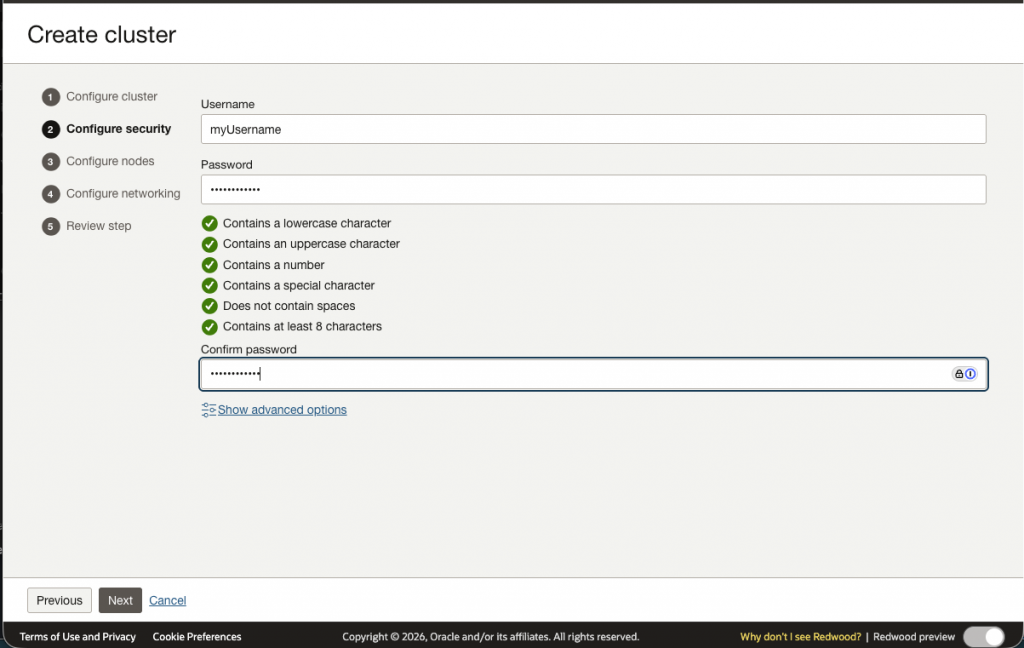
Now we will need to setup a User Name and Password. This is used to access the cluster on the command line as well as access to the Open Search Portal.
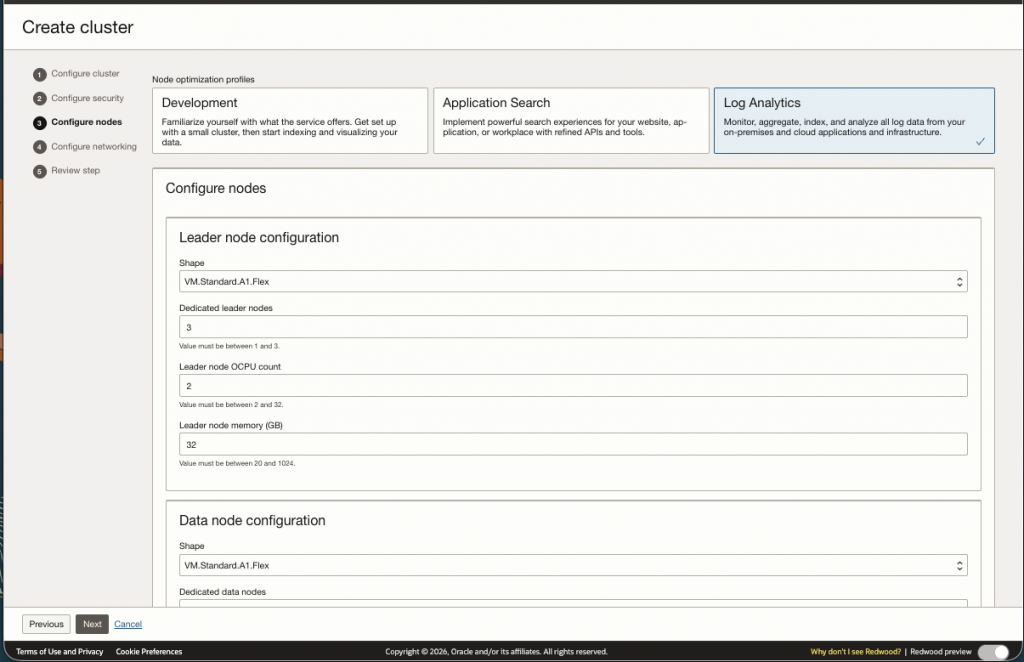
For this use case, deploying a Development or Application cluster will not suffice (See screen shot below). The Development/Application cluster will not scale to handle logs coming from the OCI Audit Logs as there is to much data. In this case, you must select the Log Analytics cluster and size the cluster appropriately.
Sizing a cluster can be challenging. In order to do this you must first figure out how much data is being sent to your audit logs. On our test environment I calculated 44 GB a day. This was a rough calculation on the average size of each record multiplied by the number of records per day. Based on this number you can use this sizing document to help you size your nodes.
My determination of the appropriate sizing for my cluster is out of scope for this post; however, I provided my final configuration below.
There are three types of nodes in OpenSearch:
- Leader Nodes ( or Cluster Management Nodes)
- Specialized nodes responsible for the management and stability of the cluster.
- Sizing Info: 3 nodes, 8 GB Memory and 4 OCPU
- Data Nodes
- Stores data and process search/indexing queries
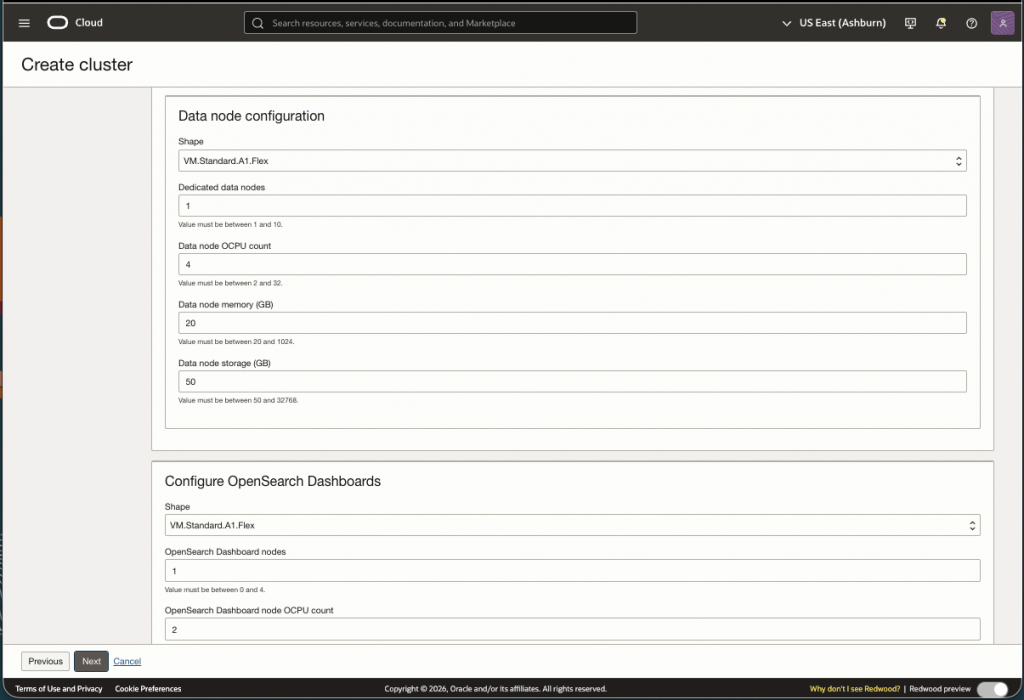
- Sizing Info: 2 nodes, 12 OCPU, 16 GB Memory and 1024 GB storage
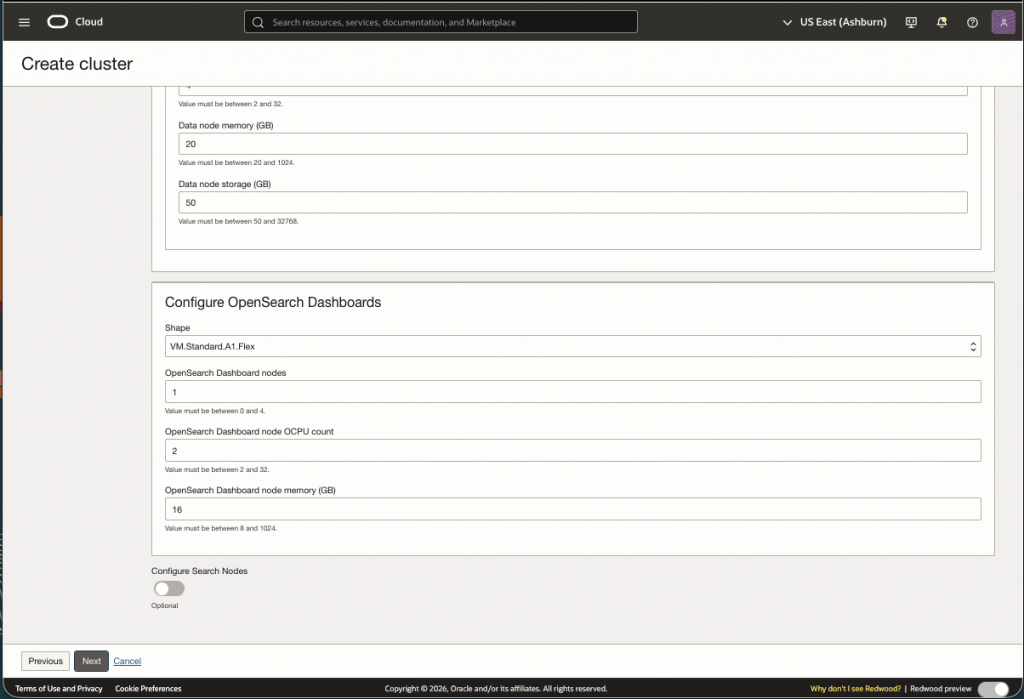
- Dashboard Nodes
- Nodes for accessing the Dashboard on the Portal
- Sizing Info: 3 nodes, 2 OCPU, 16 GB Memory
Screen shots below have the default values for the cluster. Replace these values with what you determined using the sizing document or you can use my assessment above to test with. Note that after the cluster is created you have the ability to ‘Resize’ as needed.
Now you will need to setup the networking. You can use an existing VCN/Subnets or create a new one:
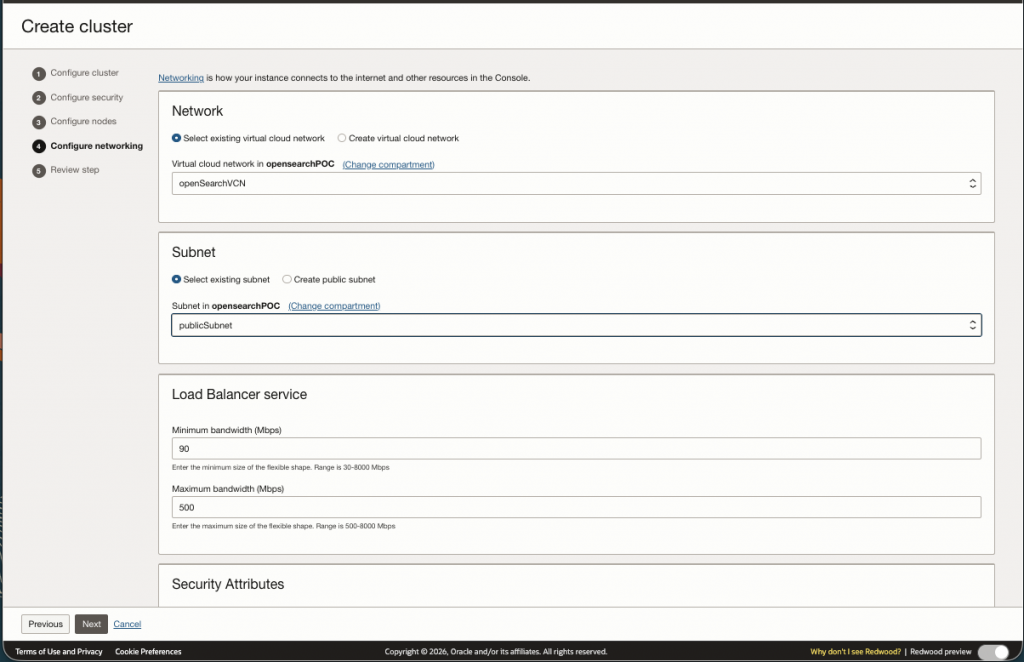
Review the configuration and create the cluster.
I have provided my cluster details page as a reference:
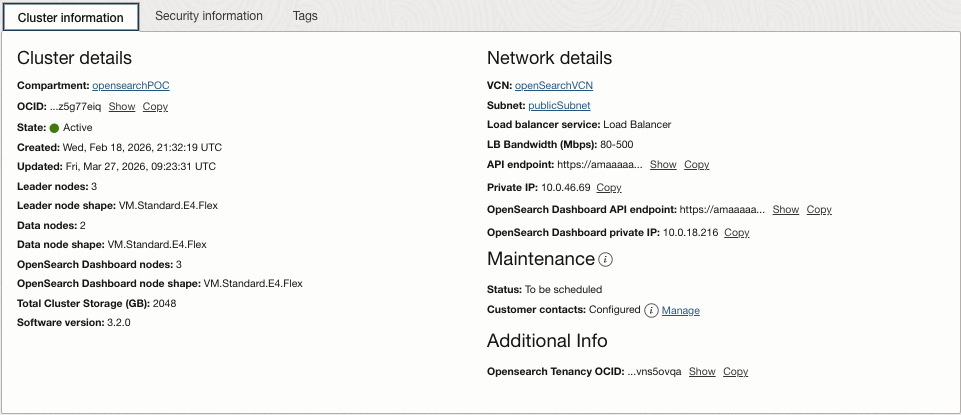
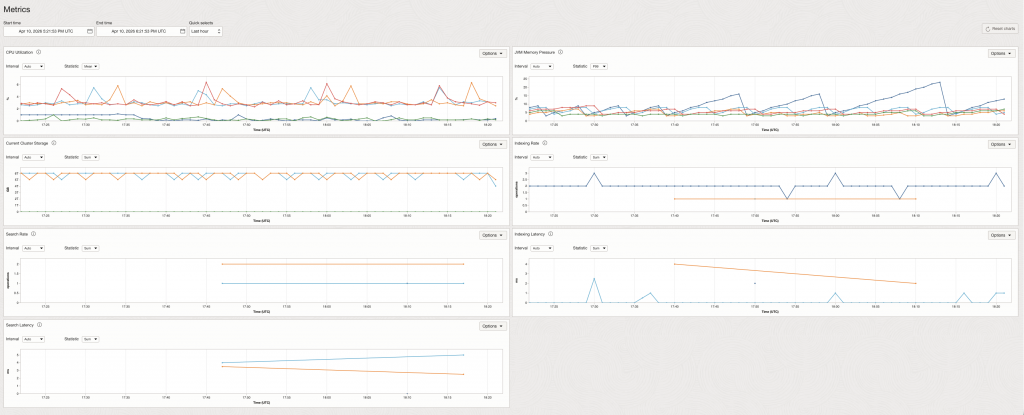
Again, OCI OpenSearch allows you to resize vertically or horizontally, so do not worry to much if you don’t get it quite right when creating the cluster. You can evaluate how your cluster is running via the metrics page:
Create/Configure an compute node to access the cluster
Once the cluster is created successfully, we need a way to access the cluster. One method is to create an VM instance in the same public subnet within the same VCN. This will allow you access and update the cluster via CURL commands.
High-Level Steps:
- Create a security list for ingress 9200 and 5601
- Created a VM to test prerequisites are working
- SSH into the VM you created
- Test with curl command to verify setup is working
Step 1 – Create a security list for ingress 9200 and 5601
First we need to setup a security list for open search ports 9200 and 5601. This will allow traffic to the cluster from the VM. The instructions can be followed here.
Step 2 – Created a VM to test prerequisites are working
I will not detail how to create a VM instance in OCI; however,use this documentation to create and setup a compute node. Creating a compute node is optional, but my preferred way to test and communicate to the cluster.
Step 3 – SSH into the VM you created
To ssh into your new VM use the private key to access the VM as such:
ssh -i <PATH/myPrivateKeyFile> opc@<publicIPofVM>Step 4 – Test with curl command to verify setup is working
To test the cluster lets do a curl command on the API endpoint. Use the username andp assword you used when creating the cluster”
curl -u <MyUserName:<MyPassword> https://amaaaaaac3adhh.....opensearch.us-ashburn-1.oci.oraclecloud.com:9200The. output should look something like this:
{
  "name" : "opensearch-master-1",
  "cluster_name" : "amaaaaaac3adhhqa2if...",
  "cluster_uuid" : "DjfL59GNT...",
  "version" : {
    "distribution" : "opensearch",
    "number" : "3.2.0",
    "build_type" : "tar",
    "build_hash" : "unknown",
    "build_date" : "2025-11-05T07:12:07.984120060Z",
    "build_snapshot" : false,
    "lucene_version" : "10.2.2",
    "minimum_wire_compatibility_version" : "2.19.0",
    "minimum_index_compatibility_version" : "2.0.0"
  },
  "tagline" : "The OpenSearch Project: https://opensearch.org/"}
This established that the cluster is running
Here is the parent documentation for the links above for context.
Create a pipeline in the cluster to access the stream.
A pre-requisite to configure a pipeline is to configure the OCI Vault with two Secrets that contains the username and password you configured when creating the cluster. Please note down the OCIDs of the two secrets as this will be used in the steps below.
In order for the service to access the secrets we will need the following IAM policy statements:
Allow any-user to read secret-bundles in compartment <compartment> WHERE ALL {request.principal.type='opensearchpipeline', target.secret.id = '<target-username-ocid>' }'}Allow any-user to read secrets in compartment <compartment> WHERE ALL {request.principal.type='opensearchpipeline', target.secret.id = '<target-password-ocid>'}More details are found here.
Once the pre-requisites are met we ca now create the pipeline that will consume the stream we configured in step 1.
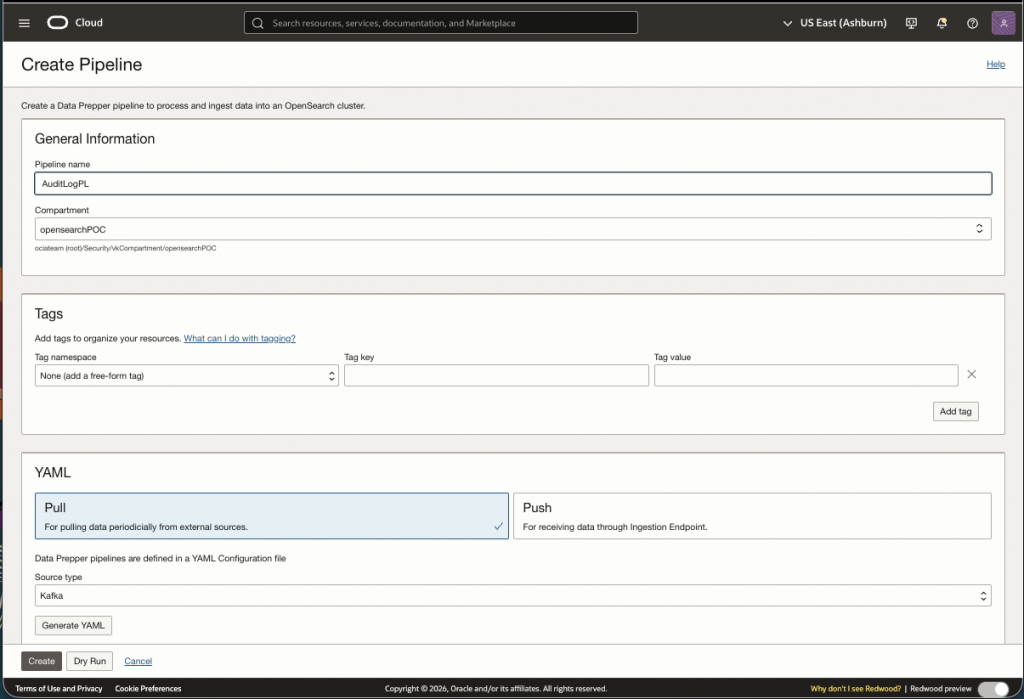
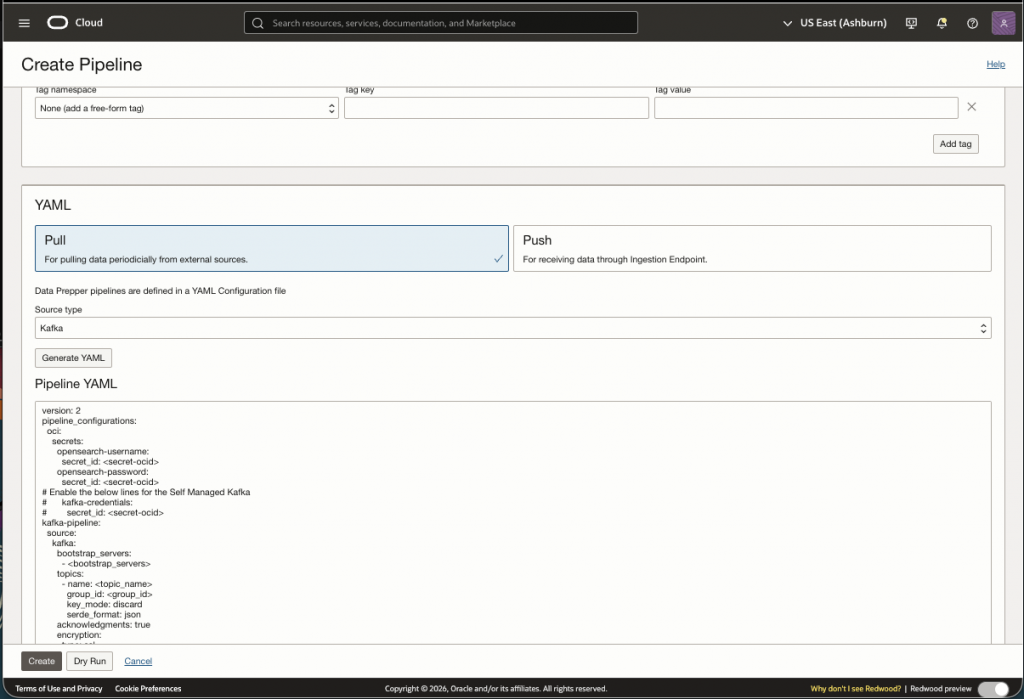
Since we are using the stream to consume data, we select ‘Pull’ and select ‘Kafka’ in the dropdown. When Generating YAML you will see the following default file:
version: 2
pipeline_configurations:
  oci:
    secrets:
      opensearch-username:
        secret_id: <secret-ocid>
      opensearch-password:
        secret_id: <secret-ocid>
# Enable the below lines for the Self Managed Kafka
#      kafka-credentials:
#        secret_id: <secret-ocid>
kafka-pipeline:
  source:
    kafka:
      bootstrap_servers:
        - <bootstrap_servers>
      topics:
        - name: <topic_name>
          group_id: <group_id>
          key_mode: discard
          serde_format: json
      acknowledgments: true
      encryption:
        type: ssl
        insecure: false
# Add your certificate for Self Managed Kafka
#        certificate: <add-your-trust-store-certificate>
      authentication:
        sasl:
# Enable the below lines for OCI Streaming Service
#          oci:
#            stream_pool_id: <target-stream-pool-ocid>
# Enable the below lines for Self Managed Kafka
#          plaintext:
#            username: ${{oci_secrets:kafka-credentials:username}}
#            password: ${{oci_secrets:kafka-credentials:password}}
  sink:
    - opensearch:
        hosts: [ <cluster-ocid> ]
        username: ${{oci_secrets:opensearch-username}}
        password: ${{oci_secrets:opensearch-password}}
        insecure: false
        index: <index-name>
The attributes in bold are required to configure the pipeline with OCI Streaming. Let’s go through these attributes:
- secret_id: <secret-ocid>
- Enter the secret OCIDs for the user name and password. The secret values should match the username and password you configured in the cluster.
- <bootstrap_servers>
- This URL can be found in the Kafka Connection Settings under the StreamPool
- name: <topic_name>
- This is the name of the Stream you created.
- group_id: <group_id>
- Any name (e.g AuditGroup)
- stream_pool_id: <target-stream-pool-ocid>
- OCID of the stream pool
- hosts: [ <cluster-ocid> ]
- You can find this on the cluster details page
- index: <index-name>
- A name (e.g. textindex). All lower case.
Once the YAML file is complete, click ‘Dry Run’ to validate the YAML file. If there are any errors please correct before creating the pipeline.
Troubleshooting tips:
You may encounter a ‘Failed’ error message either during creation or after sometime. If so, it is likely you will need to change a parameter to the YAML file or the cluster configuration respectively.
Double check your YAML file and avoid using special characters and uppercase in names.
As far as the cluster is concerned, in order to handle the amount of data we expect from the audit logs we need to increase a field limit value in the cluster.
In OCI OpenSearch the default attribute limit(1000) will not suffice for our Audit Analyzer use case. I had to increase the limit from 1000 to 5000. Now this may seem excessive so we need to make sure our cluster can handle the indexing load. However, you can also filter audit records going to the cluster. See the documentation from OpenSearch here..
To change the attribute limit we are going to run another curl command on our instance, a POST command:
curl -X PUT "https://amaaaaaac3adhhqa2ifzd....opensearch.us-ashburn-1.oci.oraclecloud.com:9200/testindex/_settings" \
  -H "Content-Type: application/json" \
  -u "vinayk:Mansu67!" \
  -d '{
    "index": {
      "mapping": {
        "total_fields": {
          "limit": 5000
        }
      }
    }
  }'
Notice the URI (/testindex). This is the index name I used in the YAML file.
Again while ssh’ed into the box, let’s verify the change was made:
curl -X GET "https://amaaaaaac3adhhqa2ifzd7sqkkwzi3m....opensearch.us-ashburn-1.oci.oraclecloud.com:9200/testindex/_settings?filter_path=*.settings.index.mapping.total_fields.limit" -u "<MyUserName>:<MyPassword>"
The output::
{"testindex":{"settings":{"index":{"mapping":{"total_fields":{"limit":"5000"}}}}Now we can restart the pipeline.
Access the Open Search portal
As a final step let’s connect to the OpenSearch Portal. We do this by create an ssh tunnel to the compute node we created above. Here is the command you run on your localhost:
ssh -C -v -t -L 127.0.0.1:5601:<OpenSearch_Dashboards_private_IP>:5601 -L 127.0.0.1:9200:<OpenSearch_cluster_private_IP>:9200 opc@<VM_instance_public_IP> -i <private_key_file>Then bring up a browser and goto localhost:5601.
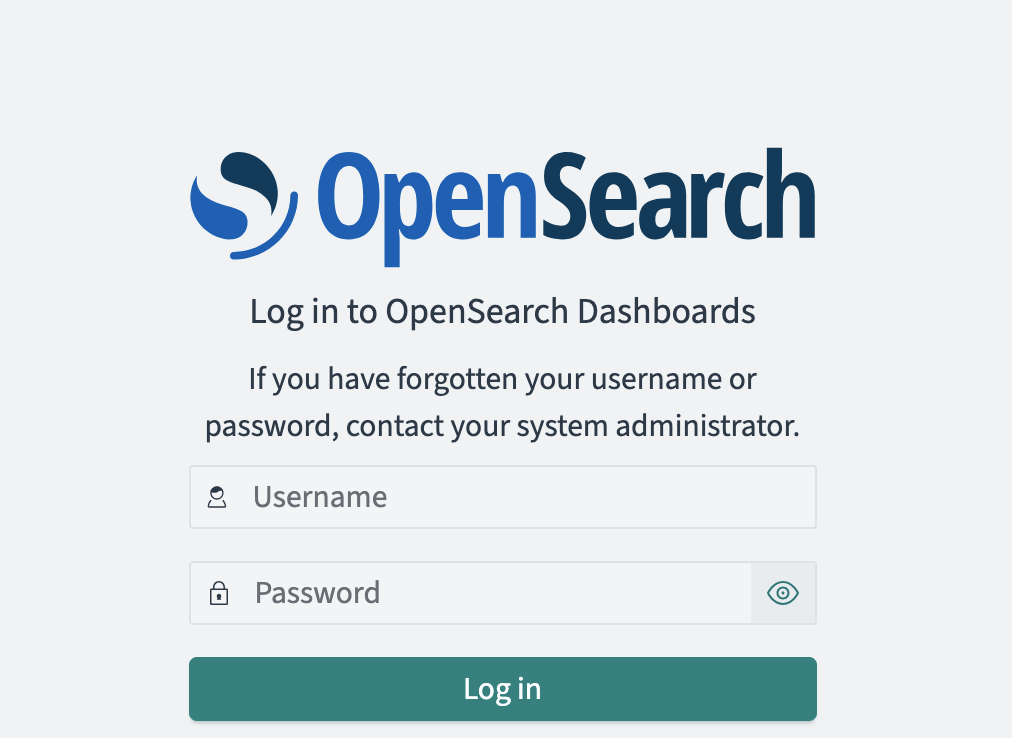
Login with the same username and password you configured on the Security Tab for the cluster.
You made it!
Summary
This post detailed how you can configure a Data Prepper/Pipeline to ingest the Audit logs from a stream. Sending OCI Audit logs requires additional care when configuring the OCI OpenSearch cluster, namely:
- Sizing of the cluster and
- Modifying cluster details (field limit)
Sizing the cluster is an exercise in itself, however. you can use this document to help. Keep in mind that you can resize if needed. OCI OpenSearch provides you with metrics on the cluster to help in determining whether you need to resize of not. Also keep in mind that the pipeline may fail after a period of time; this could be due to the amount of data ingested. Specifically the number of attribute fields may have reached its max value. For this reason, I described how to increase the field limit in the cluster.
Thanks for. reading!