In many enterprise environments, involving legacy systems, custom applications, or multi-cloud architectures—logs are exported in structured formats (e.g., CSV) or as unstructured application log files (e.g., .log) to a cloud object store such as Oracle Cloud Infrastructure (OCI) Object Storage. This export can occur on a scheduled basis or through automated data pipelines. Oracle Cloud Infrastructure Log Analytics enables organizations to ingest, parse, and analyze such externally sourced logs using custom log sources and parsers. This capability extends observability to systems that output logs directly to object storage as their first point of delivery.
In this blog, I’ll walk through a sample use case where two types of logs—structured delimited logs providing order status details, and unstructured application error logs with multi-line stack traces—are ingested into Log Analytics. For the delimited logs, we will create a Delimited Parser, and for the application logs, we will create a Regex Parser with multi-line handling to interpret the data correctly. Once the logs are ingested, we’ll demonstrate how to analyze ingested log data using ML based visualizations such as Cluster, use LoganAI for rapid insights, create widgets, and set up detection rules for edge cases.
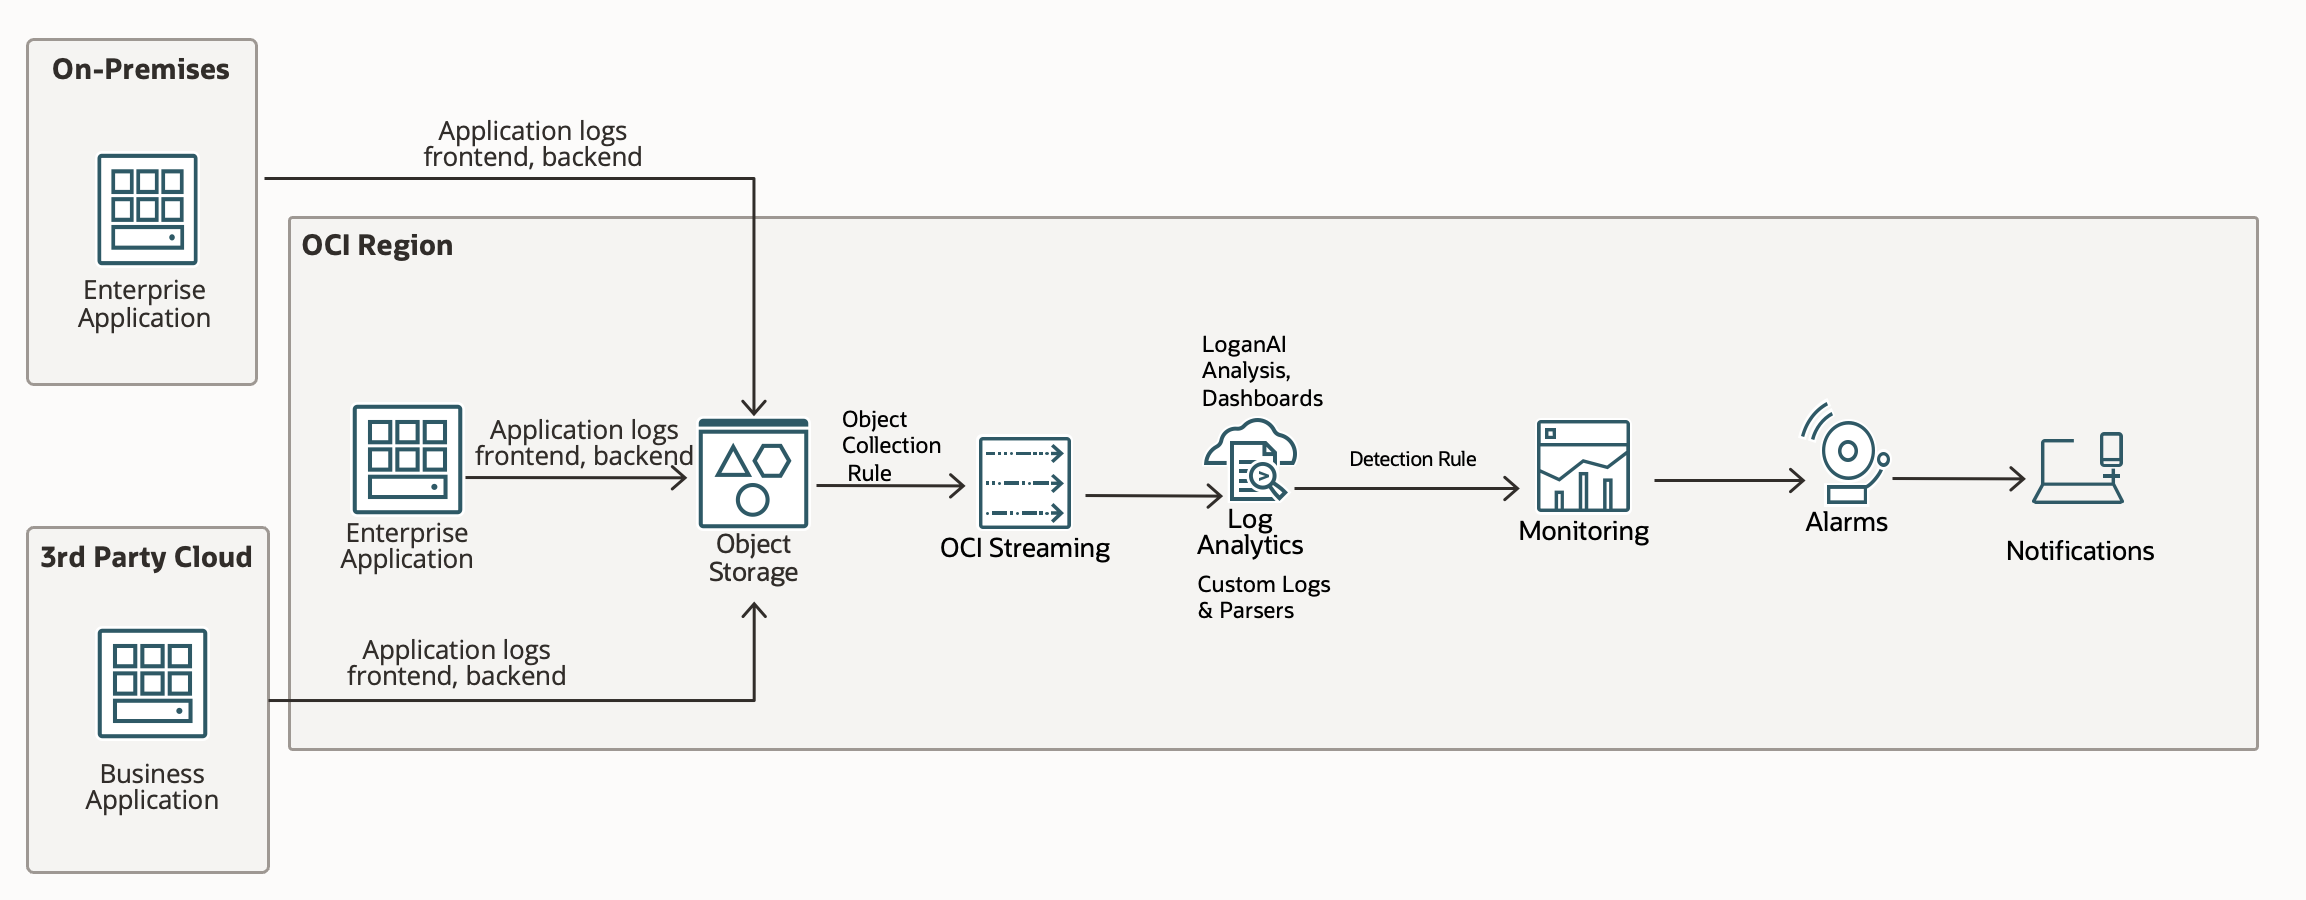
The architecture diagram below illustrates how logs can be ingested from different applications running on-premises, in other cloud environments, or within OCI itself. Applications may run on VMs or containers. In this approach, logs are first stored in OCI Object Storage before being processed by Log Analytics.
Log Ingestion
Oracle Cloud Infrastructure (OCI) Log Analytics can continuously collect log data from Object Storage buckets using an ObjectCollectionRule resource. Depending on the rule type—LIVE, HISTORIC, or HISTORIC_LIVE—OCI may leverage the Events and Streaming services in conjunction with Object Storage to detect and process new objects.
To enable this, you create an ObjectCollectionRule using the OCI REST API or CLI. A Stream OCID is required for rules of type LIVE and HISTORIC_LIVE, since those use streaming for real-time object notifications. For HISTORIC rules, Log Analytics directly pulls existing objects from Object Storage without using Streaming.
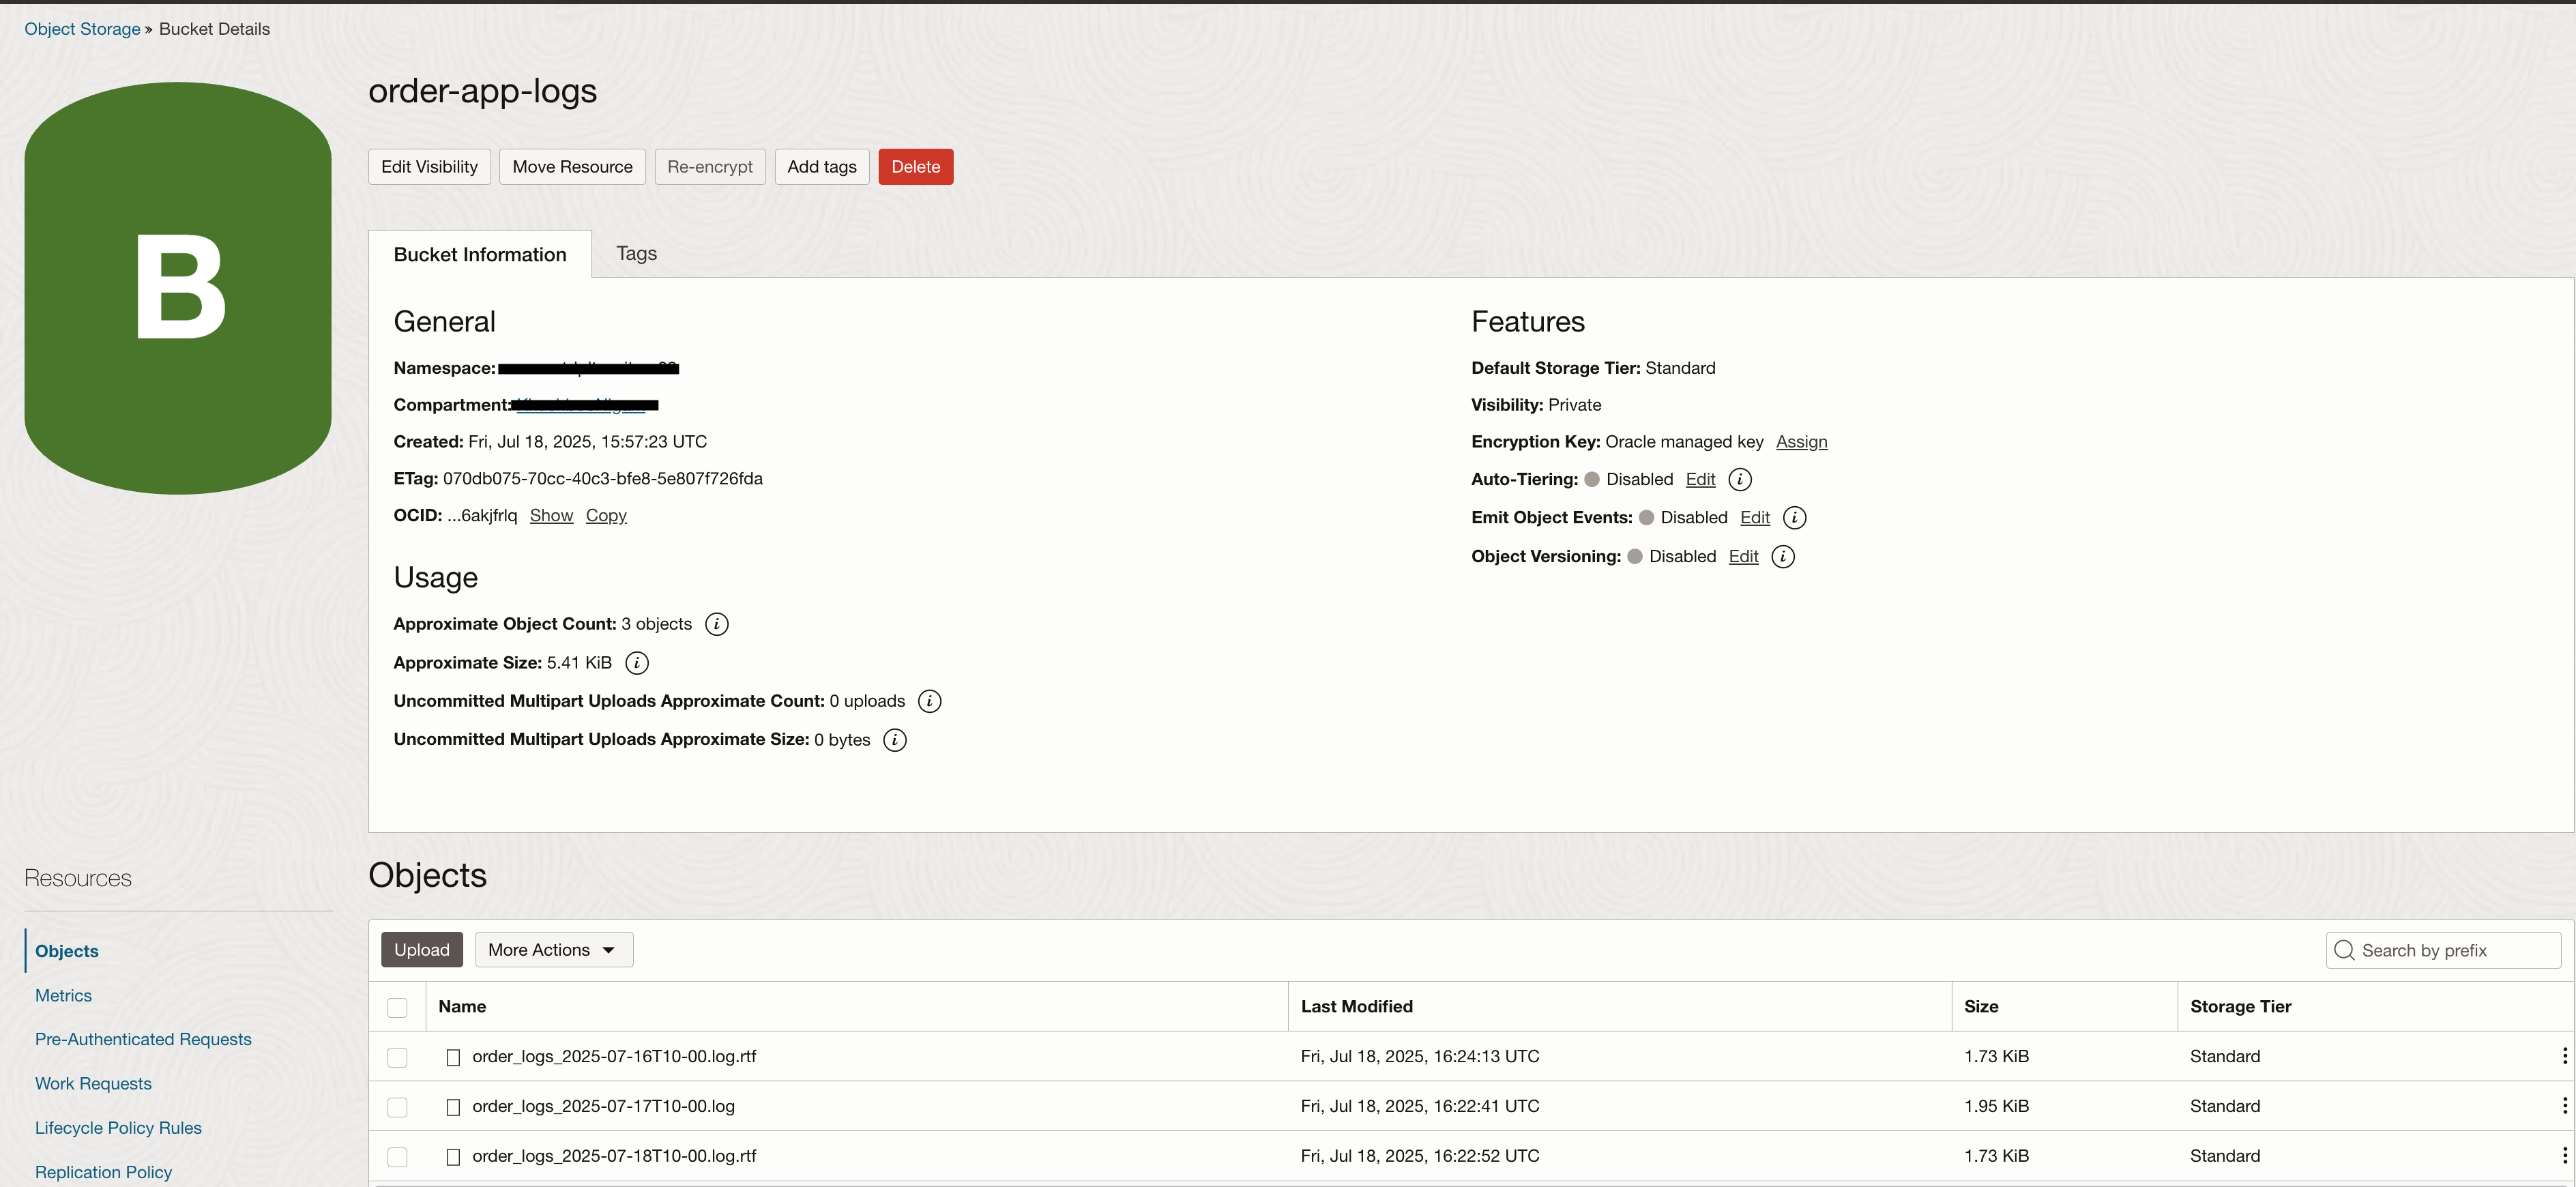
Once the rule is created and the required IAM policies are in place, log ingestion begins automatically. This method supports the ingestion of any log type stored in Object Storage. The recommended approach is to upload logs as new files at regular intervals, rather than continually appending to a single file, since Object Storage handles appends as object overwrites (new versions).
Detailed steps for setting up an ObjectCollectionRule can be found here. Below is a sample log structure used for this demonstration.
Create a Parser
Delimited Type
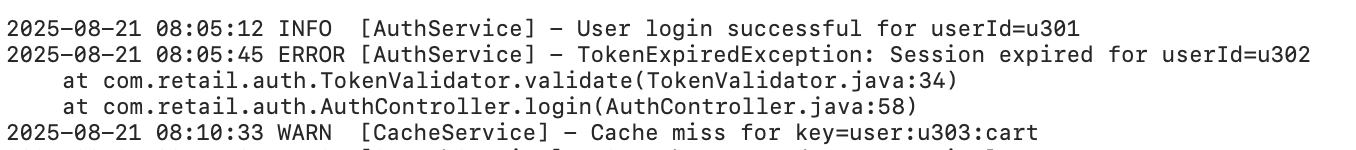
Let’s start by examining a single row of sample log data:

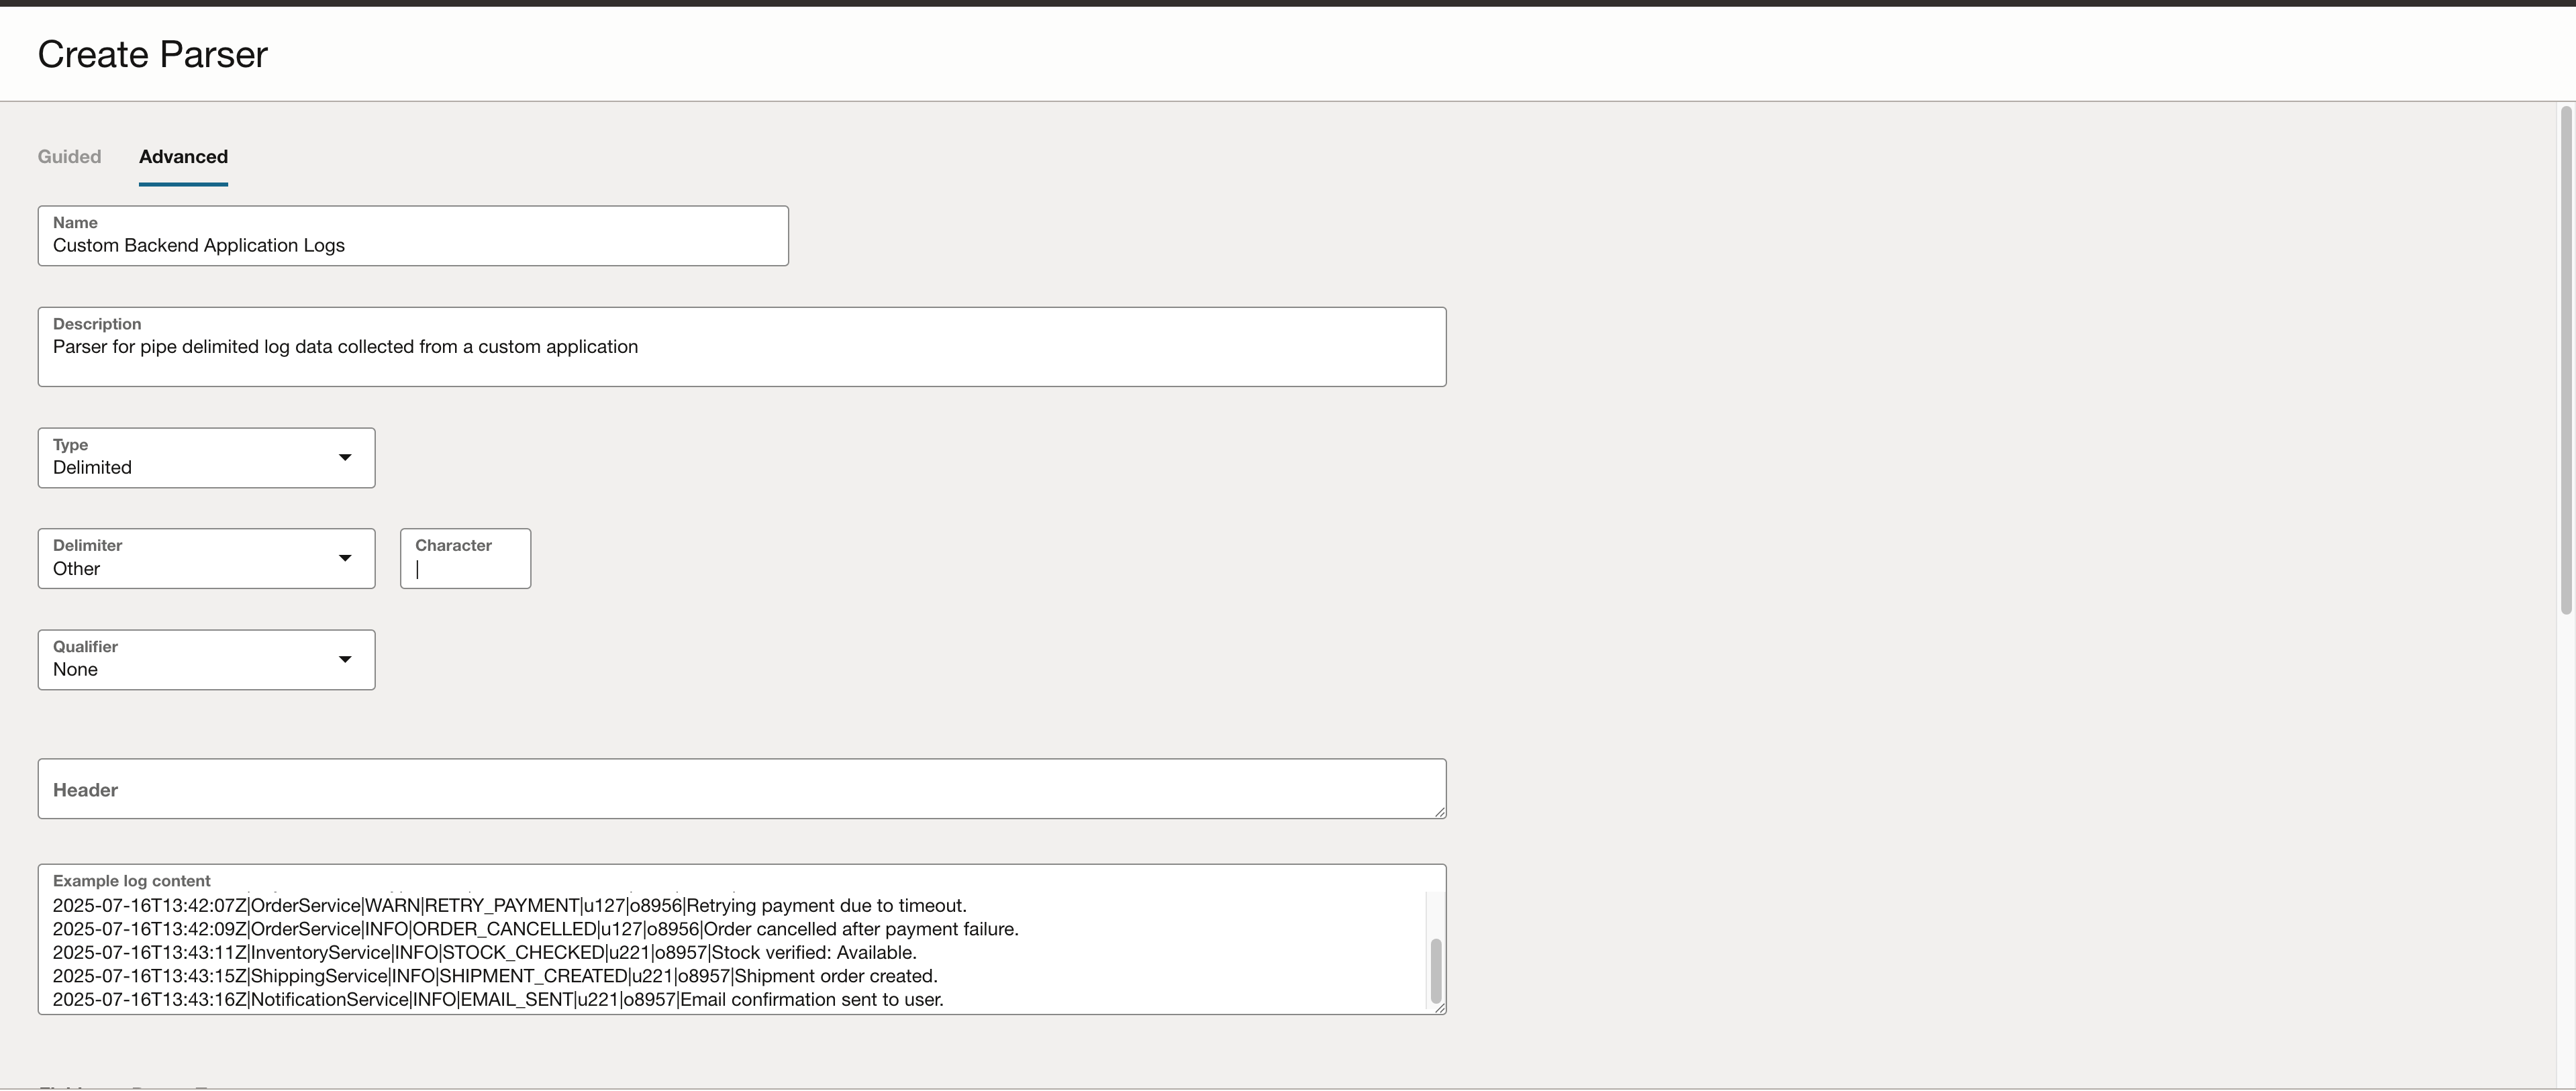
This log represents backend application services that are part of a retail system. Each log entry includes a timestamp, service name, log severity, and a message describing the action performed. In this example, the log fields are separated using the pipe (|) character. This delimiter will be specified during parser creation.
To create a custom parser:
- Navigate to Observability & Management → Administration → Parser.
- Click Create Parser.
- In the form, provide the following:
- Delimiter character (|)
- Sample log data
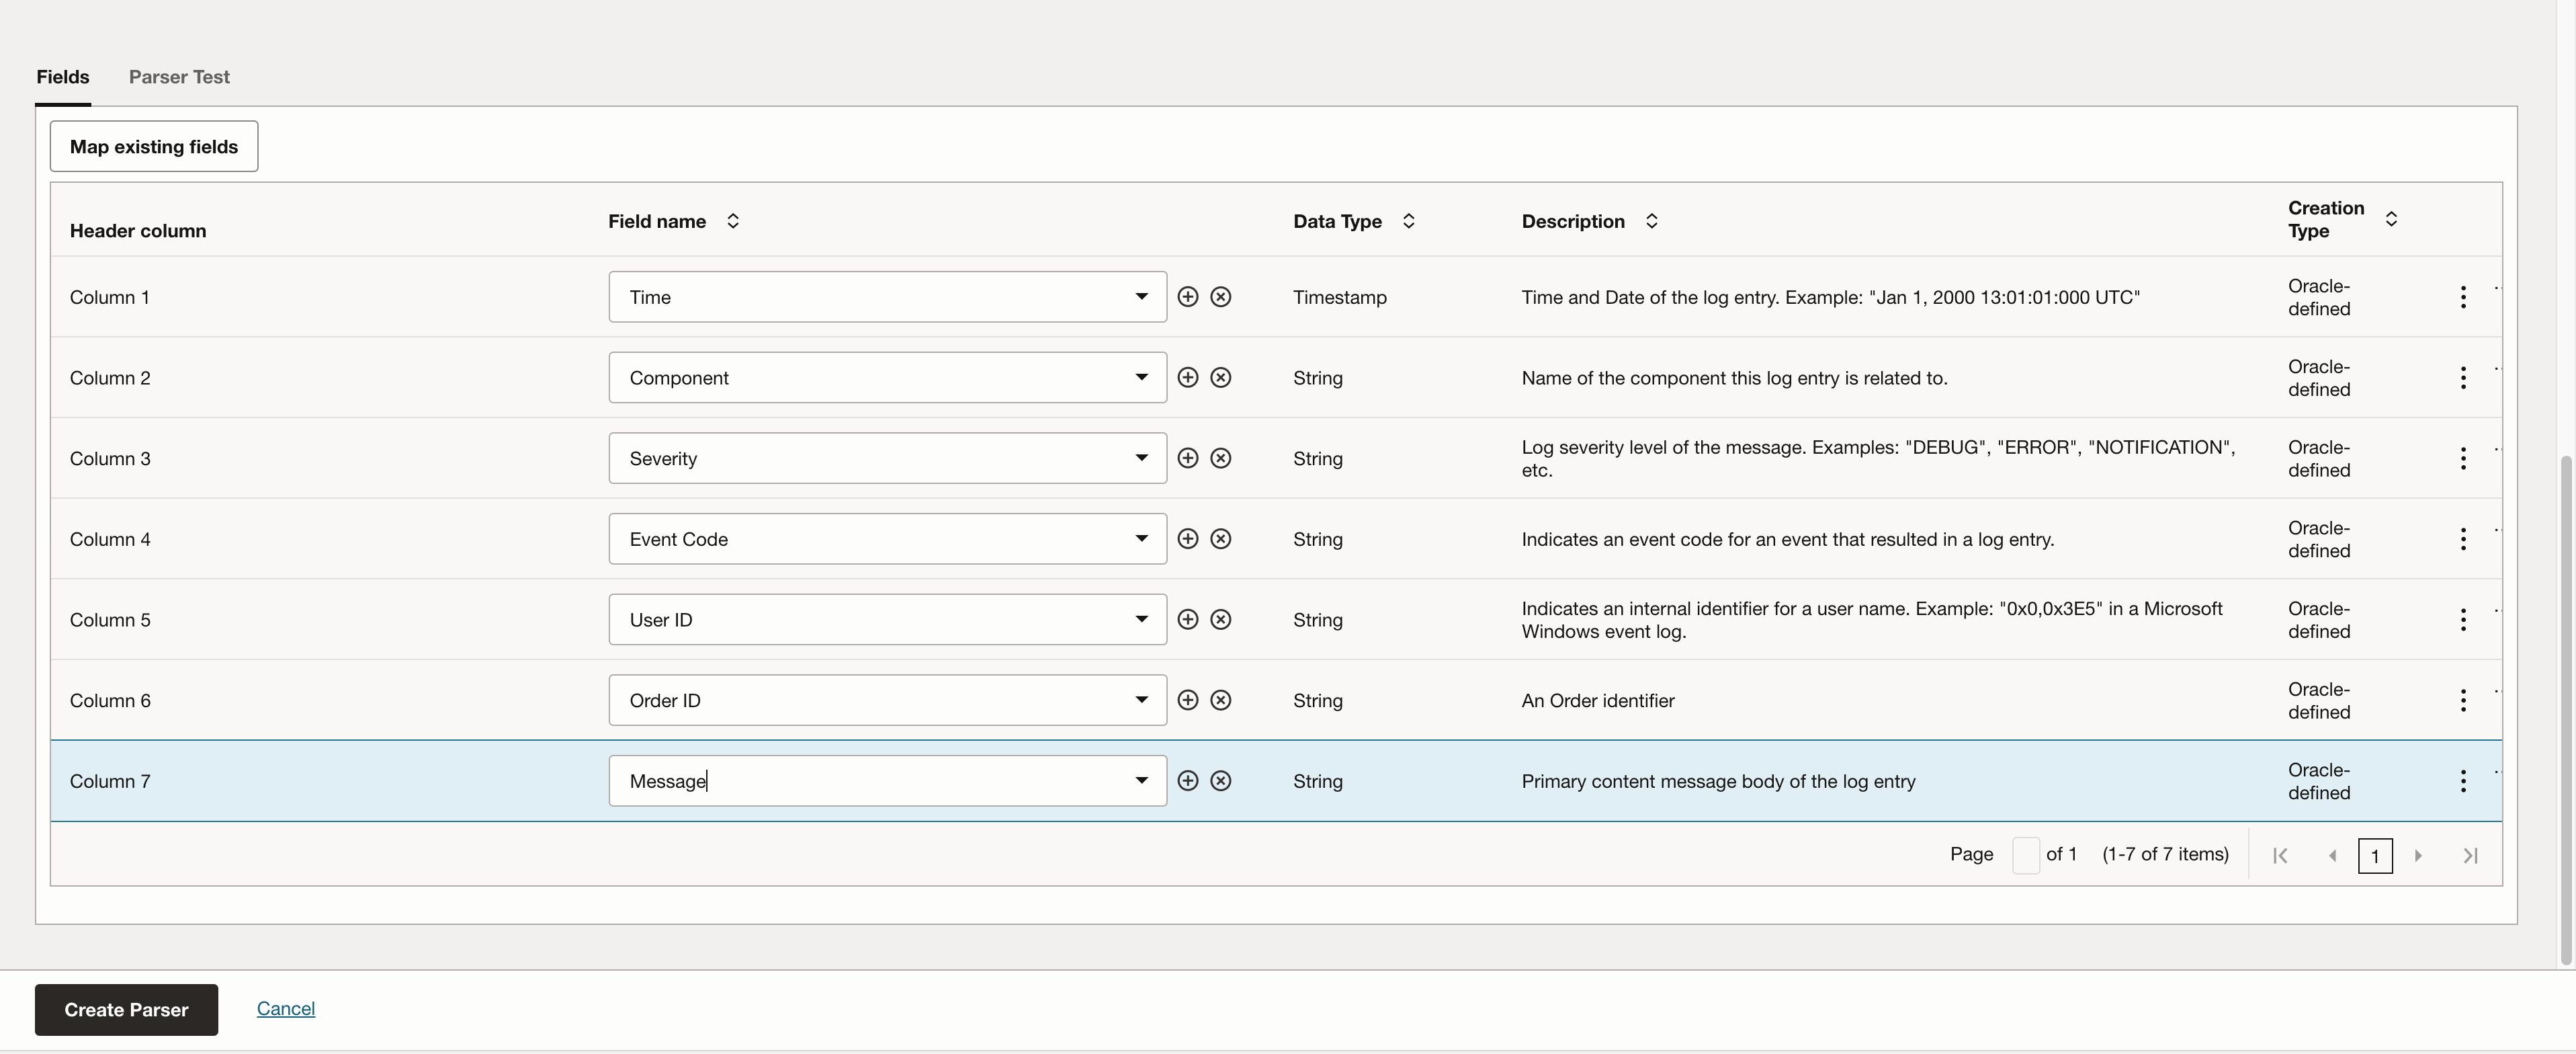
- Field names corresponding to each column
- (Optional) Header row, if the logs contain one
The screenshot below shows how the parser configuration is defined, using your sample log data and selected delimiter.
Regex Type
Some logs, especially application error logs, don’t follow a cleanly delimited structure (like CSV). Instead, they are written in free-form text and often span multiple lines, such as when stack traces are included. For these cases, a Regex Parser in OCI Log Analytics allows you to extract key fields by defining a regular expression that matches the log format.
In this example, we’ll use a sample application log entry with both single-line INFO messages and multi-line ERROR stack traces. The regex parser helps ensure that each log entry is correctly recognized and that important fields such as timestamp, level, service, and message are extracted.
To create a custom parser:
- Navigate to Observability & Management → Administration → Parser.
- Click Create Parser.
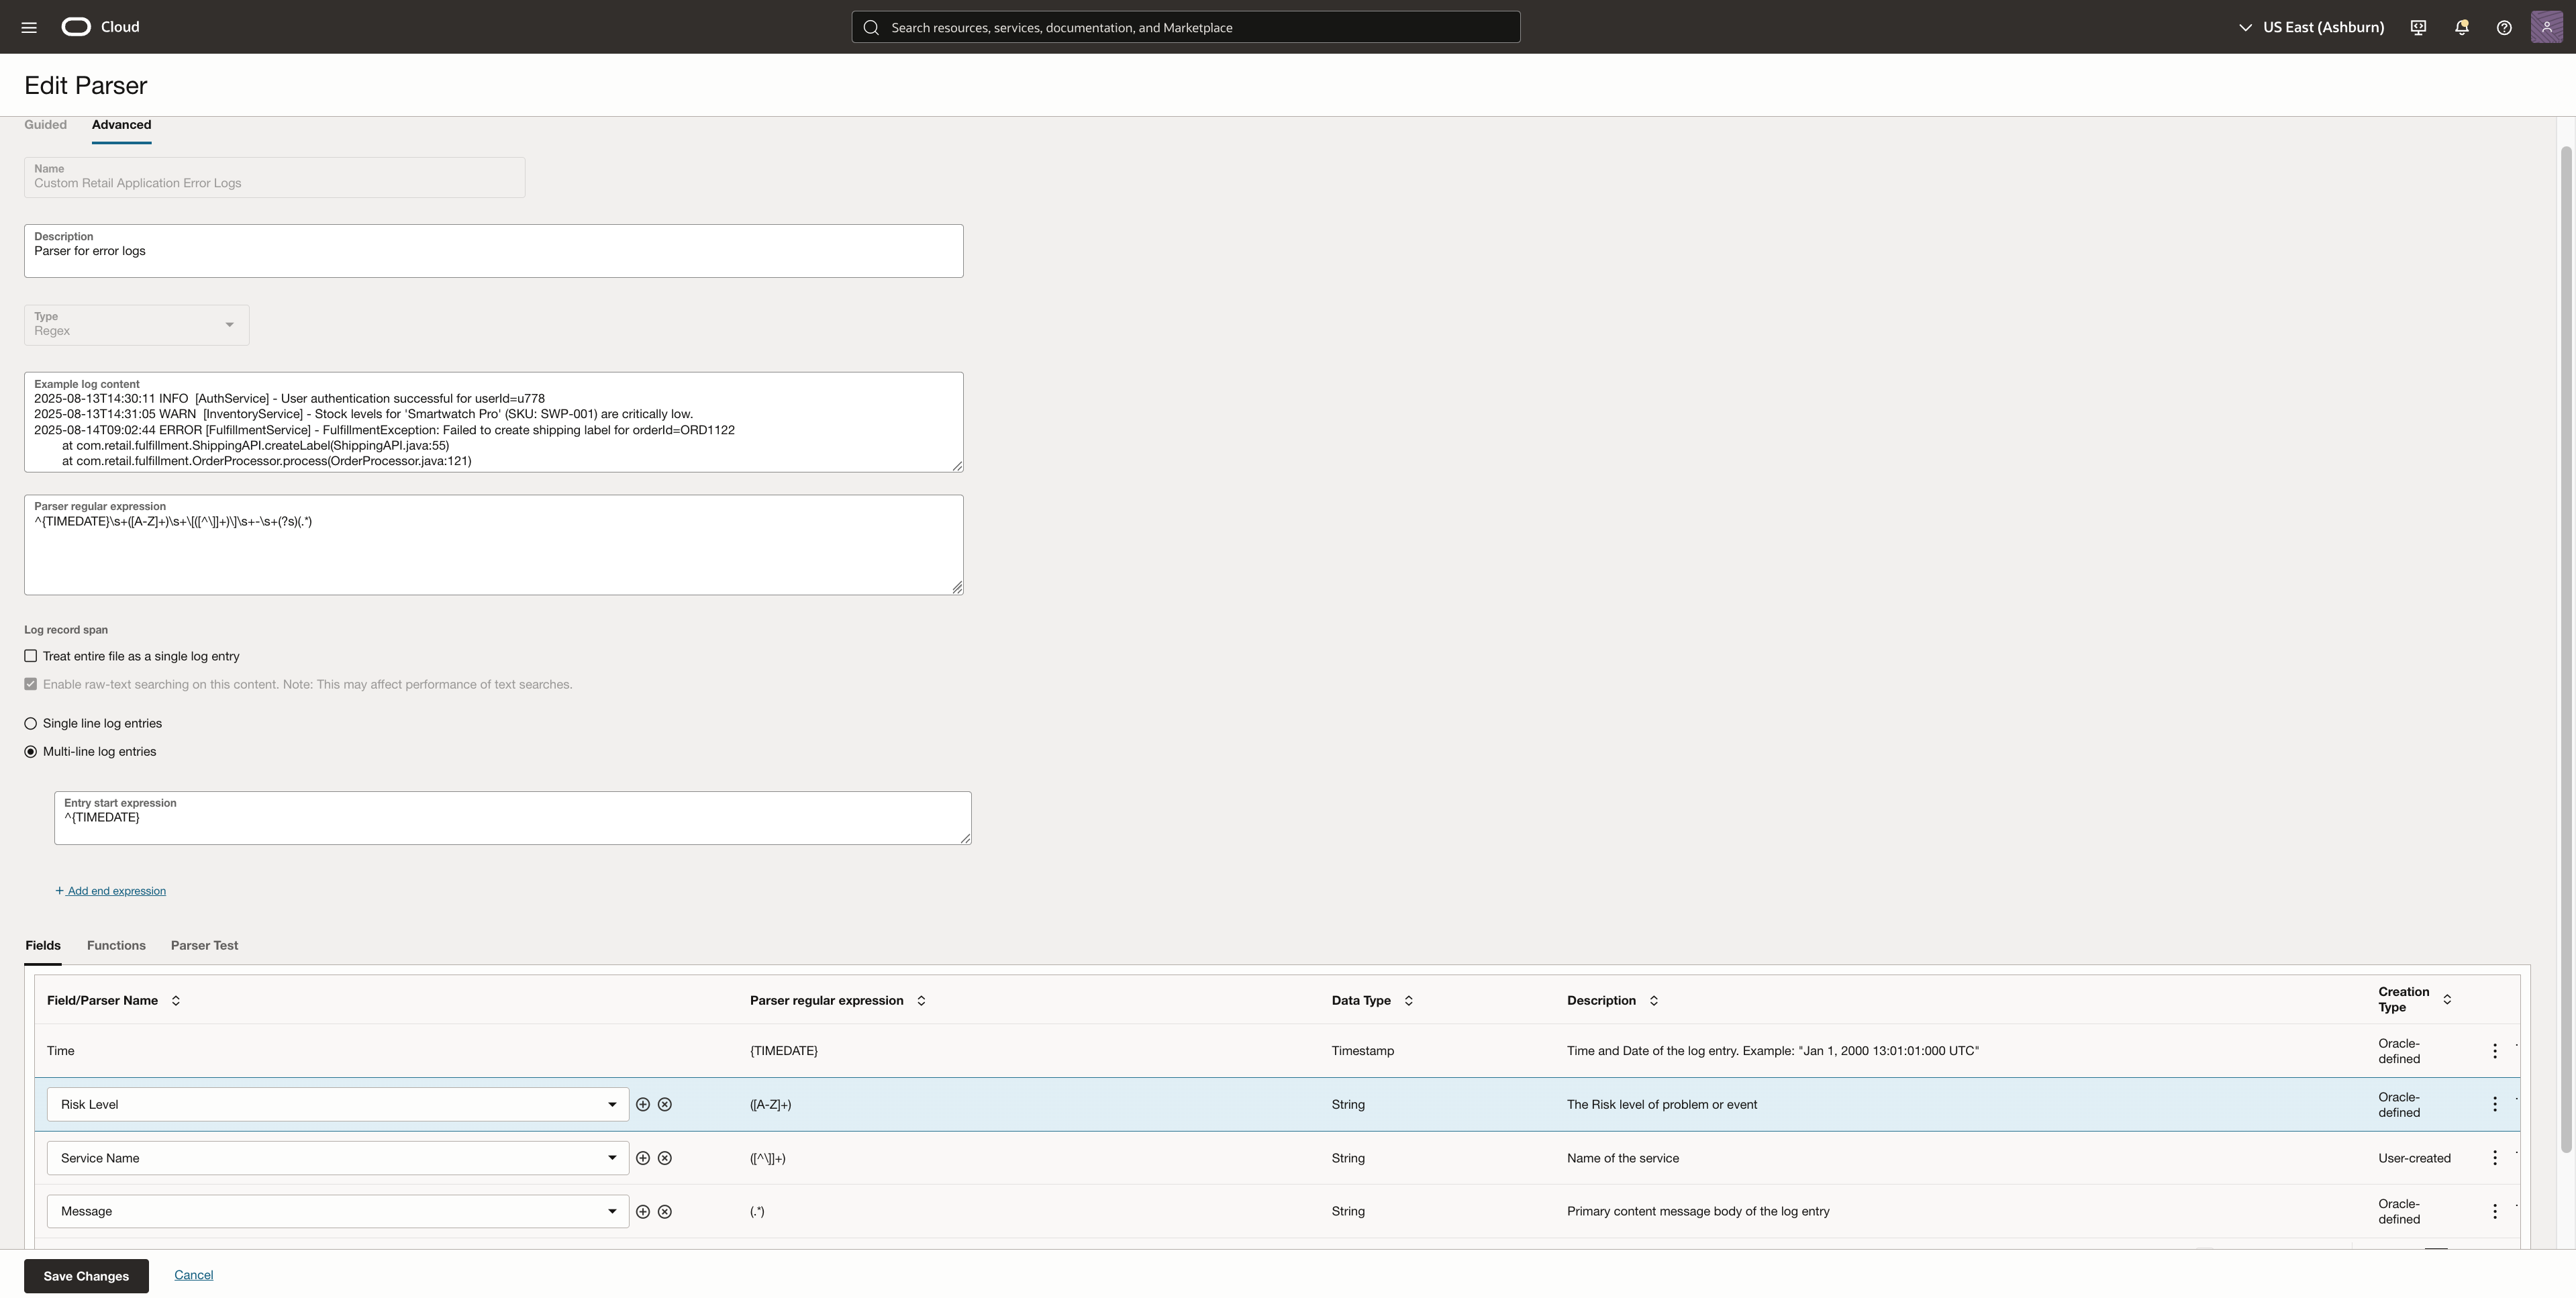
- Click Create Parser and choose Regex as the parser type. I am using the Advanced mode to create this parser. Enter a name, description, example log content.
- Paste a regex pattern that matches the structure of your log lines. For example, the following expression parses timestamp, log level, service name, and message:
^{TIMEDATE}\s+([A-Z]+)\s+\[([^\]]+)\]\s+-\s+(?s)(.*)
5. For stack traces or error messages that span multiple lines, set the Entry Start Expression to match the first line of each log entry. This ensures that Log Analytics recognizes the beginning of each log entry and associates subsequent indented lines with it. Example:
^{TIMEDATE}
When the parser expression and entry start expression works fine on the logs, you will be able to add fields parsed by them. In this example, I selected timestamp, risk level, service name and message. You can also create fields of your own choice by clicking on the + icon.
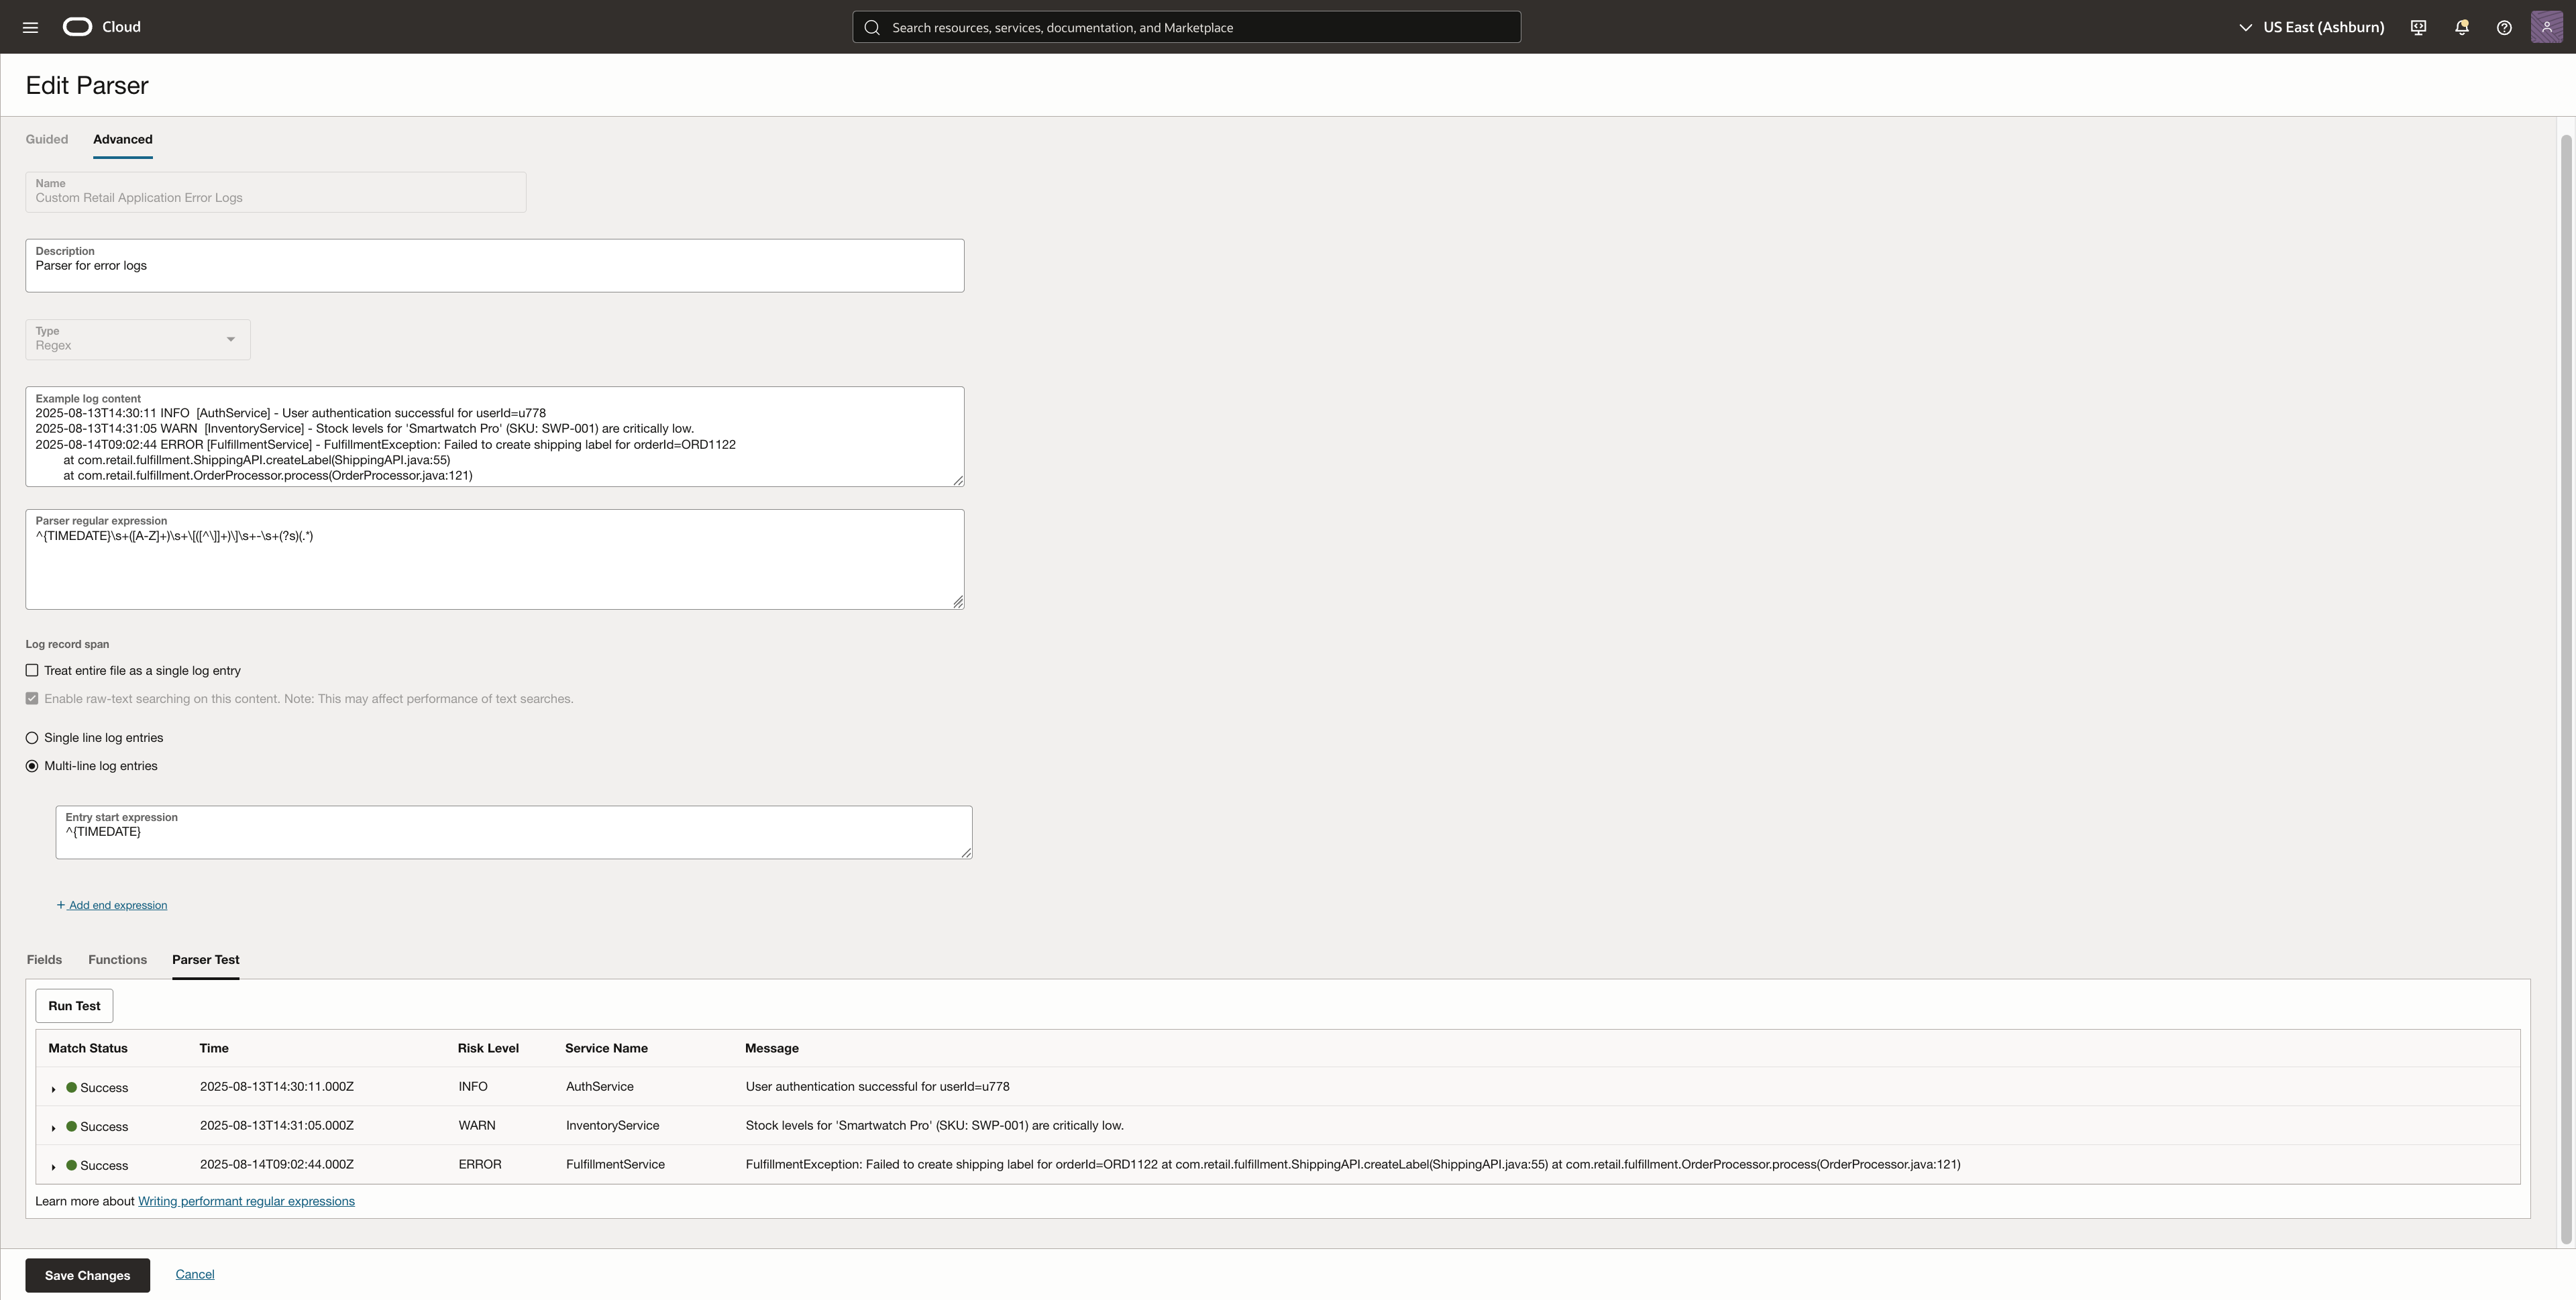
6. Use the Parser Test feature to validate your regex against a sample log file. Verify that the fields are extracted correctly. Click on Save Changes once finalized.
Create a Custom Log Source
The next step is to create a custom log source, which allows you to define how logs should be processed and enriched during ingestion.
To do this:
- Navigate to Observability & Management → Administration → Source.
- Click on Create Source.
- For Entity Type, select OCI Object Storage Bucket, since logs are being ingested from Object Storage.
- Attach the custom parser created in the previous step.
In this example, there will be two Log Sources, RetailOrderAppLogs for the structured log data and RetailAppErrorLogs for the application error logs. Both the log sources will be tied to their respective parsers.
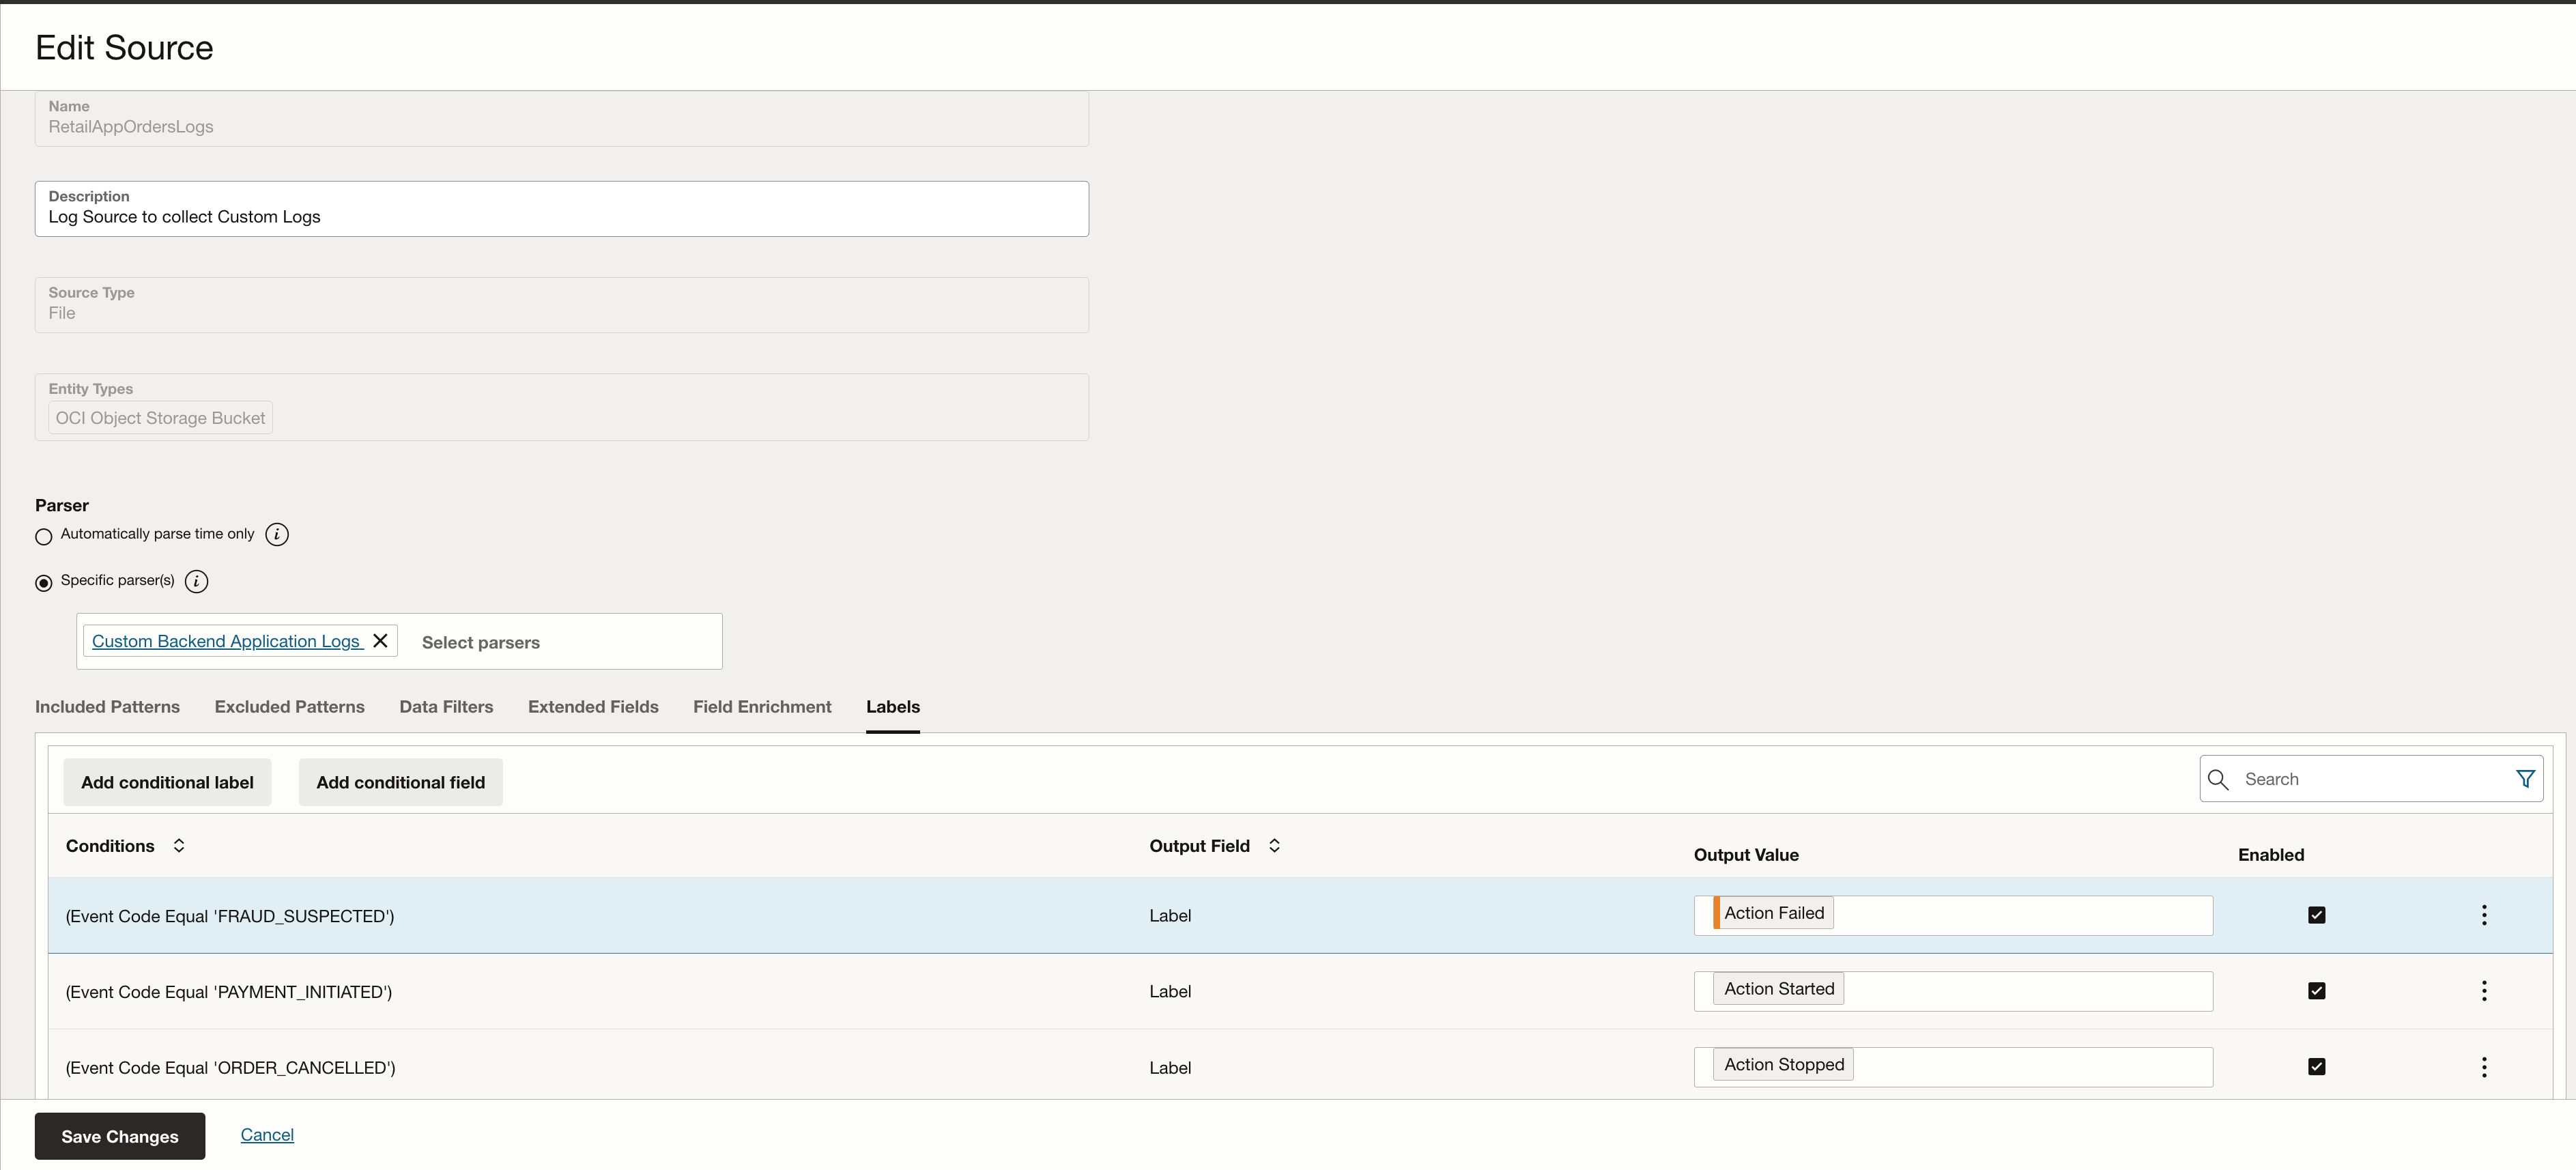
This step is also where you can enrich logs with contextual metadata. For example, in the RetailOrderAppLogs log source, I added a label called “Action Failed” for log entries where the event_code is “FRAUD_SUSPECTED”. Such labels improve log searchability and help surface critical events in dashboards and alerts.
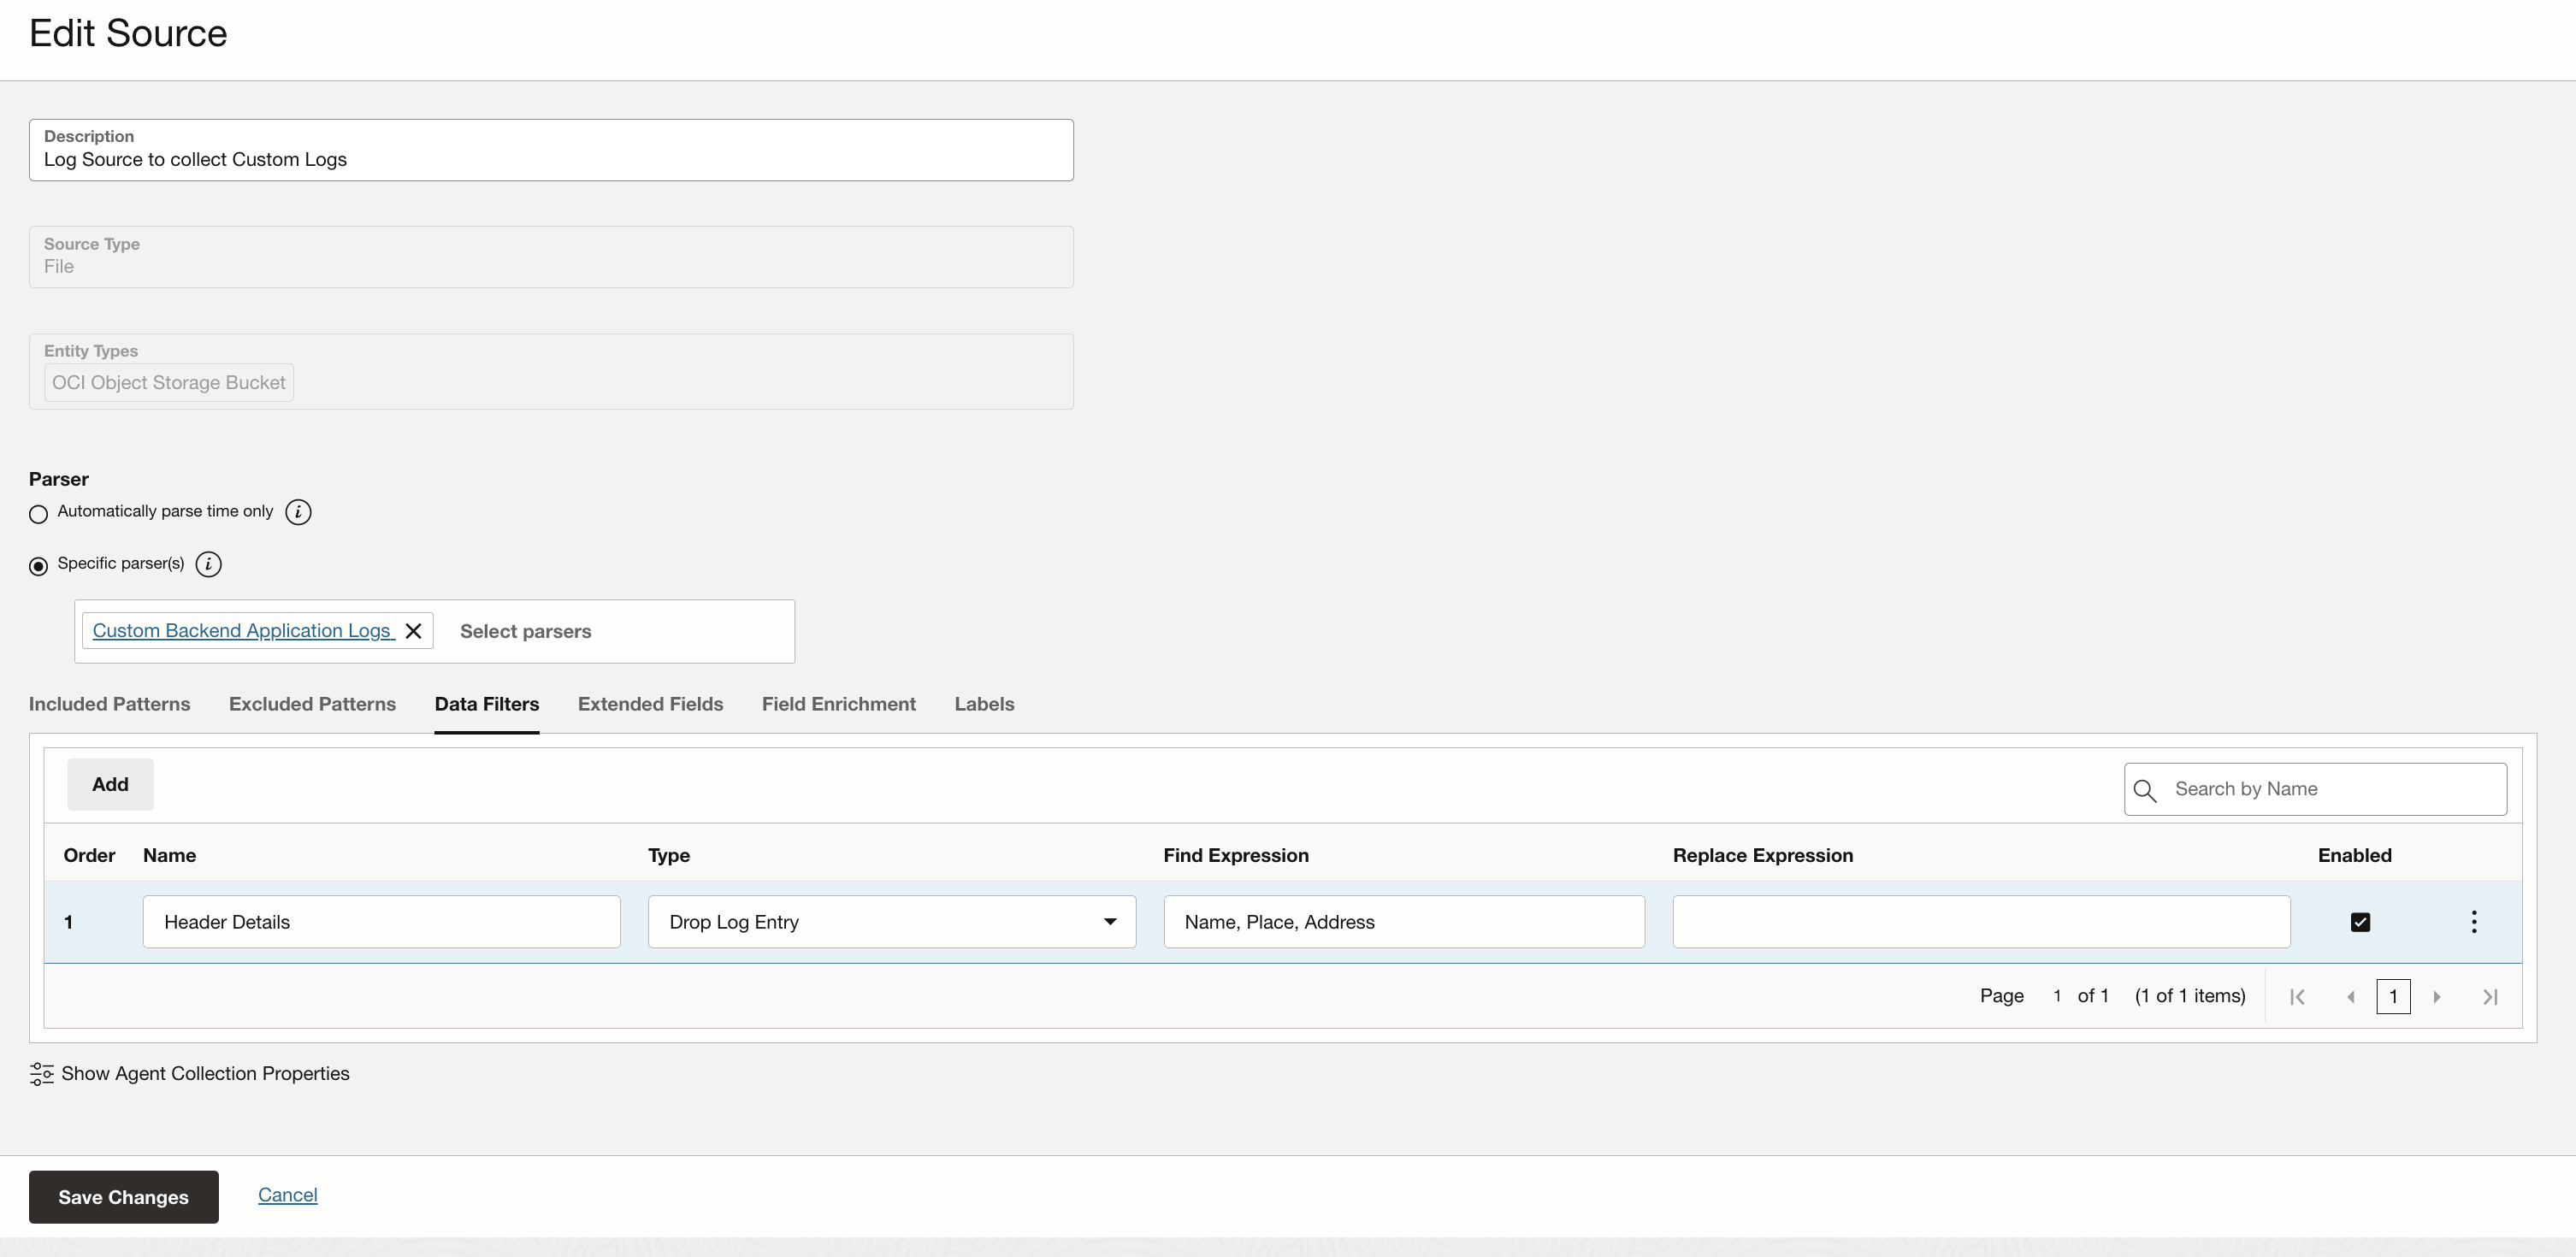
Note: If there is a header in your delimited logs file then it’s important to add the information in the Log Source. The image below shows the Data Filters section which can help with defining any log data that needs masked or dropped. We define header details here specifically so that they are dropped when ingested and not treated as log entries.
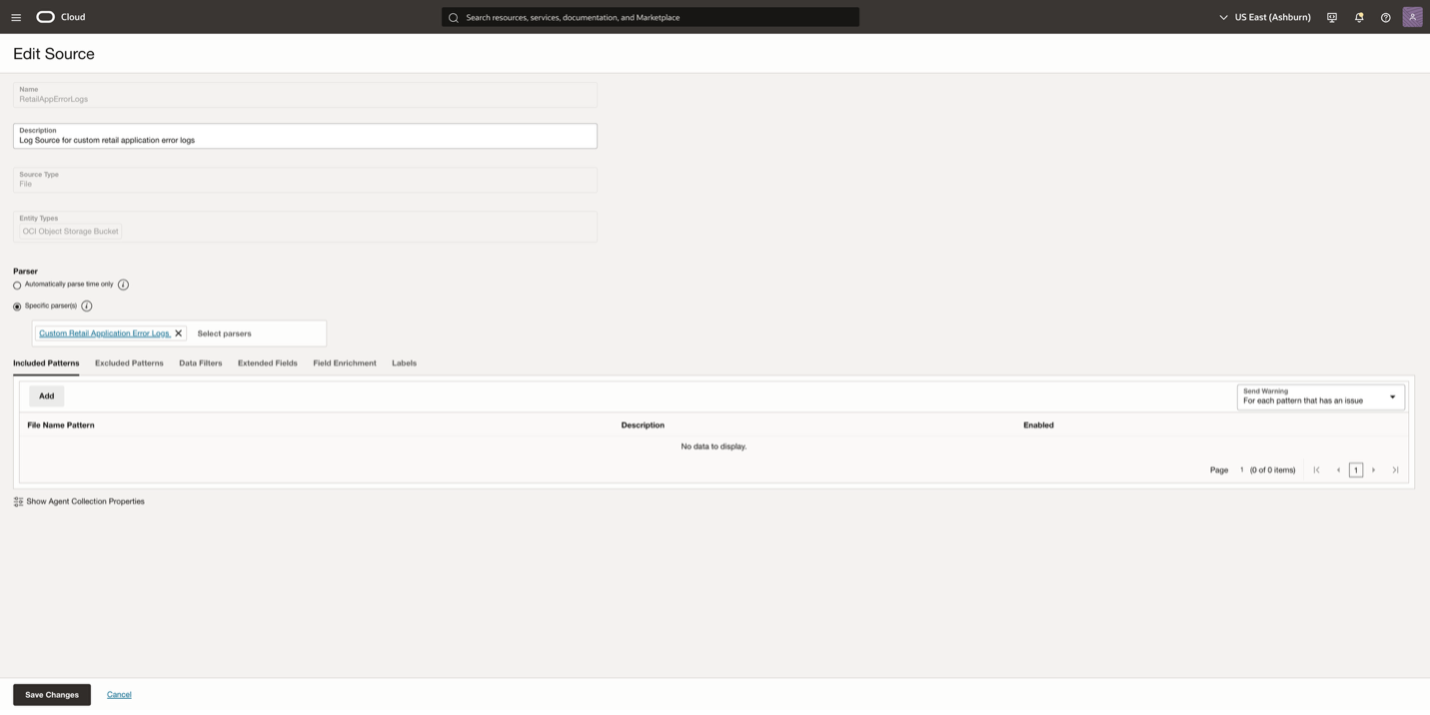
For the application error logs log source, I defined the regex parser created in the parser section.
Viewing Parsed Log Data in Log Explorer
Once the logs are ingested in Log Analytics, they can be seen in the Log Explorer. In the image below, we can see the retail order application logs.
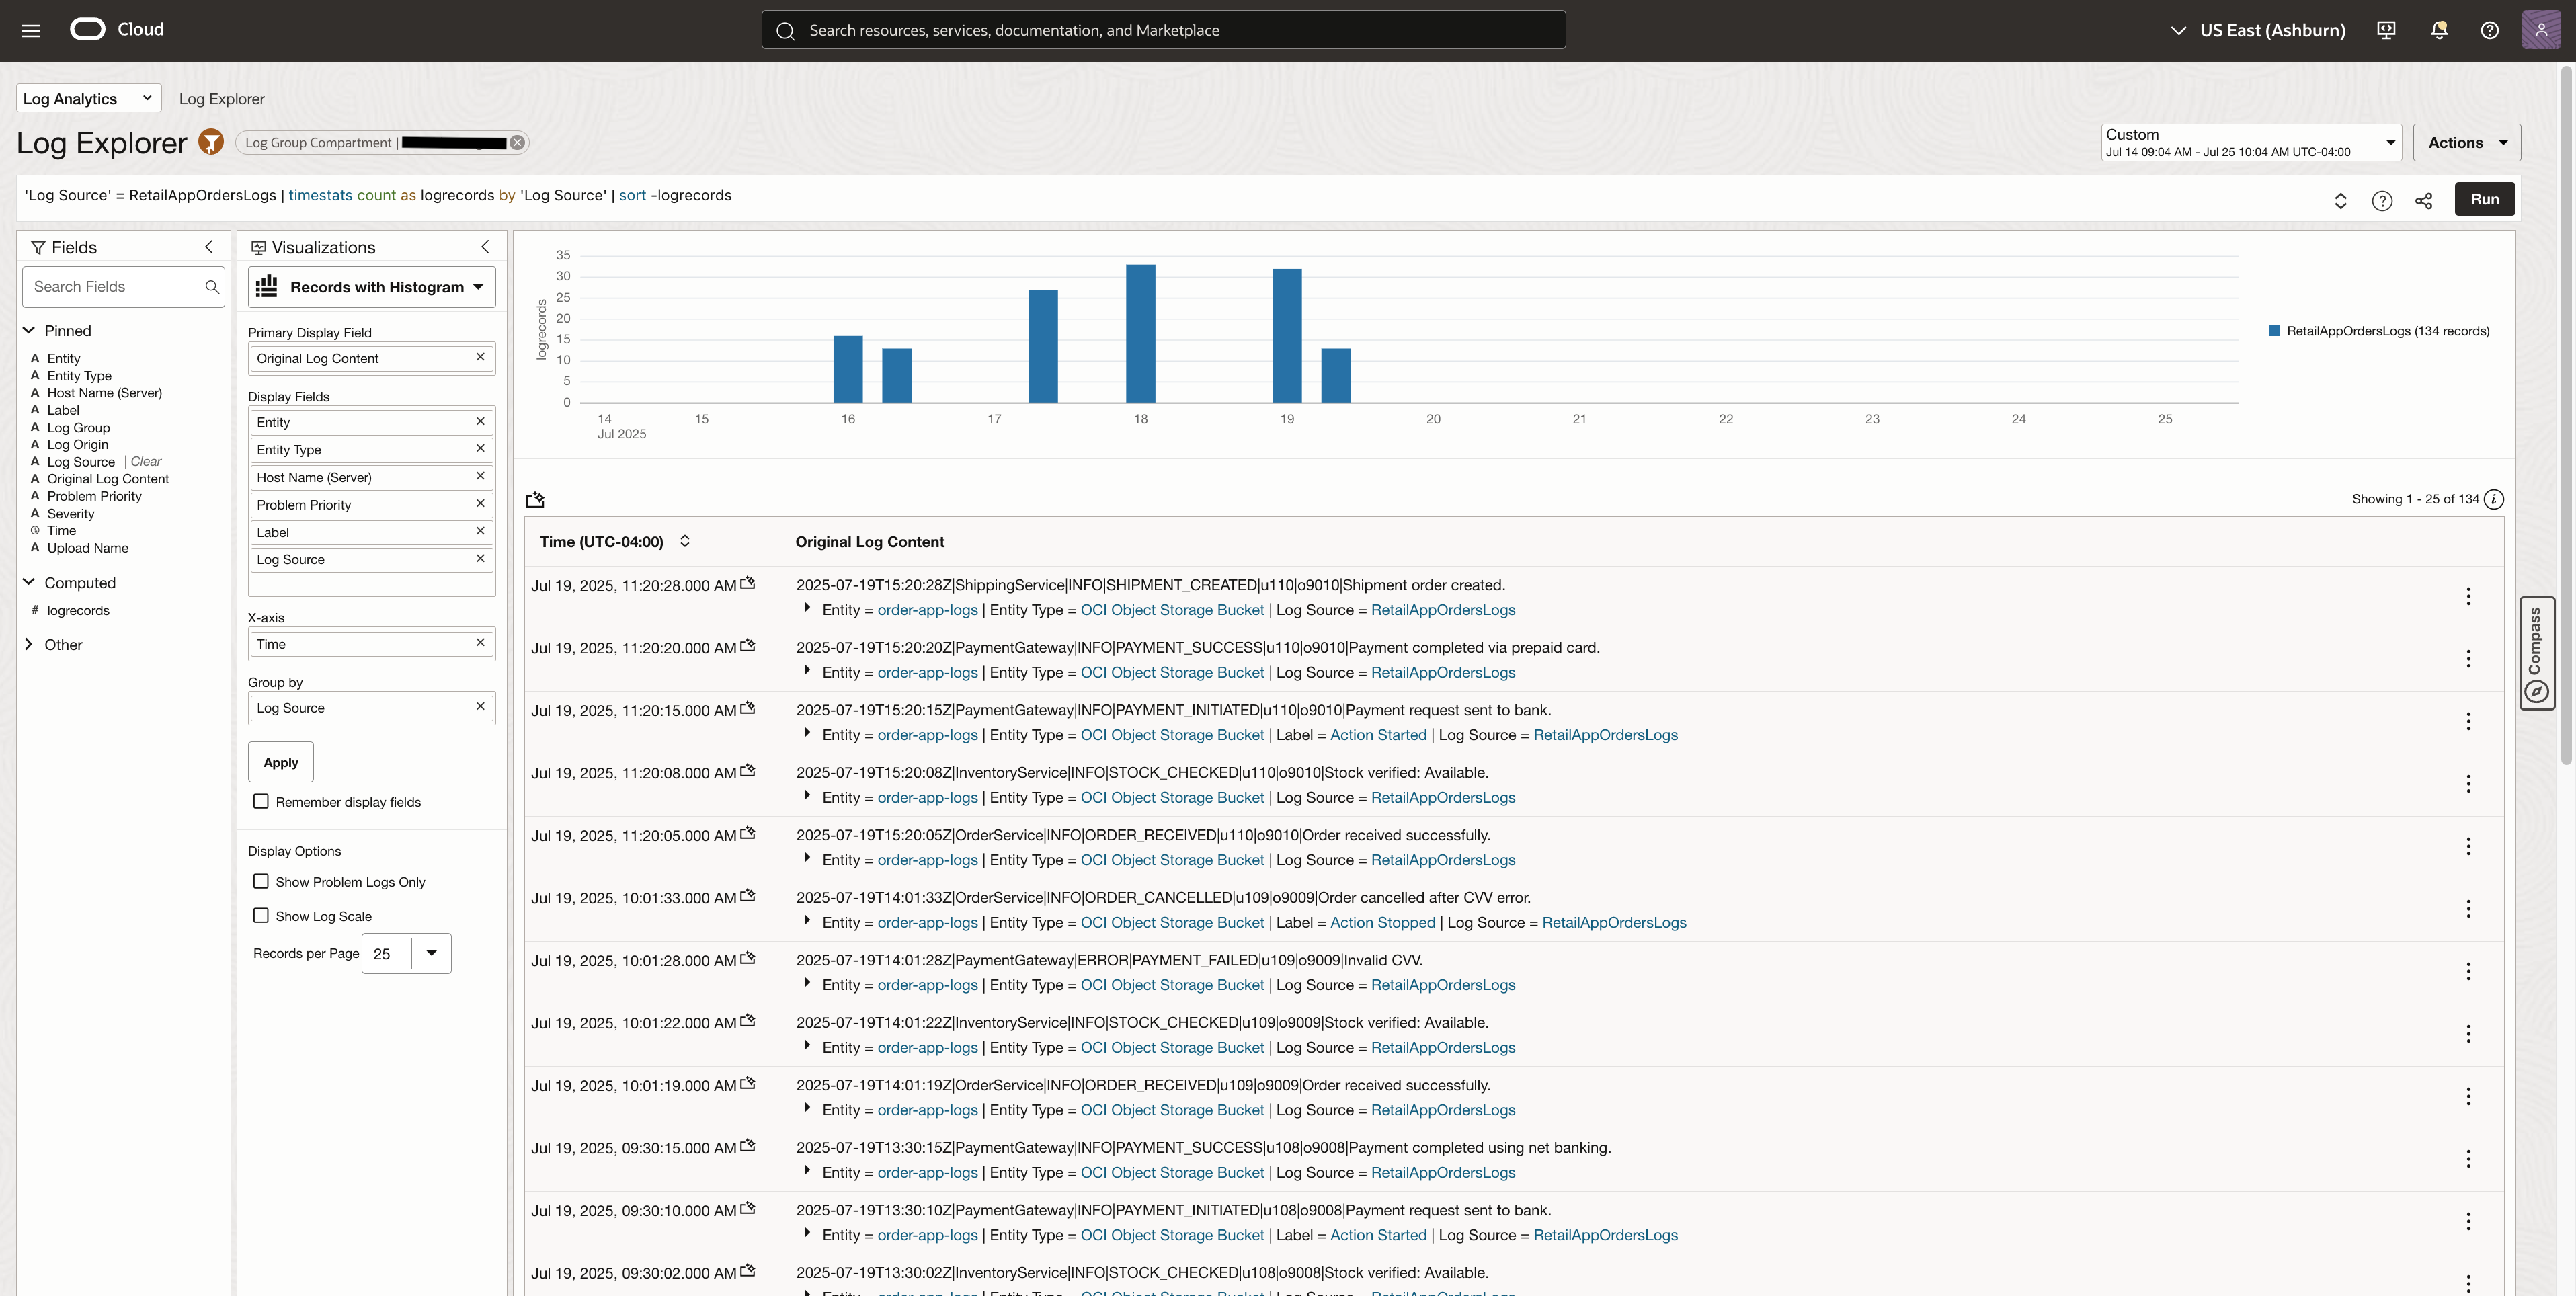
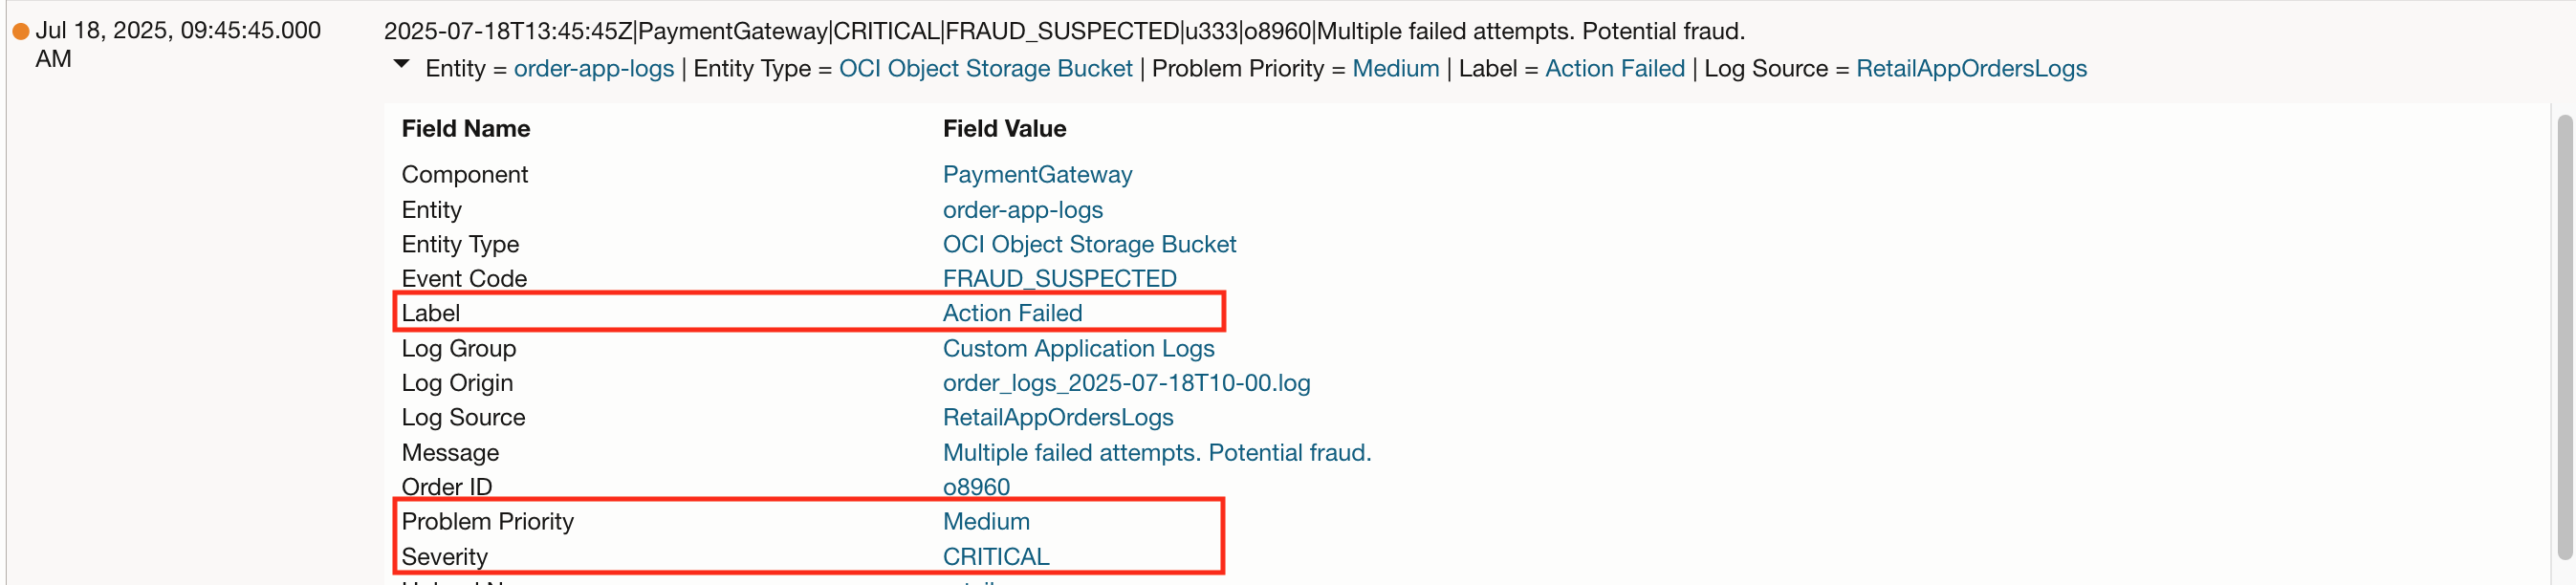
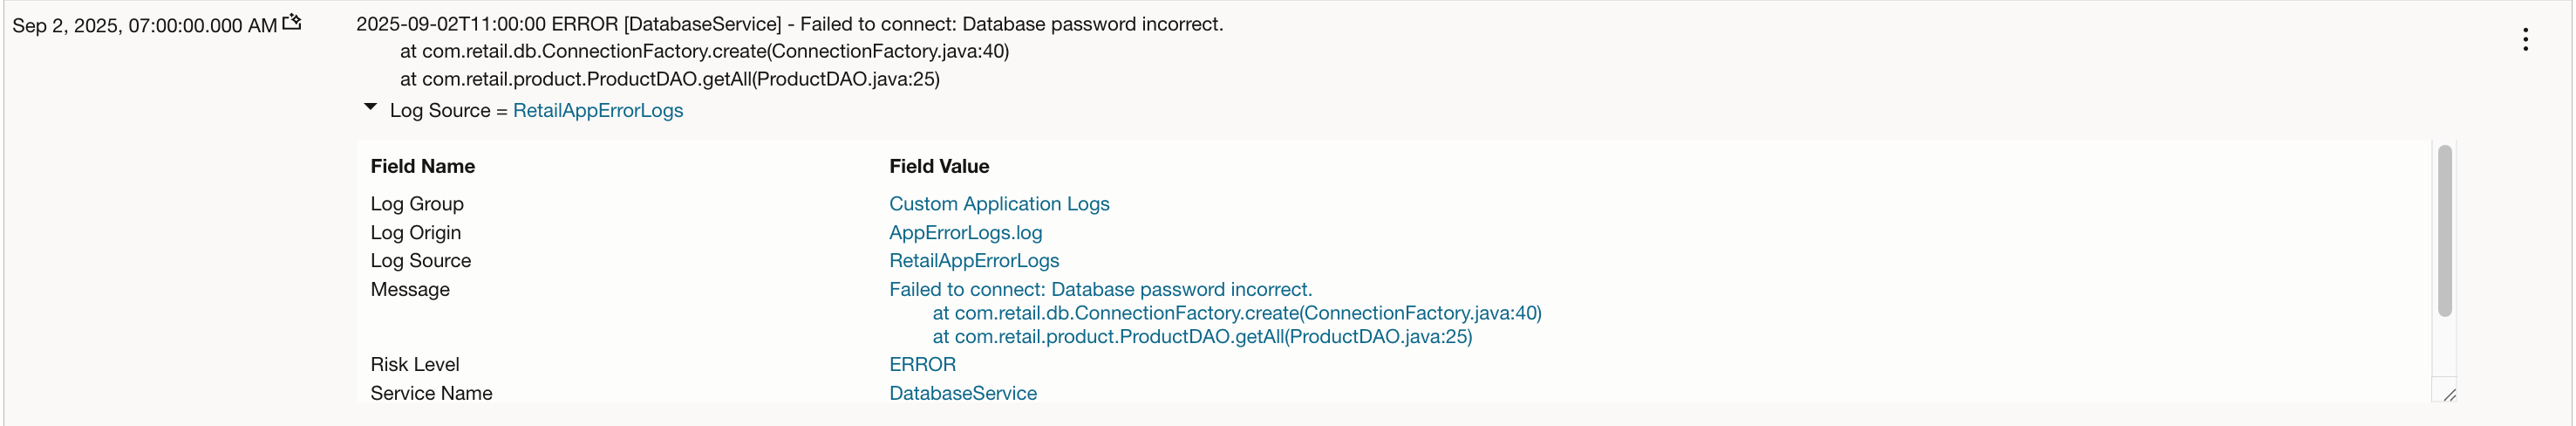
Once the logs are ingested and parsed, you can expand individual log events to inspect the structured data extracted from the original delimited files.
Each log record now includes:
- Fields parsed using the pipe (|) delimiter, such as timestamp, service_name, event_code, etc.
- Enrichment fields added at the Log Source level, such as:
- Label (e.g., “Action Failed” for critical events)
- Severity (e.g., INFO, WARN, ERROR)
This structured view enables more powerful search, filtering, and dashboarding capabilities across your logs.
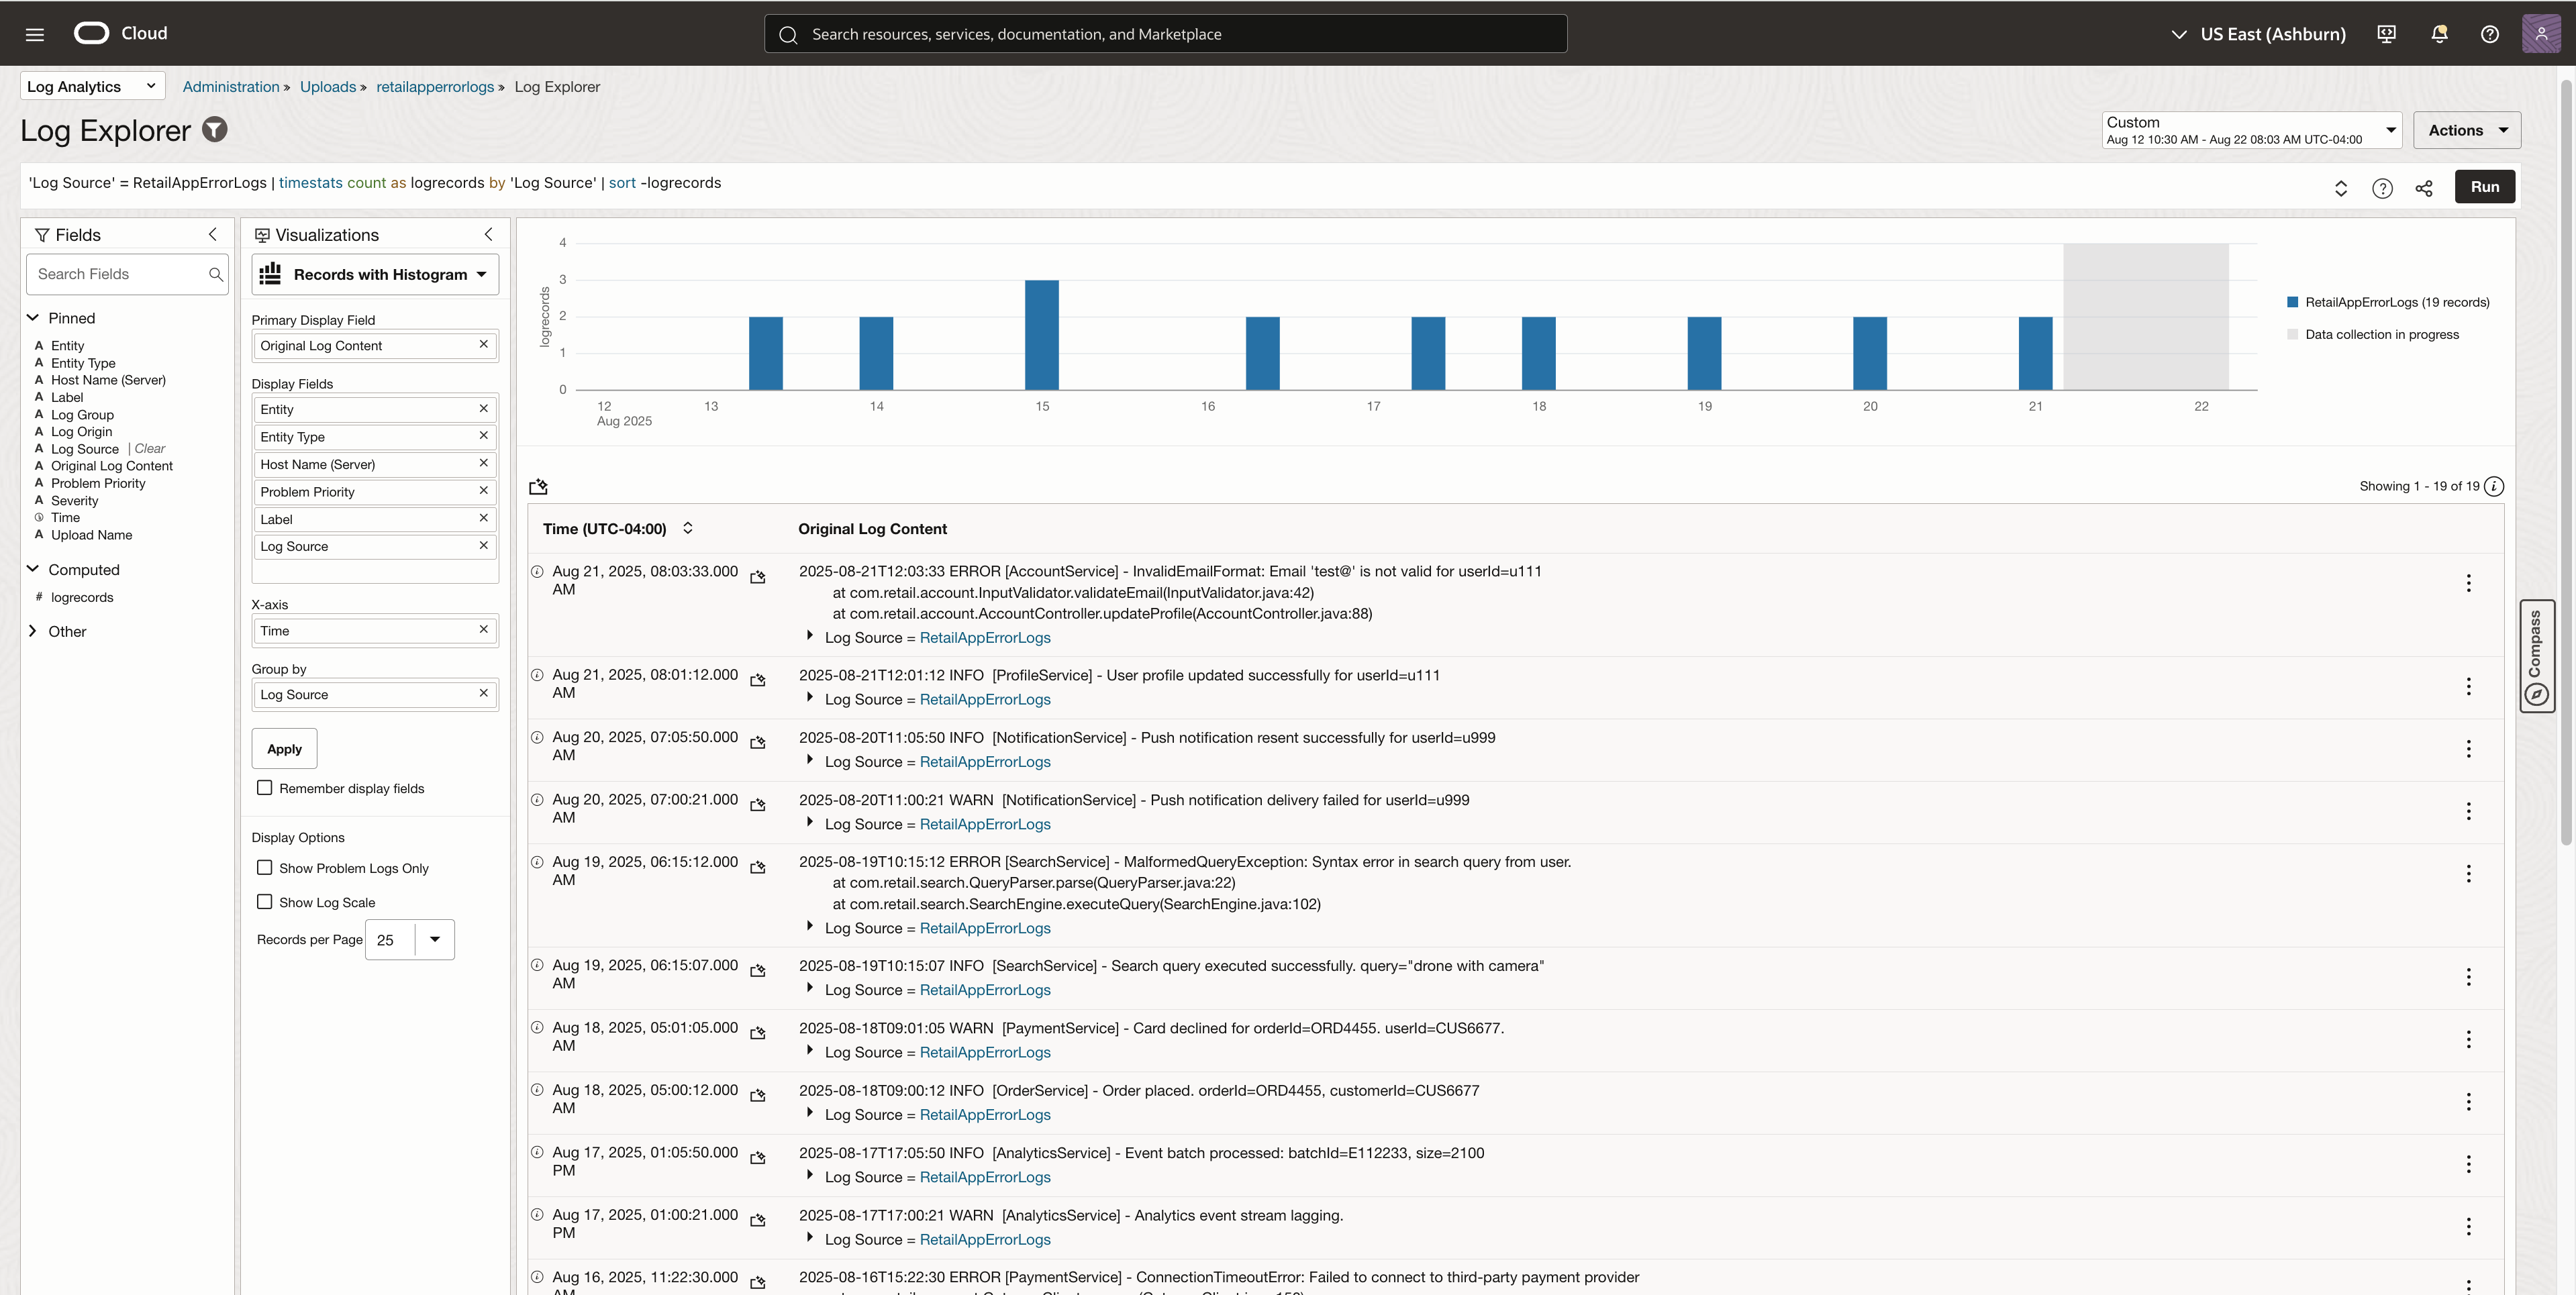
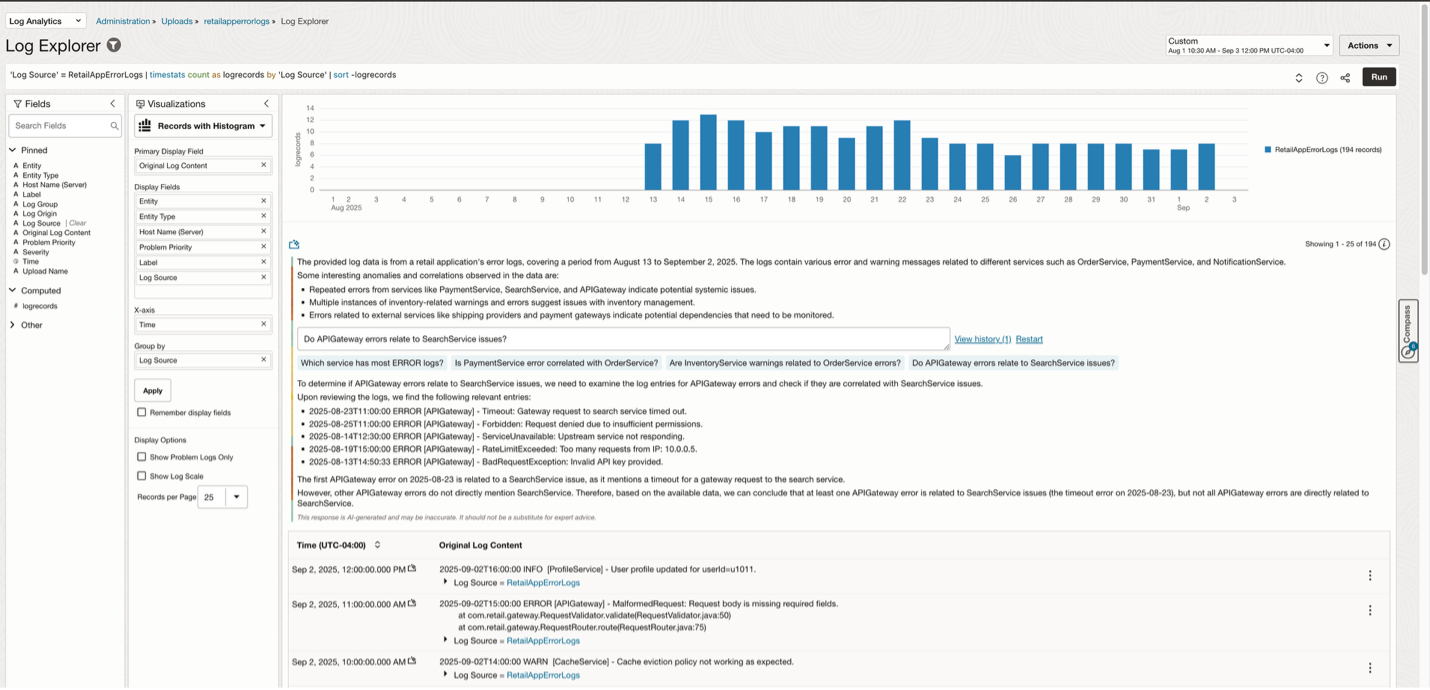
Here is the view of the application error logs that used the regex parser
Filter and Refine Log Results
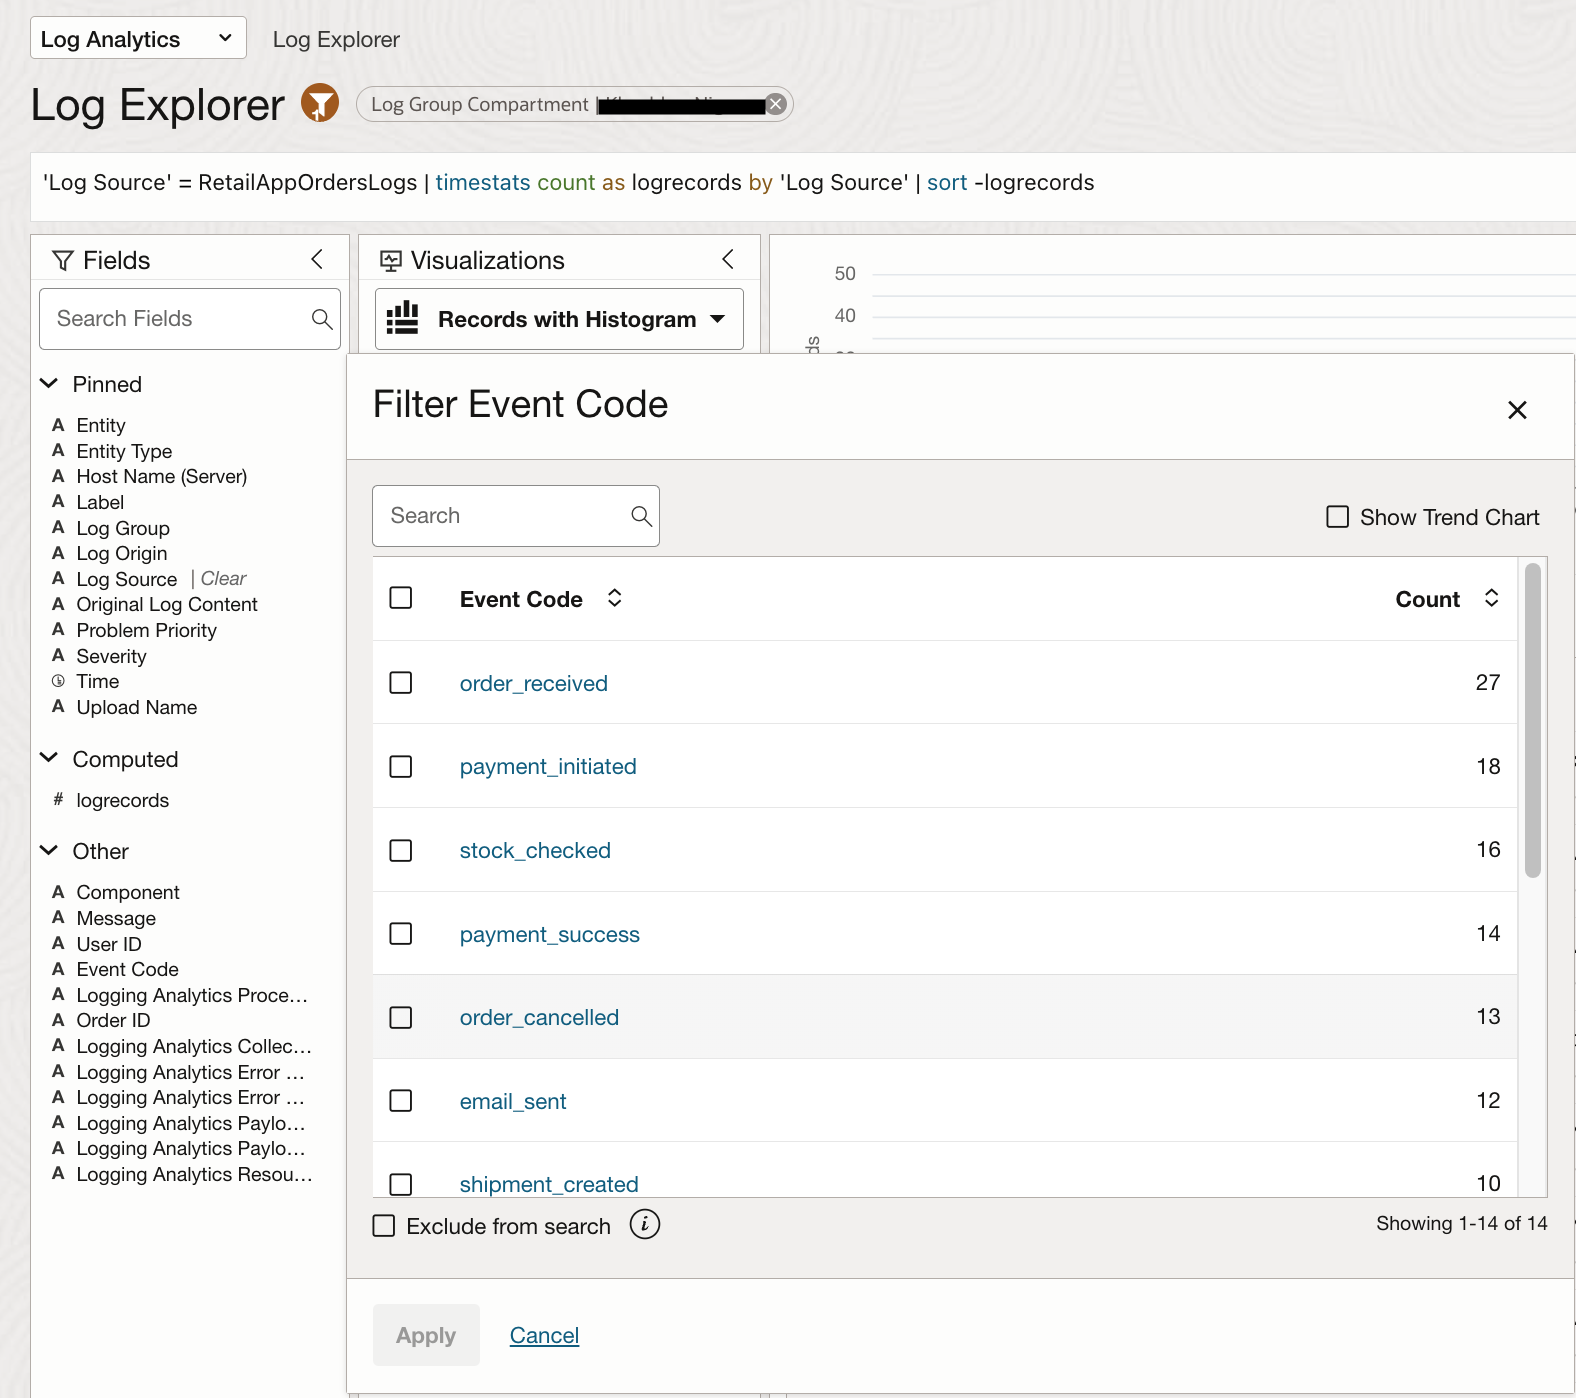
Parsed fields can also be used to filter and refine log search results. For example, selecting the parsed field Event Code from the Fields menu displays all possible values captured in your logs, such as order_placed, payment_successful, or fraud_suspected.
This enables quick exploration of log patterns and helps build targeted queries without needing to remember exact field names or values.
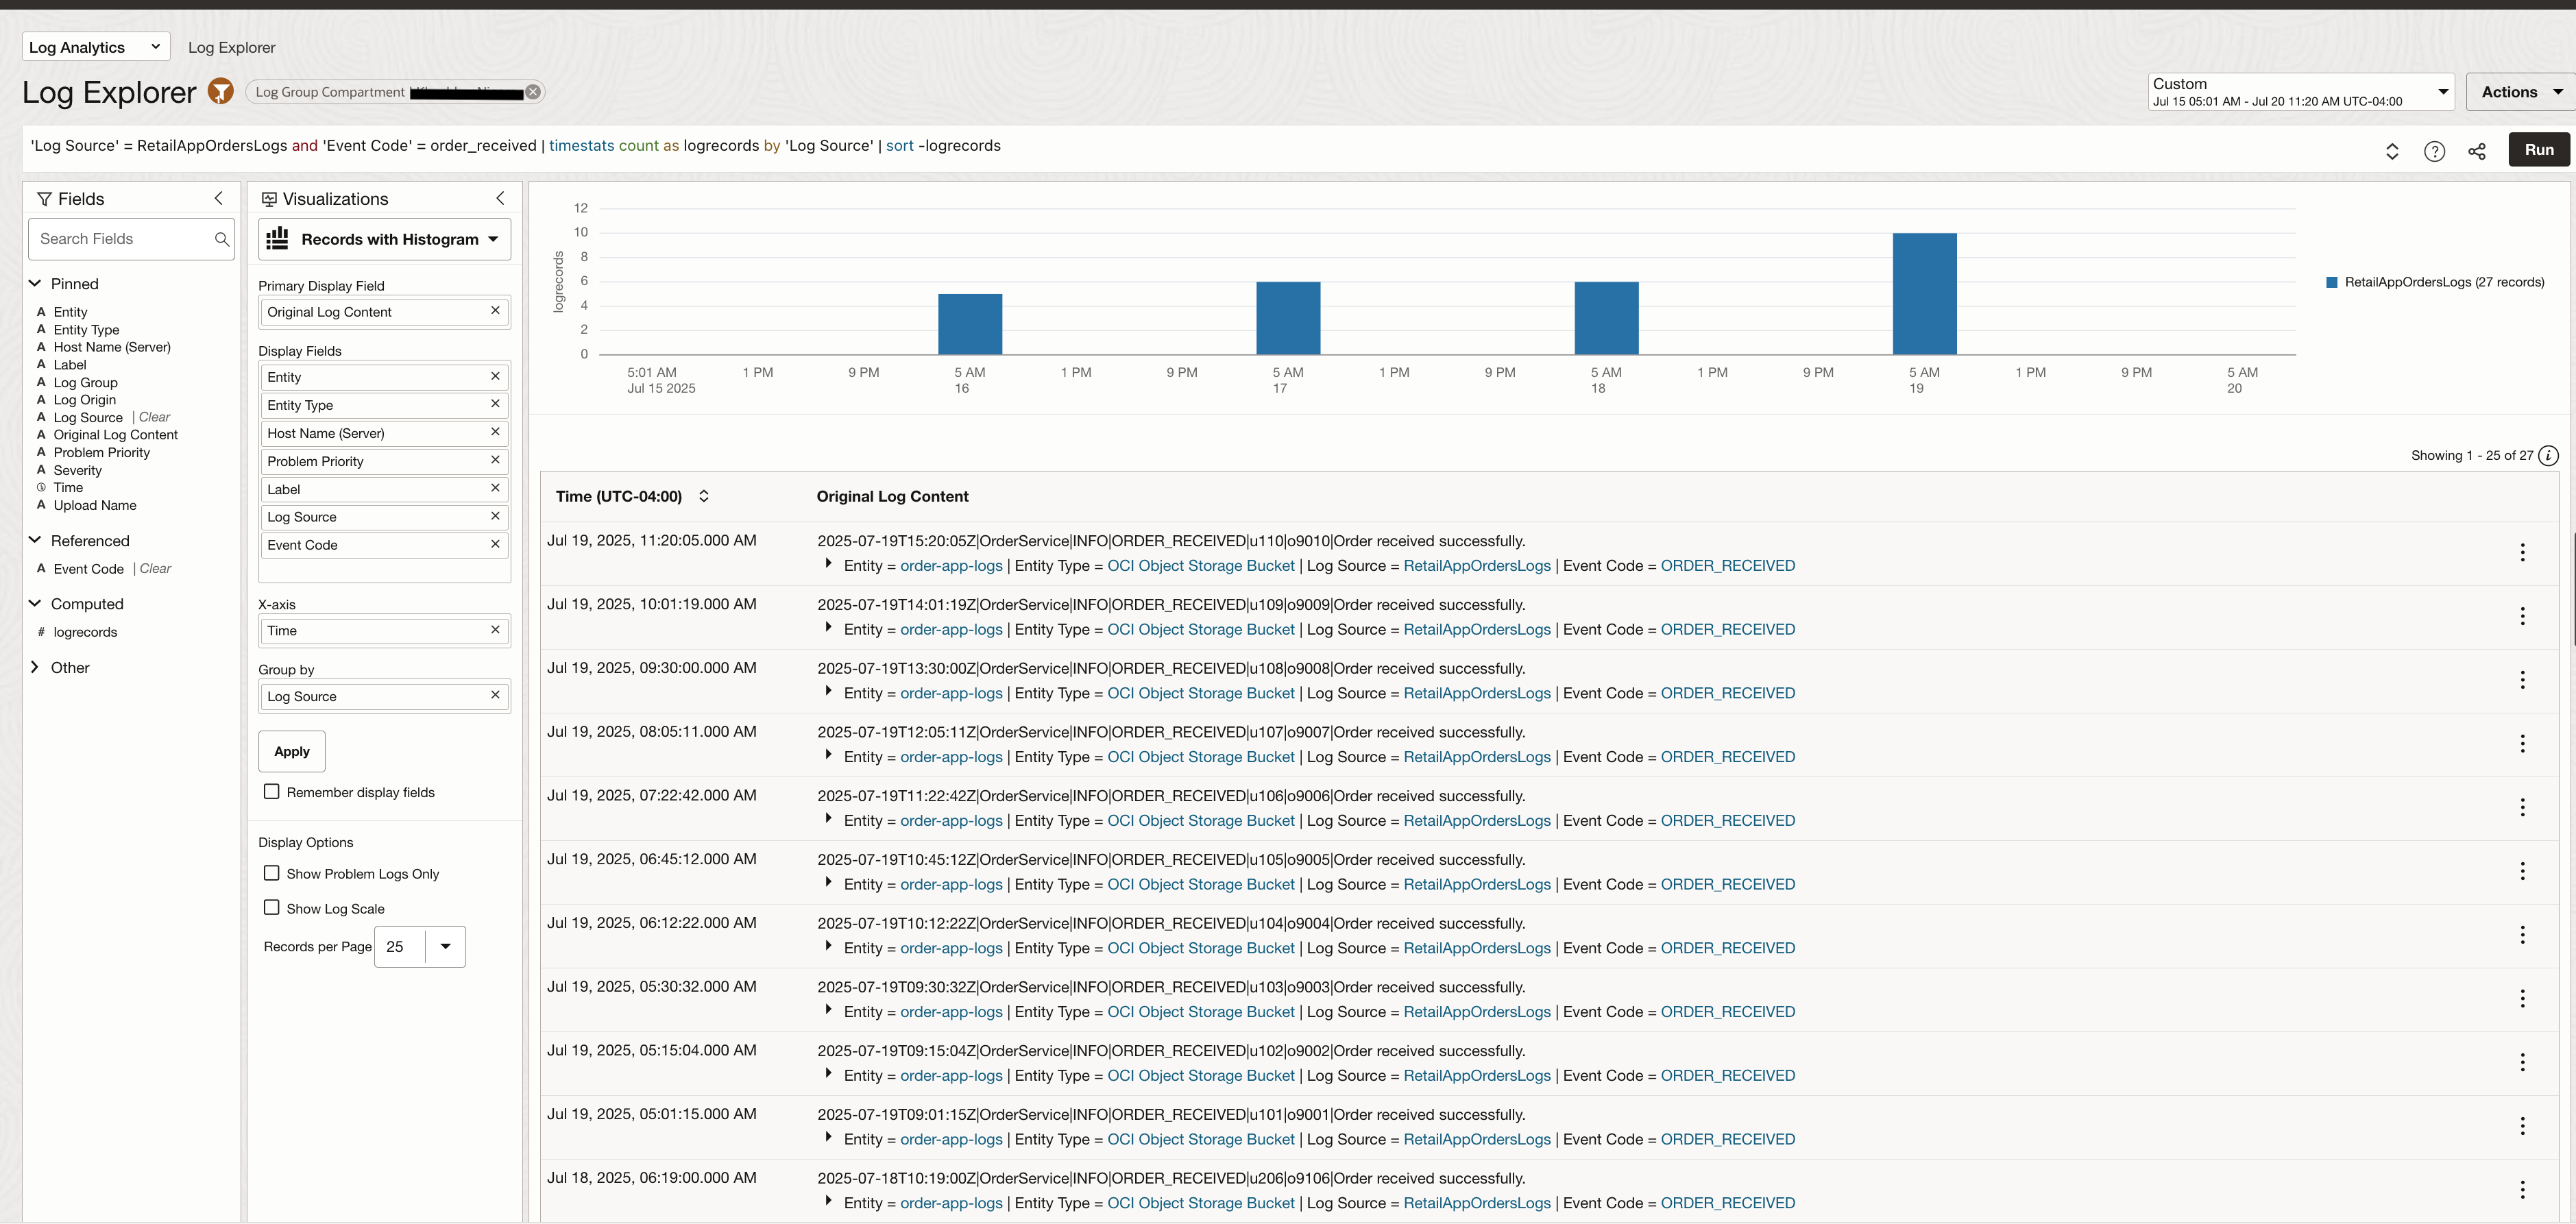
When Event Code = order_received is selected the logs will be filtered
Leverage Machine Learning based Visualizations
With the Machine Learning-based visualization called Cluster, you can quickly view log events grouped into meaningful clusters. This is done using semantic similarity between log messages, allowing you to detect recurring patterns, anomalies, or outliers — even if the exact wording in the logs differs.
This is especially useful when debugging failures or scanning high-volume logs, as it surfaces hidden trends without the need for predefined queries.
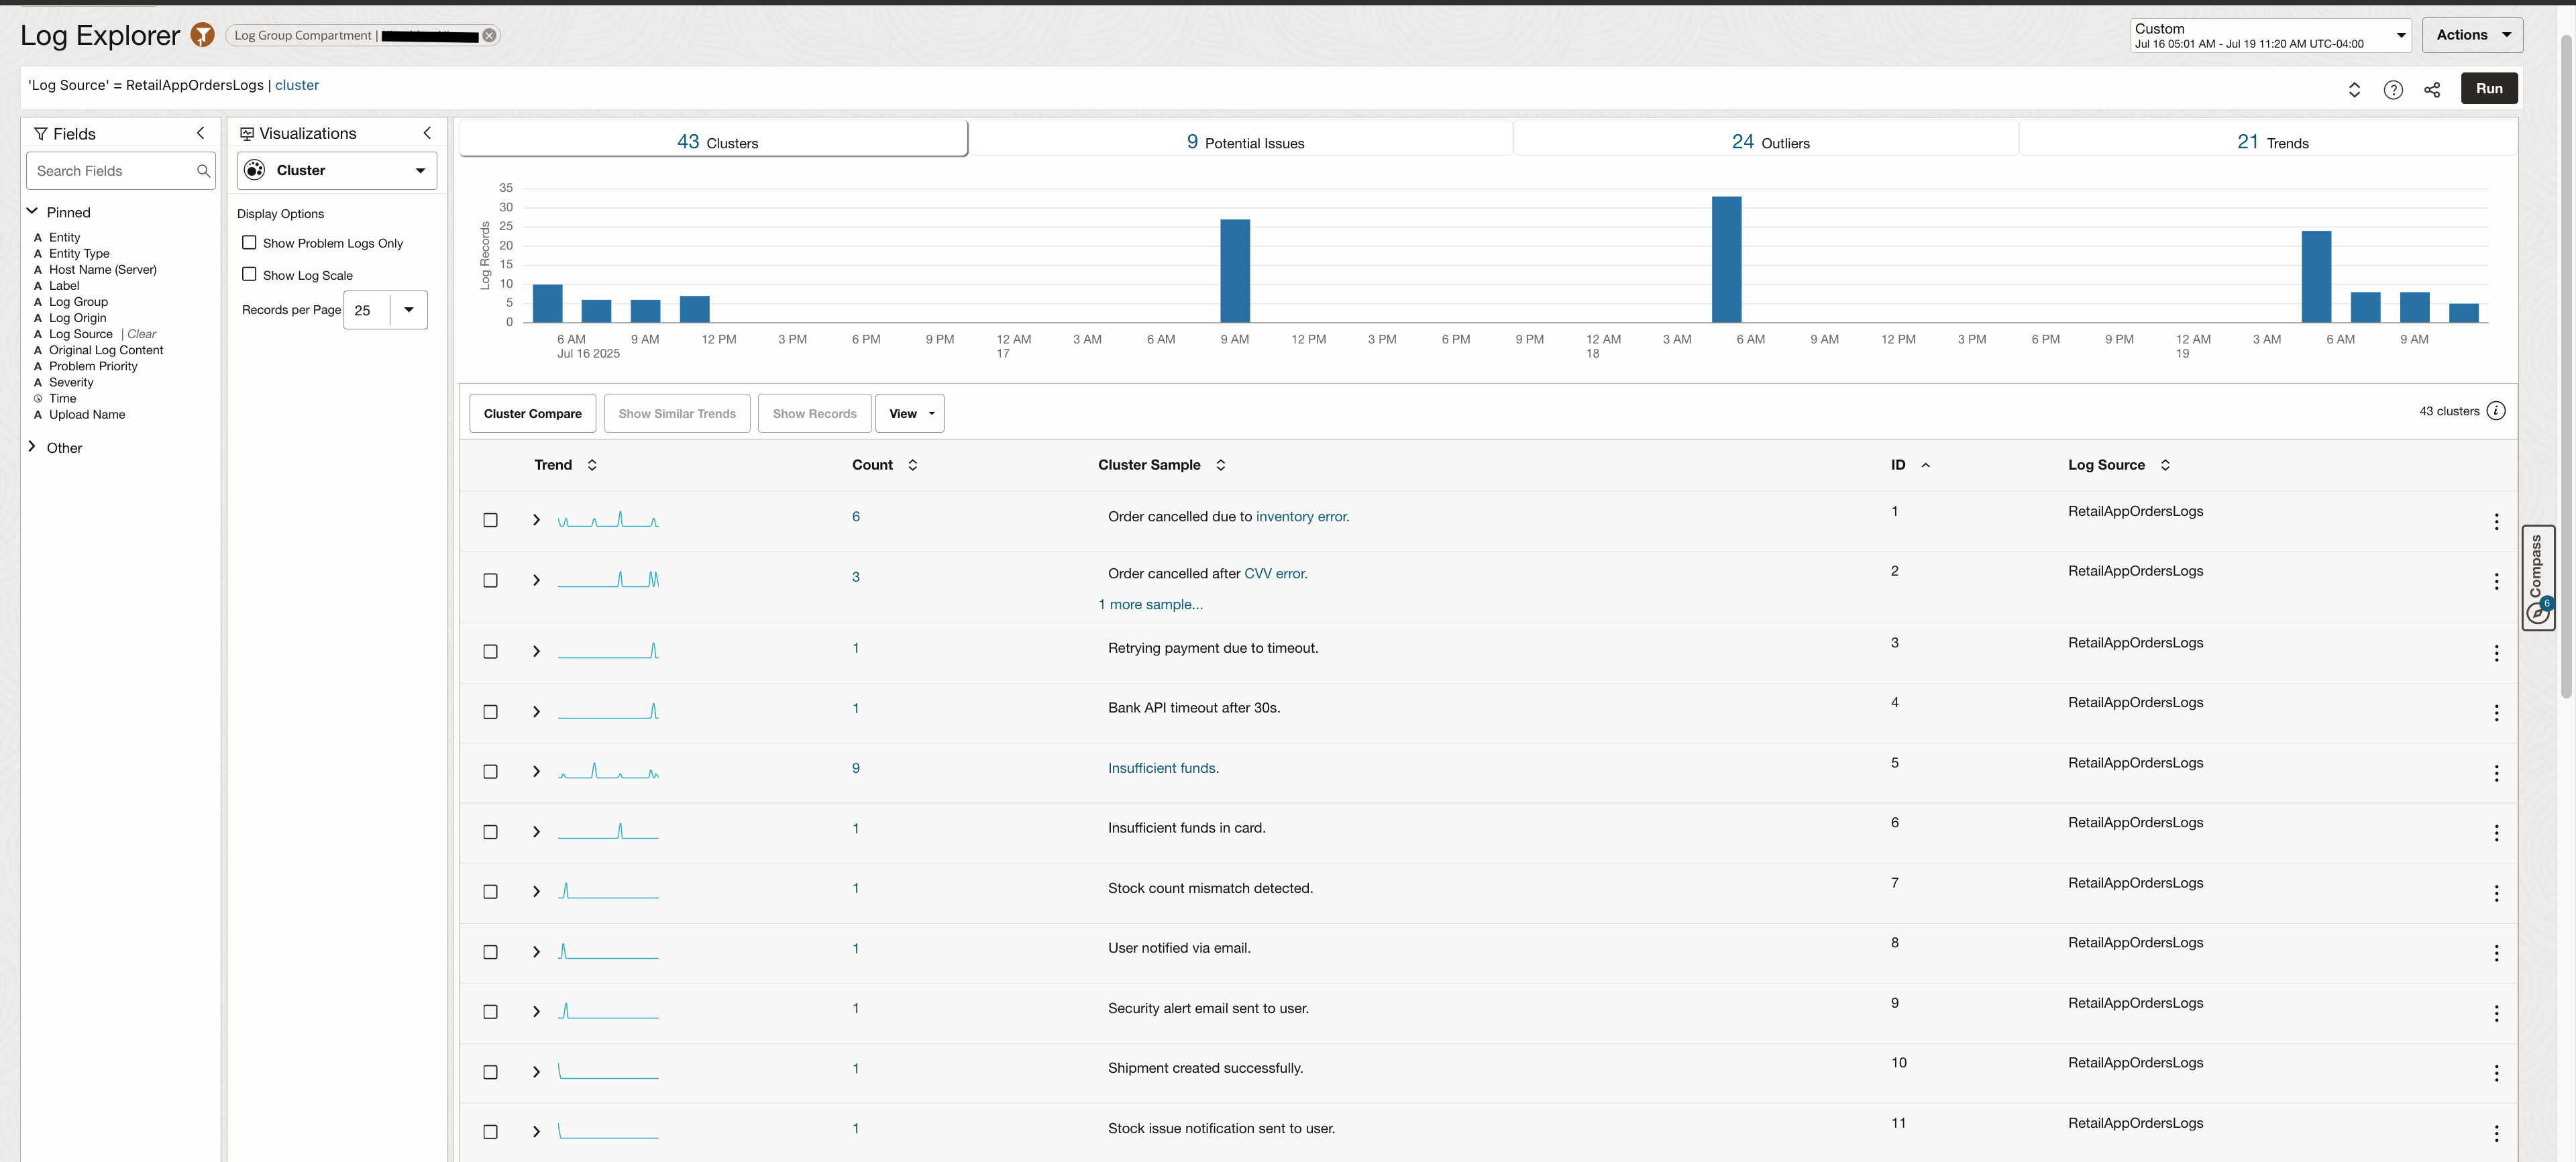
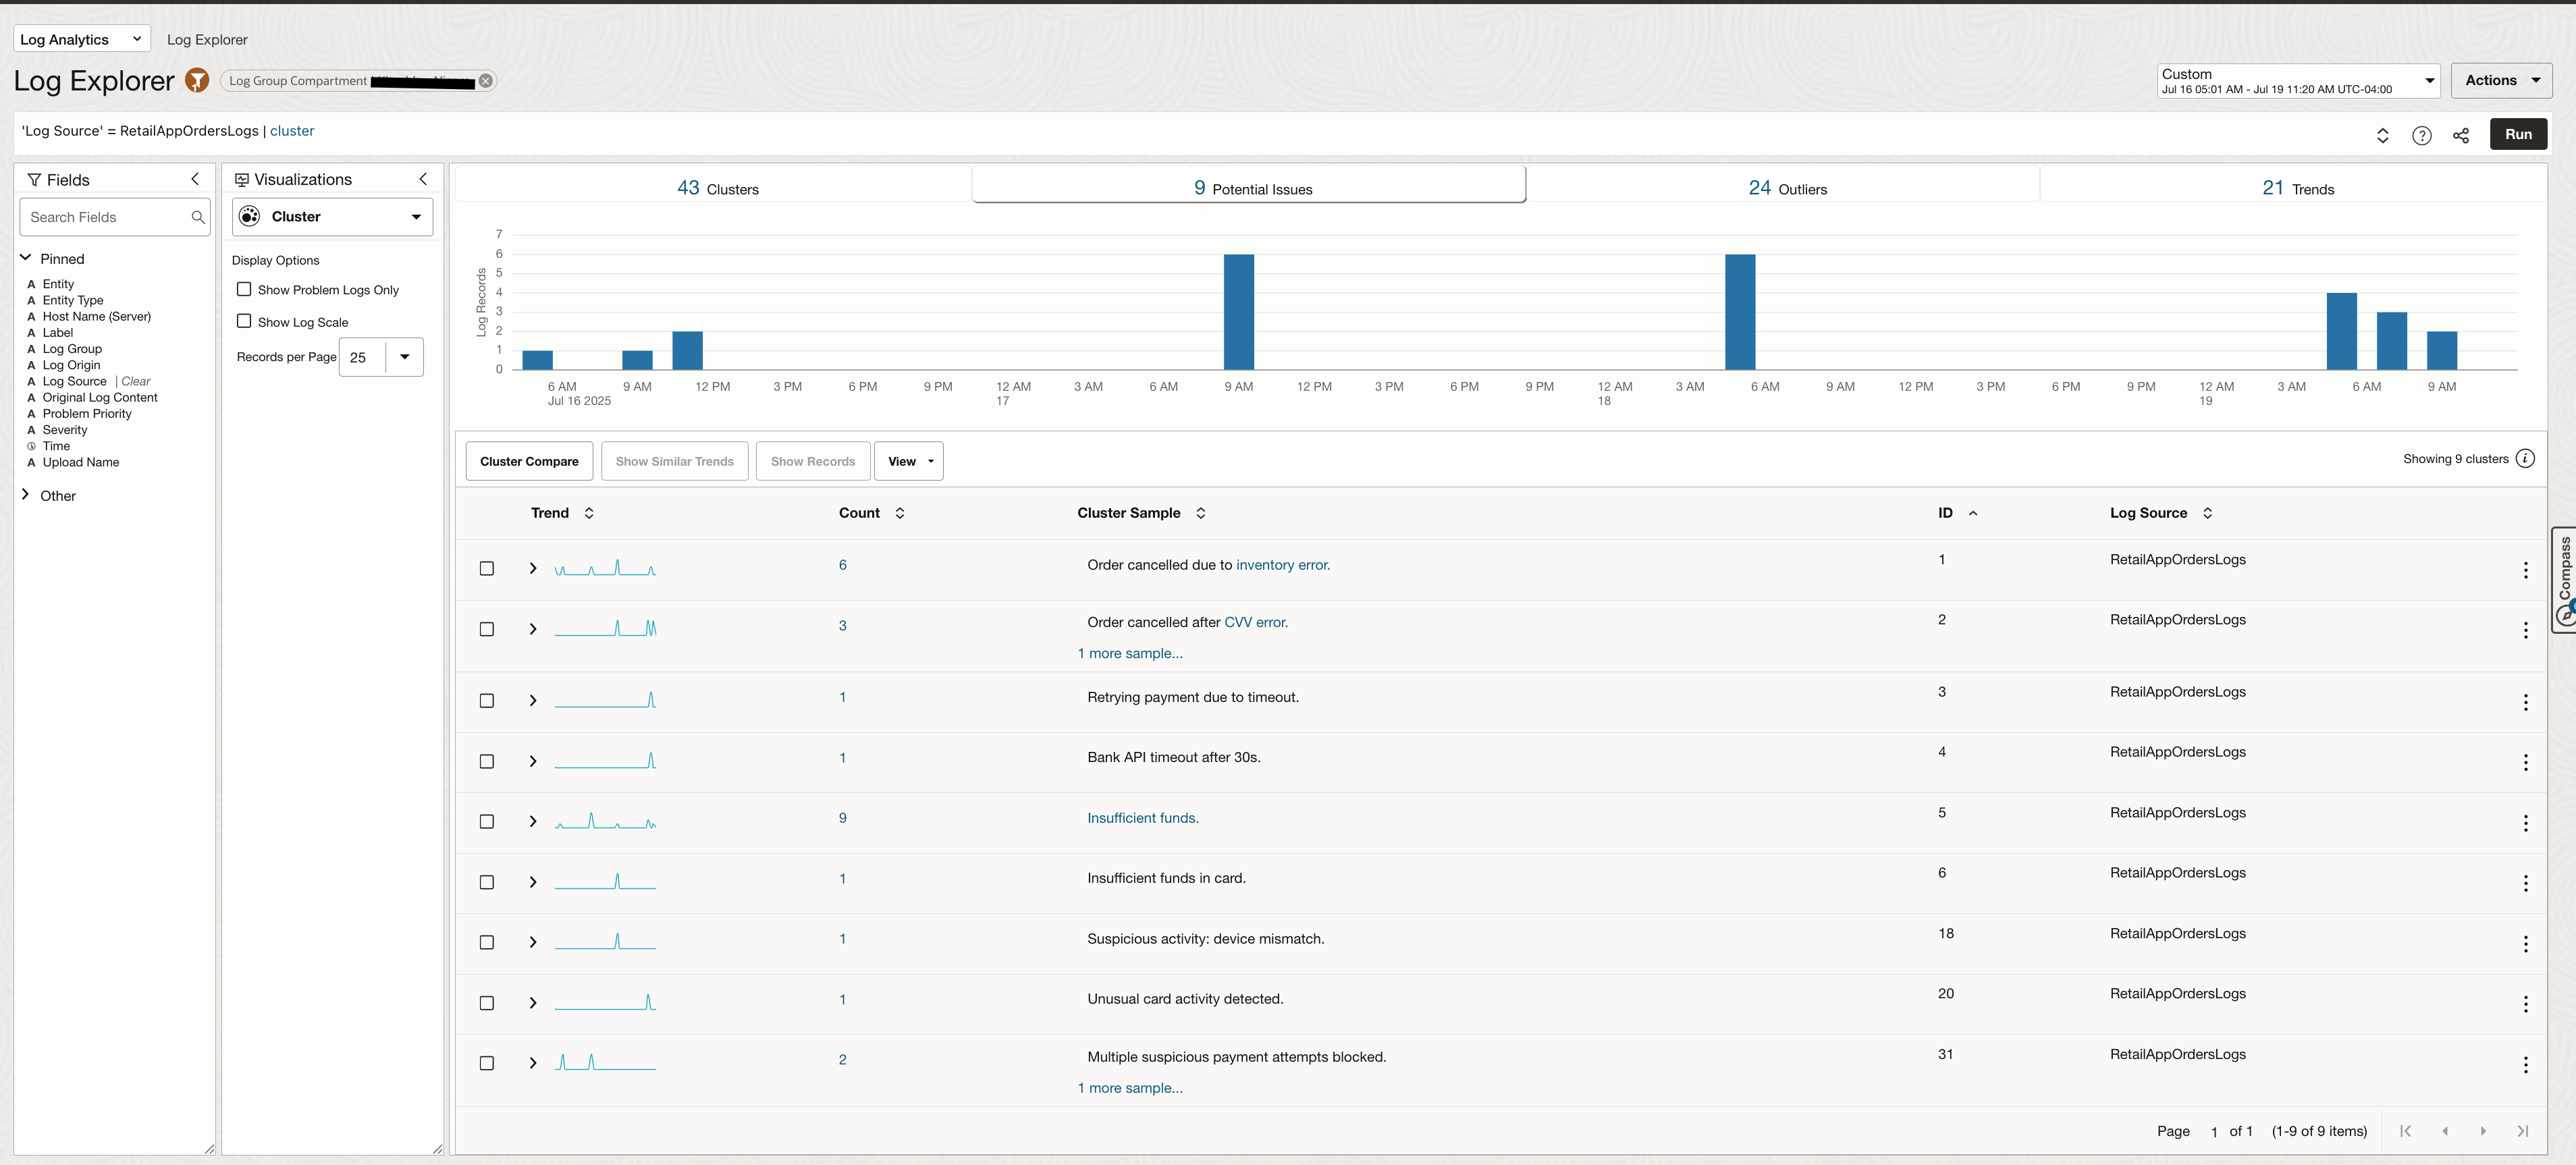
It also highlights logs Potential Issues in a separate tab.
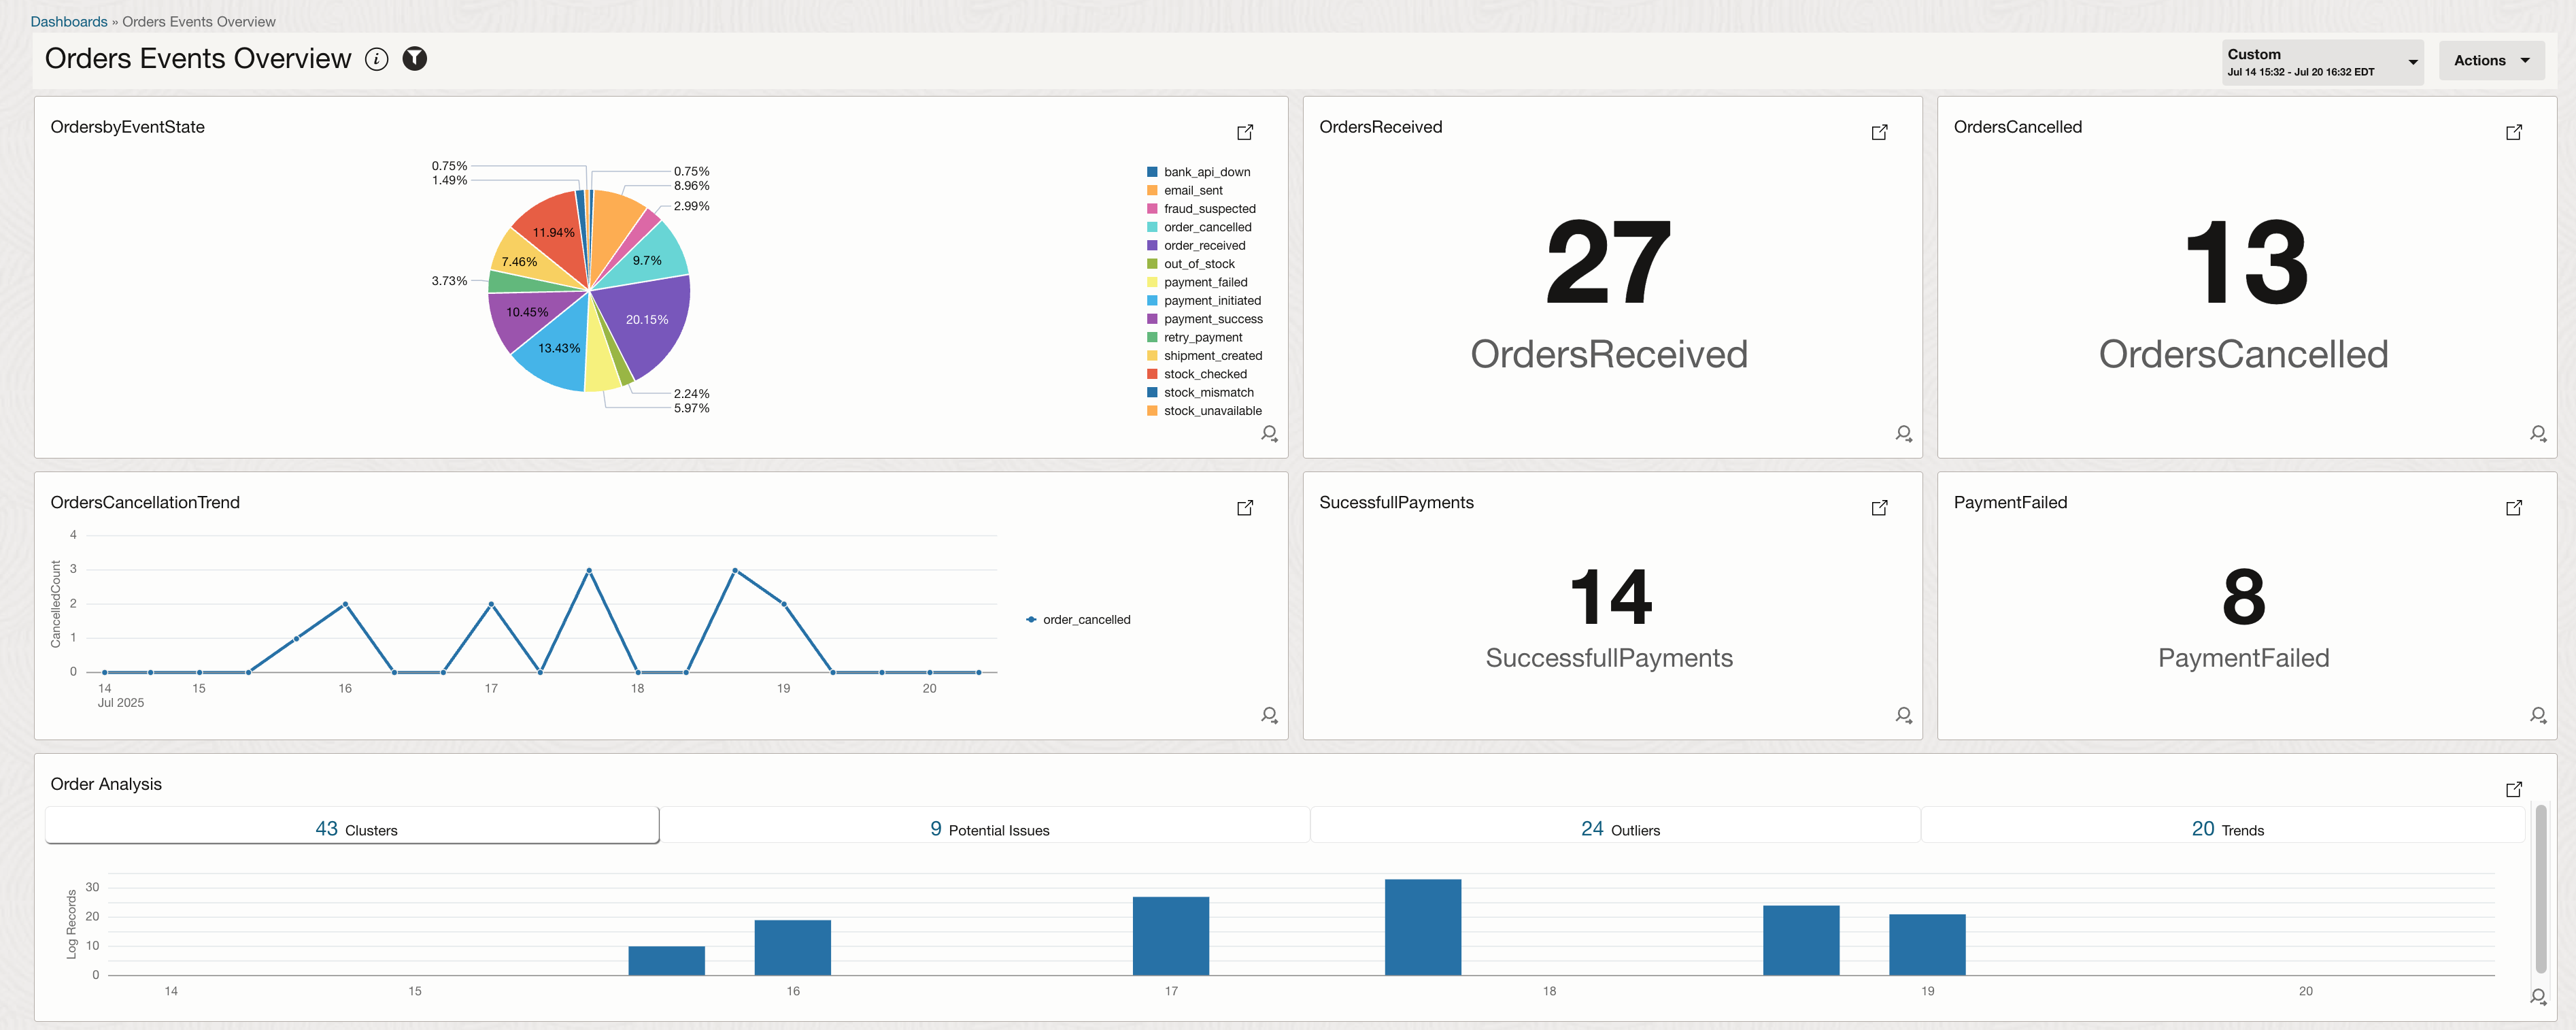
Widgets created with customer queries done on these logs can be put together to create a monitoring dashboard which updates in real time.
Analyze with LoganAI
LoganAI is the Artificial Intelligence capability in Oracle Log Analytics. LoganAI allows you to analyze your logs and log derived data using AI. Use LoganAI for AI-Powered Log Summarization, Actionable Follow-up Questions, User-Friendly Explanations.
You need to have the following pre-requisites set up.
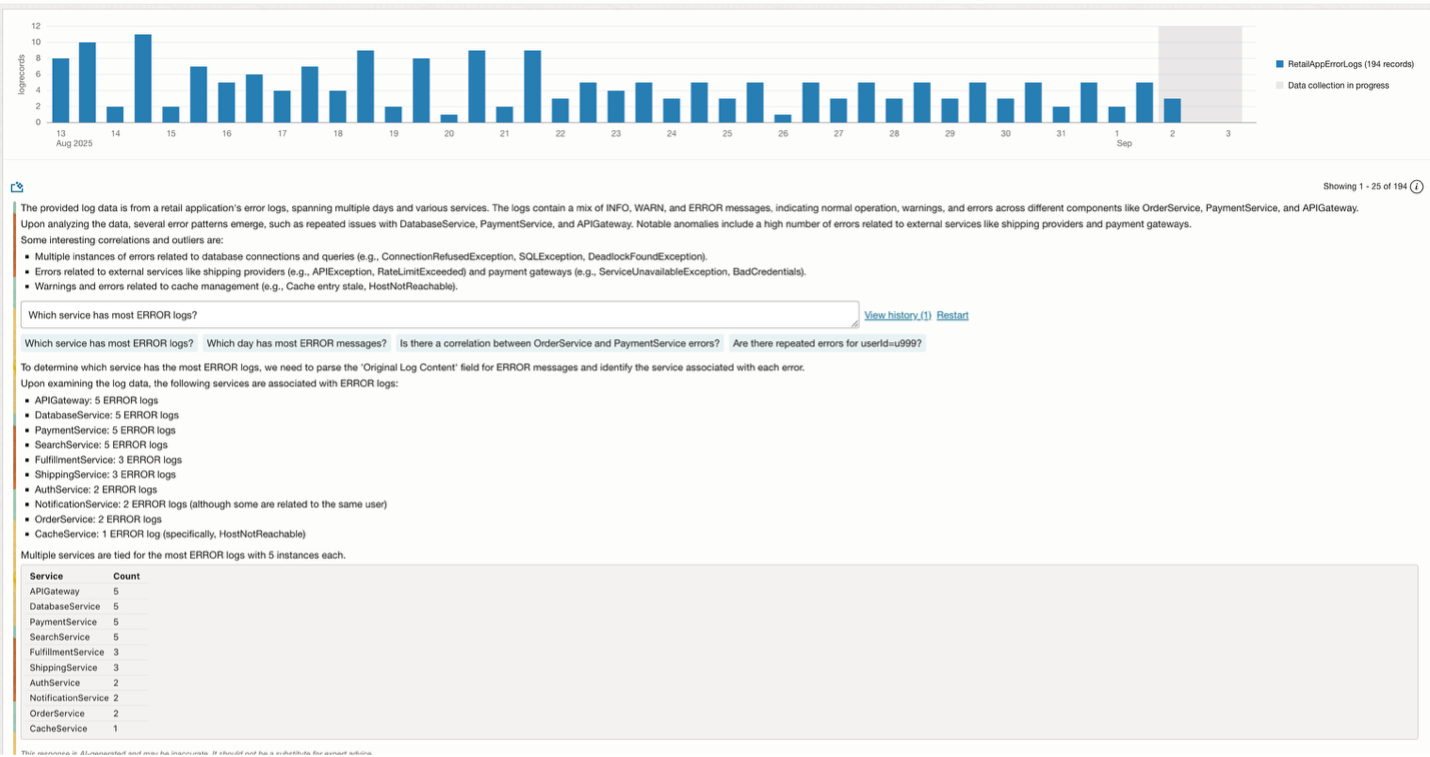
LoganAI can help you give a summary of logs data which is helpful when there is a lot of log data to go over. It also suggests follow-up questions to select which can further help in refining the context of the logs. The image below shows running LoganAI on application error logs. It summarizes what we see in these logs and answers a follow up question on which service shows the most number of errors.
If you restart the chat, you can find another response as shown here. You can select one of the follow up questions to get further explanation on specific logs.
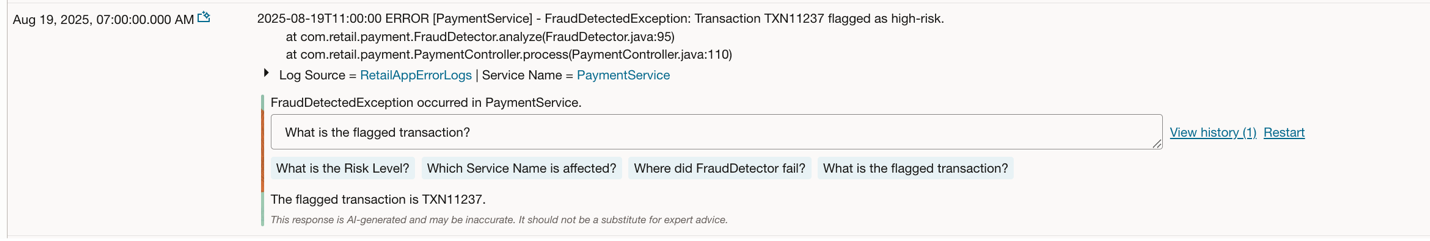
You can choose to see explanation of a particular log by using LoganAI on just one log entry.
Creating Alerts using Detection Rule and Alarms
Any custom search done on the logs can also be saved to create a Detection Rule. This rule runs at a defined frequency and looks for specific patterns or events in the log data. When a matching log entry is found, a metric data point is emitted to the OCI Monitoring service.
Once these metrics are available in Monitoring, you can use them to:
- Create alarms
- Trigger notifications
To create a Detection Rule:
- Navigate to Observability & Management → Administration → Detection Rule
- Click on Create Detection Rule
- Select Search Detection Rule, then provide:
- A name
- The log search query
- Frequency (how often it runs)
- Target details for metric emission
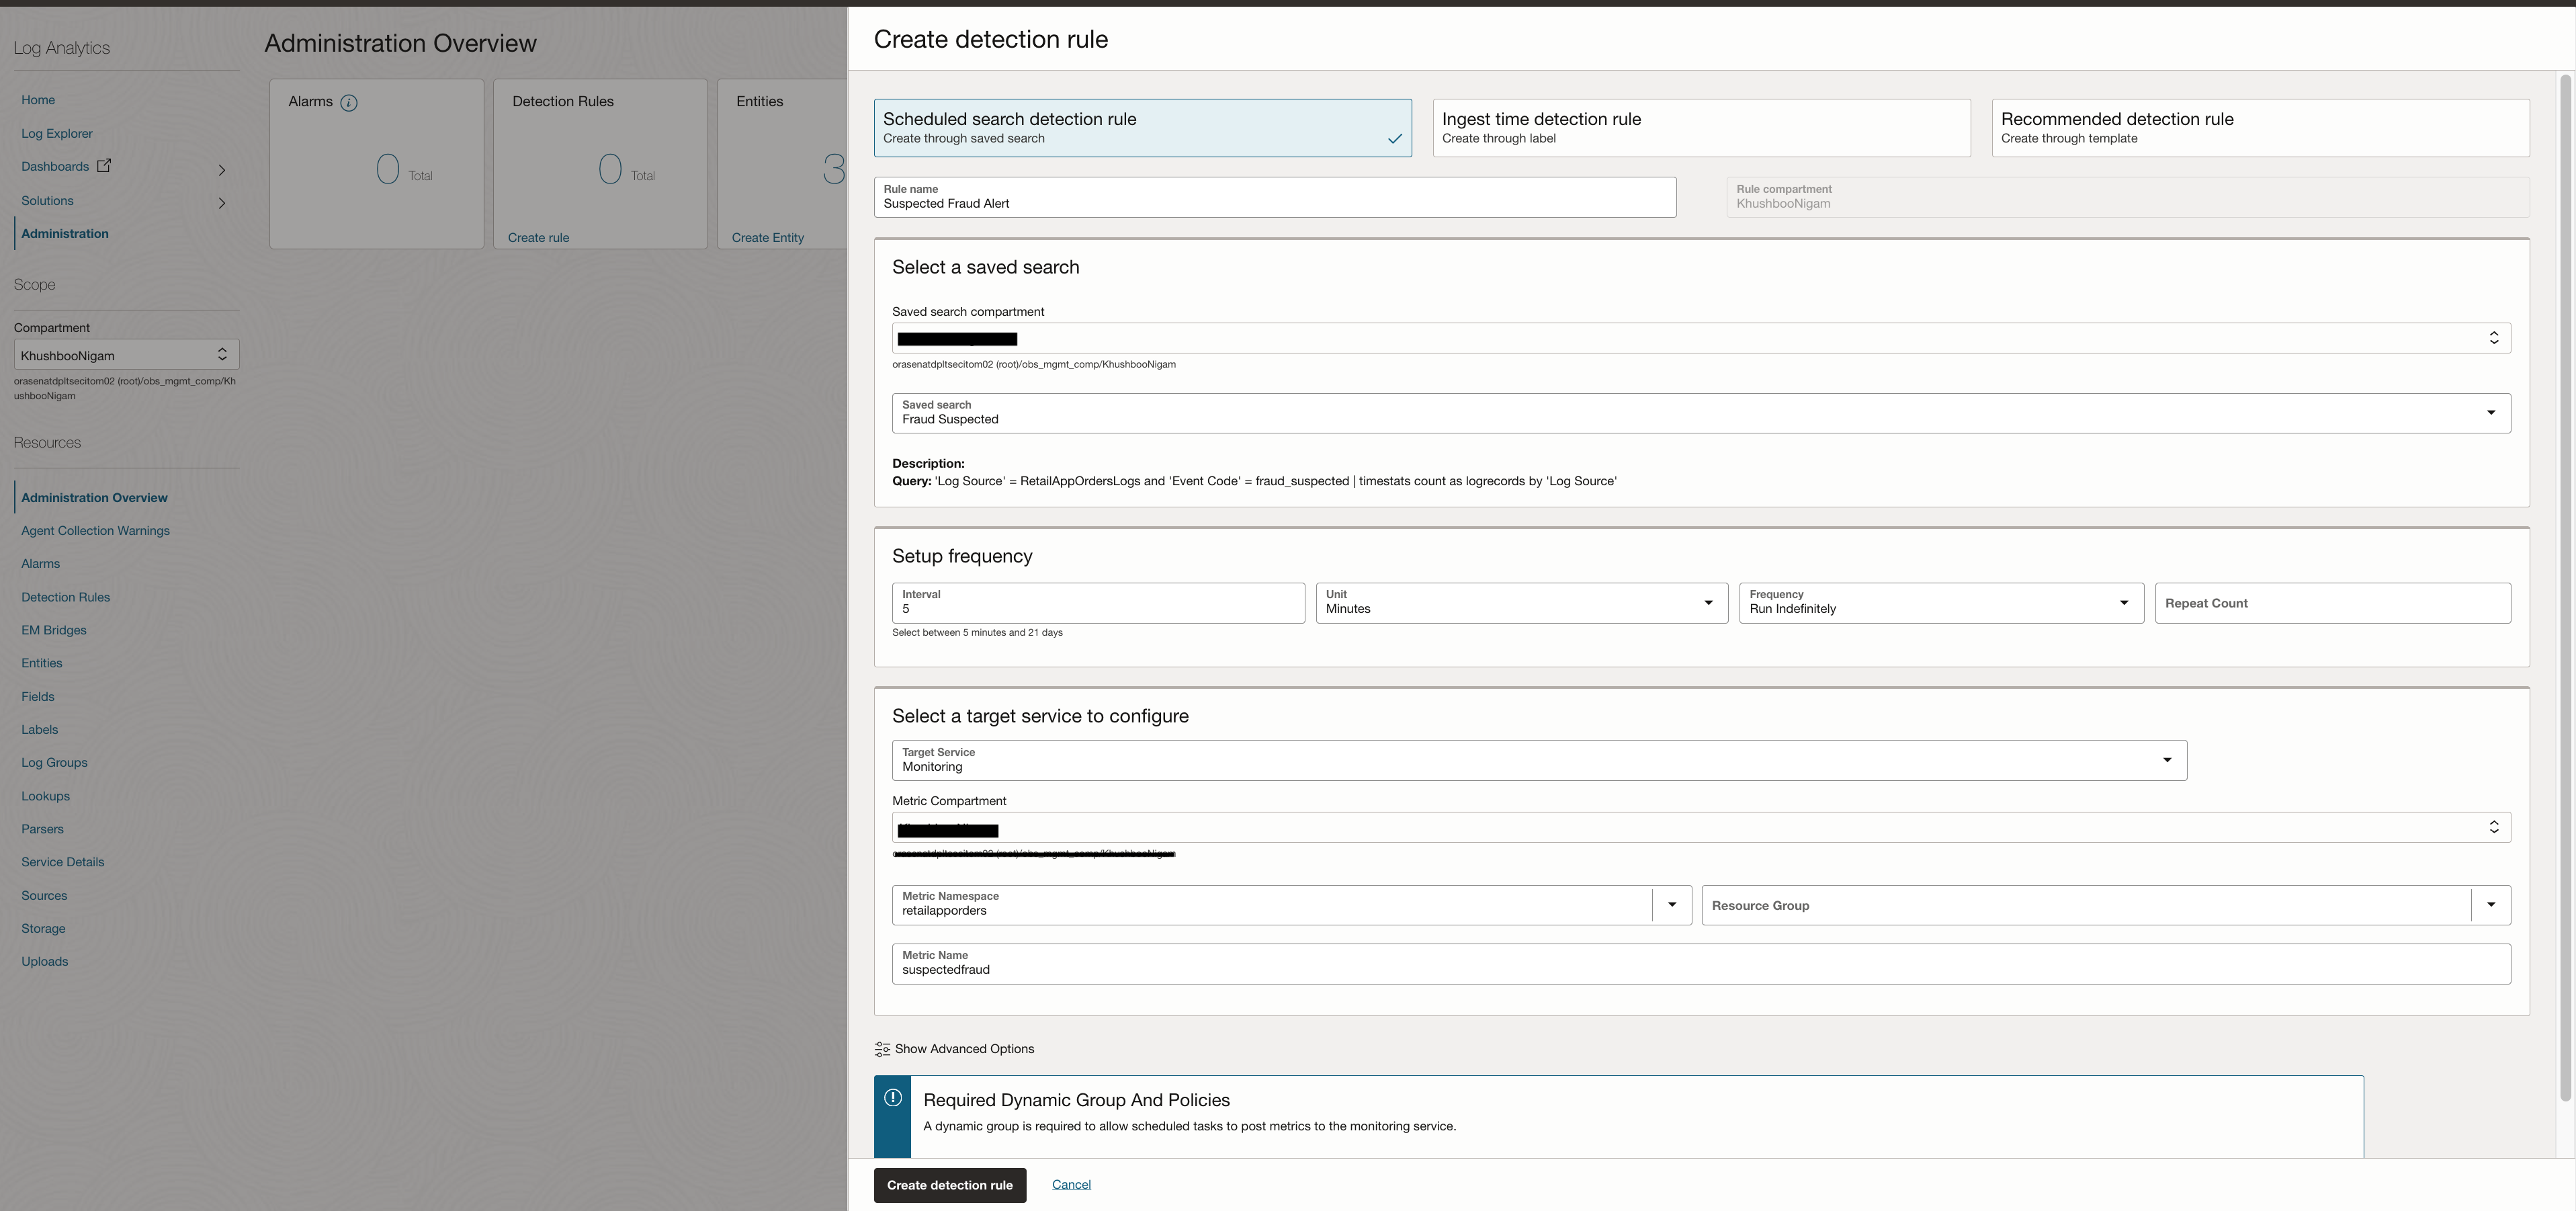
The screenshot below shows an example of detection rule set on saved search which looks for event code = fraud_suspected. This rule combined with Alarms can send alerts when any such transaction is noted.
Conclusion
By extending OCI Log Analytics to handle both structured and unstructured logs, you can bring observability to all layers of your application, not just the standard system logs. With custom parsers—Delimited for structured events like order status and Regex for complex, multi-line error traces—you can transform raw log files into meaningful, queryable fields. Adding enrichment rules and labels further enhances context, while detection rules and alarms make it possible to act on critical events proactively instead of reactively.
Beyond parsing and alerting, the true power comes in analysis. Using filters and visualizations such as Cluster, you can quickly identify recurring patterns or anomalies without needing to craft complex queries. With LoganAI, log investigation becomes even faster—allowing you to summarize, correlate, and understand issues in plain language, dramatically reducing time-to-insight during troubleshooting.
As enterprise systems become increasingly distributed, hybrid, and complex, this combination of structured ingestion, automated detection, and AI-powered analysis creates a resilient and intelligent monitoring pipeline. OCI Log Analytics provides the flexibility to integrate diverse log types, the depth to enable rich analytics, and the intelligence of LoganAI to accelerate root cause analysis—all essential capabilities for modern application operations.