Introduction
Monitoring the health and compliance of your Oracle Cloud Infrastructure (OCI) databases requires visibility into key operational metrics such as backup and patching status. While OCI exposes this information through its comprehensive REST APIs, aggregating and analyzing these metrics across a fleet of databases can be complex and time-consuming. In this blog post, we’ll show you how to leverage Oracle Log Analytics’ REST API Log Source to automatically collect database metadata, enabling you to build centralized dashboards for real-time and historical insights into your backup and patching operations.
Solution Design
Oracle Database Backup and Recovery information is available from three areas:
- Recovery Service metrics are available from OCI Monitoring service metrics
- Database backup information is available from the OCI Database service REST API
Oracle Log Analytics enables you to collect OCI Monitoring metrics by configuring a REST API Log Source that queries the OCI Monitoring service endpoints. This approach allows you to ingest time-series metrics such as backup job status, backup duration, and success/failure rates directly into Log Analytics for centralized analysis and dashboarding.
Reference Architecture:
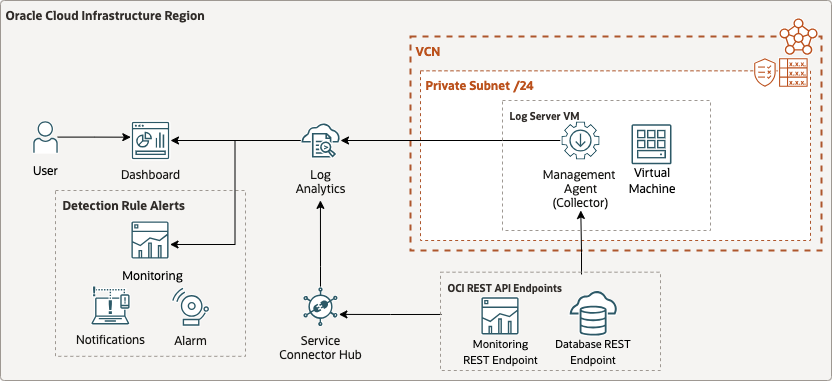
In the part 1 of the blog series, we will go over the details of collecting OCI monitoring metrics into Log Analytics. We’ll implement a comprehensive monitoring solution that combines both OCI Monitoring metrics and Database service API data to provide complete visibility into database backup and recovery operations. This approach allows us to:
- Collect Recovery Service Metrics: Leverage OCI Monitoring service to gather metrics about backup job status, success rates, and performance indicators
- Gather Database Metadata: Use Database service REST APIs to collect detailed information about database configurations, backup policies, and current status
- Centralized Analysis: Aggregate all data in Oracle Log Analytics for unified dashboards and historical trend analysis
Prerequisites
- Set up service policies for Oracle Cloud Log Analytics. See Enable Access to Log Analytics and Its Resources and Prerequisite IAM Policies in Oracle Cloud Infrastructure Documentation.
- Install the Management Agent on a client host VM which has http or https access to your endpoint server, we will use this host for Log Source entity association. See Set Up Continuous Log Collection From Your Hosts.
- On Unix-based hosts, the user that installs management agent is mgmt_agent for the manually installed management agent, and oracle-cloud-agent when the management agent is a plugin enabled with Oracle Cloud Agent.
Implementation Overview
Let’s walk through the implementation process for collecting historical OCI audit logs using the REST API ingestion method.
- Create a dynamic group for the Management Agent to enable resource principal authentication
- Configure IAM policies to grant the dynamic group access to audit logs and Log Analytics resources
- Create a host entity in Log Analytics to represent the Management Agent
- Configure a custom log source and parser for historical OCI audit logs
- Associate the Management Agent with the log source using resource principal authentication
- Verify Ingestion and Use Security Fundamentals Dashboards
Step 1: Create dynmaic group for the Management Agent
-
Create Dynamic Group for the Management Agent installed on the VM or enabled via Oracle Cloud Agent:
- Navigate to the OCI Console
- Go to Identity & Security > Domains > Default domain > Dynamic Groups
- Click Create Dynamic Group
- Enter a name (e.g., ManagementAgentDynamicGroup)
- Enter a description (e.g., Dynamic group for Management Agents in specific compartment)
- In the matching rules section, add the following rule:
ALL {resource.type='managementagent', resource.compartment.id='ocid1.compartment.oc1..aaaaaa[REDACTED]'} - Click Create
-
Create OCI policy for management agent dynamic group resource principal
- Navigate to the OCI Console
- Go to Identity & Security > Policies
- Click Create Policy
- Enter a name (e.g., ManagementAgentAuditLogPolicy)
- Enter a description (e.g., Policy to allow Management Agent to read audit logs and manage log groups)
- Select the compartment (typically the root compartment or tenancy)
- In the policy builder section, add the following policy statements:
allow dynamic-group ManagementAgentDynamicGroup to manage log-groups in tenancy allow dynamic-group ManagementAgentDynamicGroup to use log-content in tenancy allow dynamic-group ManagementAgentDynamicGroup to {AUDIT_EVENT_READ} in tenancy allow dynamic-group ManagementAgentDynamicGroup to use metrics in tenancy allow dynamic-group ManagementAgentDynamicGroup to {LOG_ANALYTICS_LOG_GROUP_UPLOAD_LOGS} in tenancy - Click Create
Note: The policy statements above use the dynamic group name ManagementAgentDynamicGroup that we created in the previous step. These policies grant the necessary permissions for the Management Agent to read audit logs and manage log groups within the tenancy.
Step 2: Update the Agent Configuration
To enable the Management Agent to use the REST API for log collection, you need to update its configuration properties:
-
SSH to the VM host where the Management Agent is installed:
ssh opc@<your-vm-ip-address> -
Switch to the root user:
sudo su - -
Navigate to the agent configuration directory:
-
If you’re using Oracle Cloud Agent:
cd /var/lib/oracle-cloud-agent/plugins/oci-managementagent/polaris/agent_inst/config/ -
If you manually installed the Management Agent (standalone installation):
cd /opt/oracle/mgmt_agent/agent_inst/config
-
-
Open the emd.properties file for editing:
vi emd.properties -
Append the following two parameters to the bottom of the file:
loganalytics.rest_api.enable_oci_api=true
loganalytics.rest_api.report_interval=600
Note: The
loganalytics.rest_api.report_intervalparameter sets the collection interval in seconds. The default is 300 seconds (5 minutes), but in this example, we’ve set it to 600 seconds (10 minutes). You can adjust this value based on your requirements. -
Save the file and exit the editor.
-
Restart the Management Agent to apply the changes.
-
If you’re using Oracle Cloud Agent:
systemctl restart oracle-cloud-agent -
If you manually installed the Management Agent (standalone installation):
systemctl restart mgmt_agent
-
Step 3: Verify the Monitoring Metrics in OCI Monitoring Metrics Explorer
- Navigate to OCI Monitoring > Metrics Explorer
- Select the Metrics Namespace: oracle_oci_database NOTE: oracle_oci_database metric namespace is ONLY available when you enable OCI Database Management Service for your database.
- Select the Metrics: BackupSize or BackupDuration
- Click Update Chart
- Verify the metrics are being collected
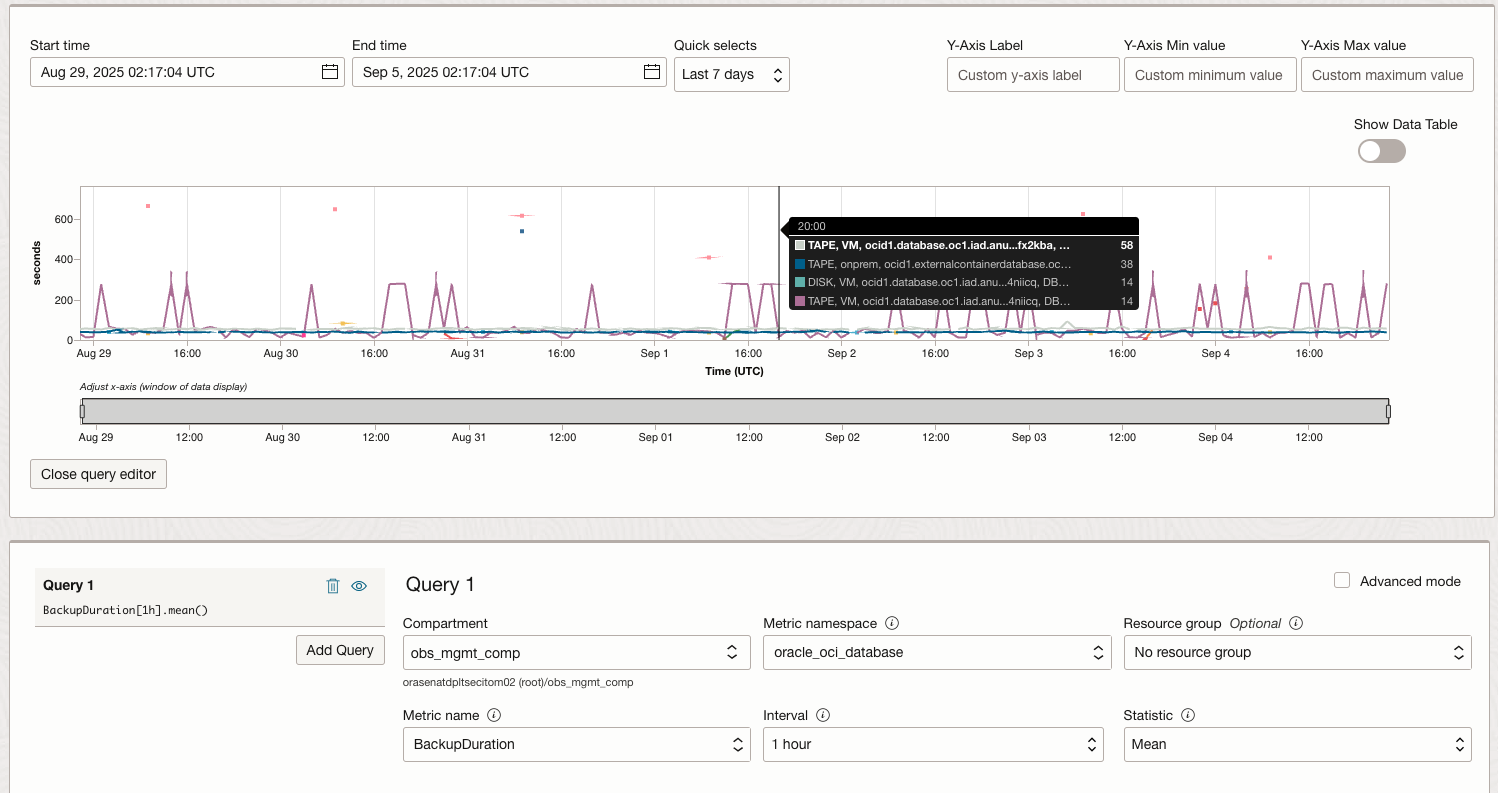
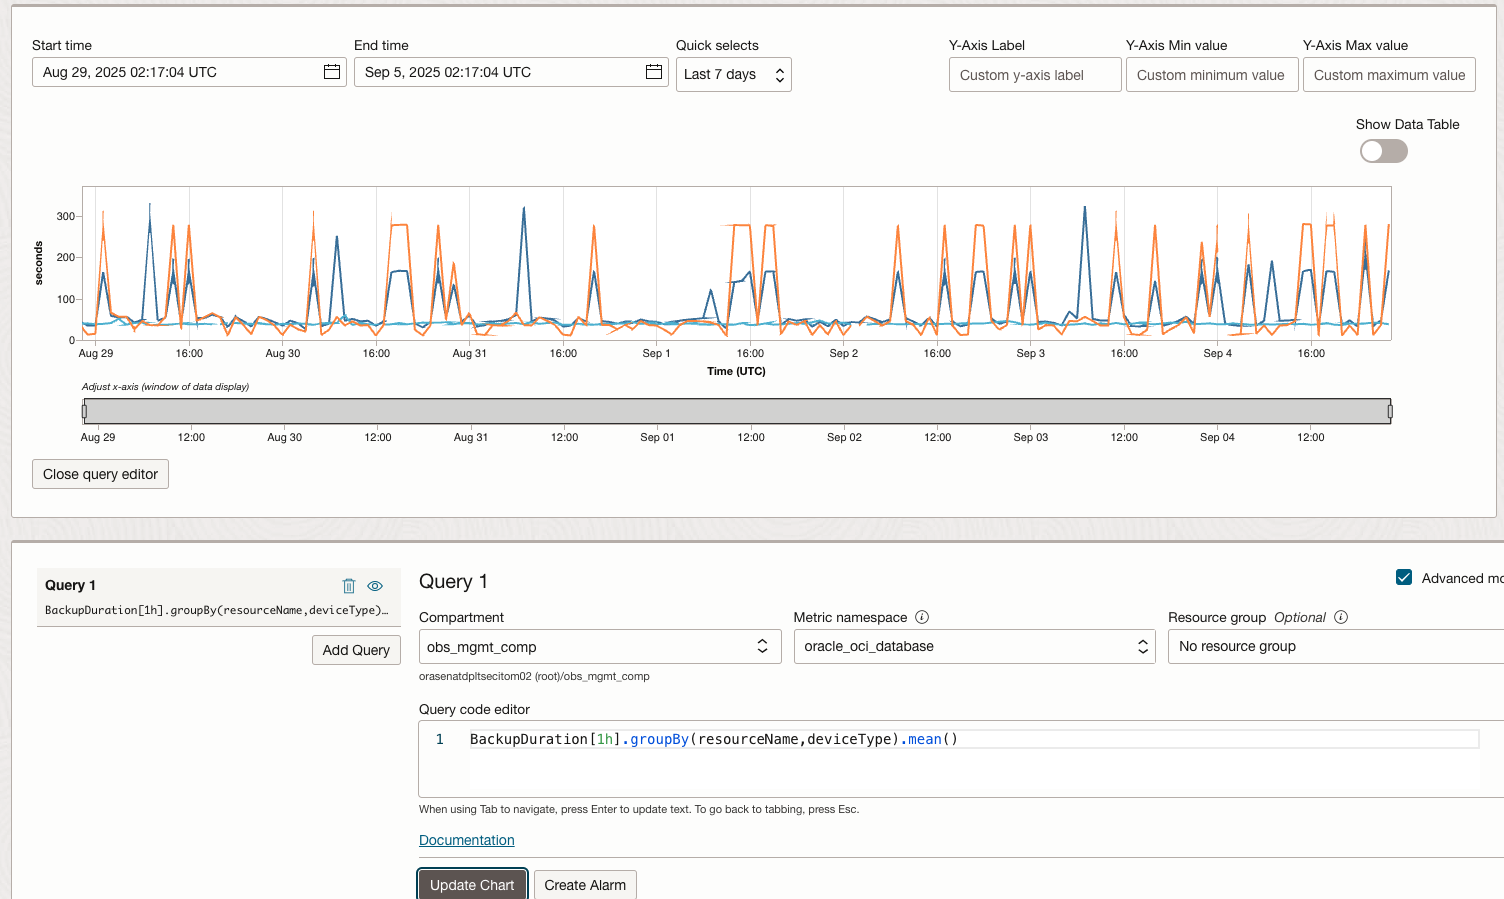
Or you can use the Advanced Mode to create a custom chart with the metrics via the MQL (Monitoring Query Language) query.
Step 4: Configure the REST API Source for OCI Monitoring Service and Autonomous Recovery Service REST API endpoint
– OCI Monitoring Service REST API endpoint
NOTE: The OCI Monitoring Service REST API endpoint reference doc: OCI Monitoring Service REST API.
-
Access Log Analytics Administration Console
- Log in to the Oracle Cloud Console.
- Navigate to Observability & Management > Log Analytics.
- Click on the Administration tab.
-
Create a New Log Source
- In the left navigation pane, select Sources.
- Click Create Source.
-
Configure Source Details
- Name: Enter a descriptive name for your source (e.g., “OCI_Backup_Duration”).
- (Optional) Download OCI_Backup_Duration example log source directly from Github repo: here, and import the Log Source by following the doc
- Source Type: Select REST API.
- Entity Type: Choose “Host(Linux)” as the Entity Type.
- Parser: Select “OCI_Backup_Duration” as the Parser.
-
Define REST API Endpoint
- In the Endpoints tab, click Add log endpoint.
- Enter a name for the endpoint: db backup duration endpoint
- Enter the Log URL for the OCI Monitoring Service endpoint you want to collect metrics from.
- Example for OCI Monitoring Service SummarizeMetricsData endpoint:
https://telemetry.us-ashburn-1.oraclecloud.com/20180401/metrics/actions/summarizeMetricsData?compartmentId={COMPARTMENT_ID}
- Example for OCI Monitoring Service SummarizeMetricsData endpoint:
- HTTP Method: POST
- Request content type: JSON
- Request headers
- Accept: application/json
- Credentials
- Log credentials type: None
- POST Payload:
{ "namespace": "oracle_oci_database", "startTime": "{CURR_TIME-10m:yyyy-MM-dd'T'HH:mm:00.000}Z", "endTime": "{CURR_TIME:yyyy-MM-dd'T'HH:mm:00.000}Z", "query": "BackupDuration[1h].groupBy(resourceName,deviceType).mean()" } -
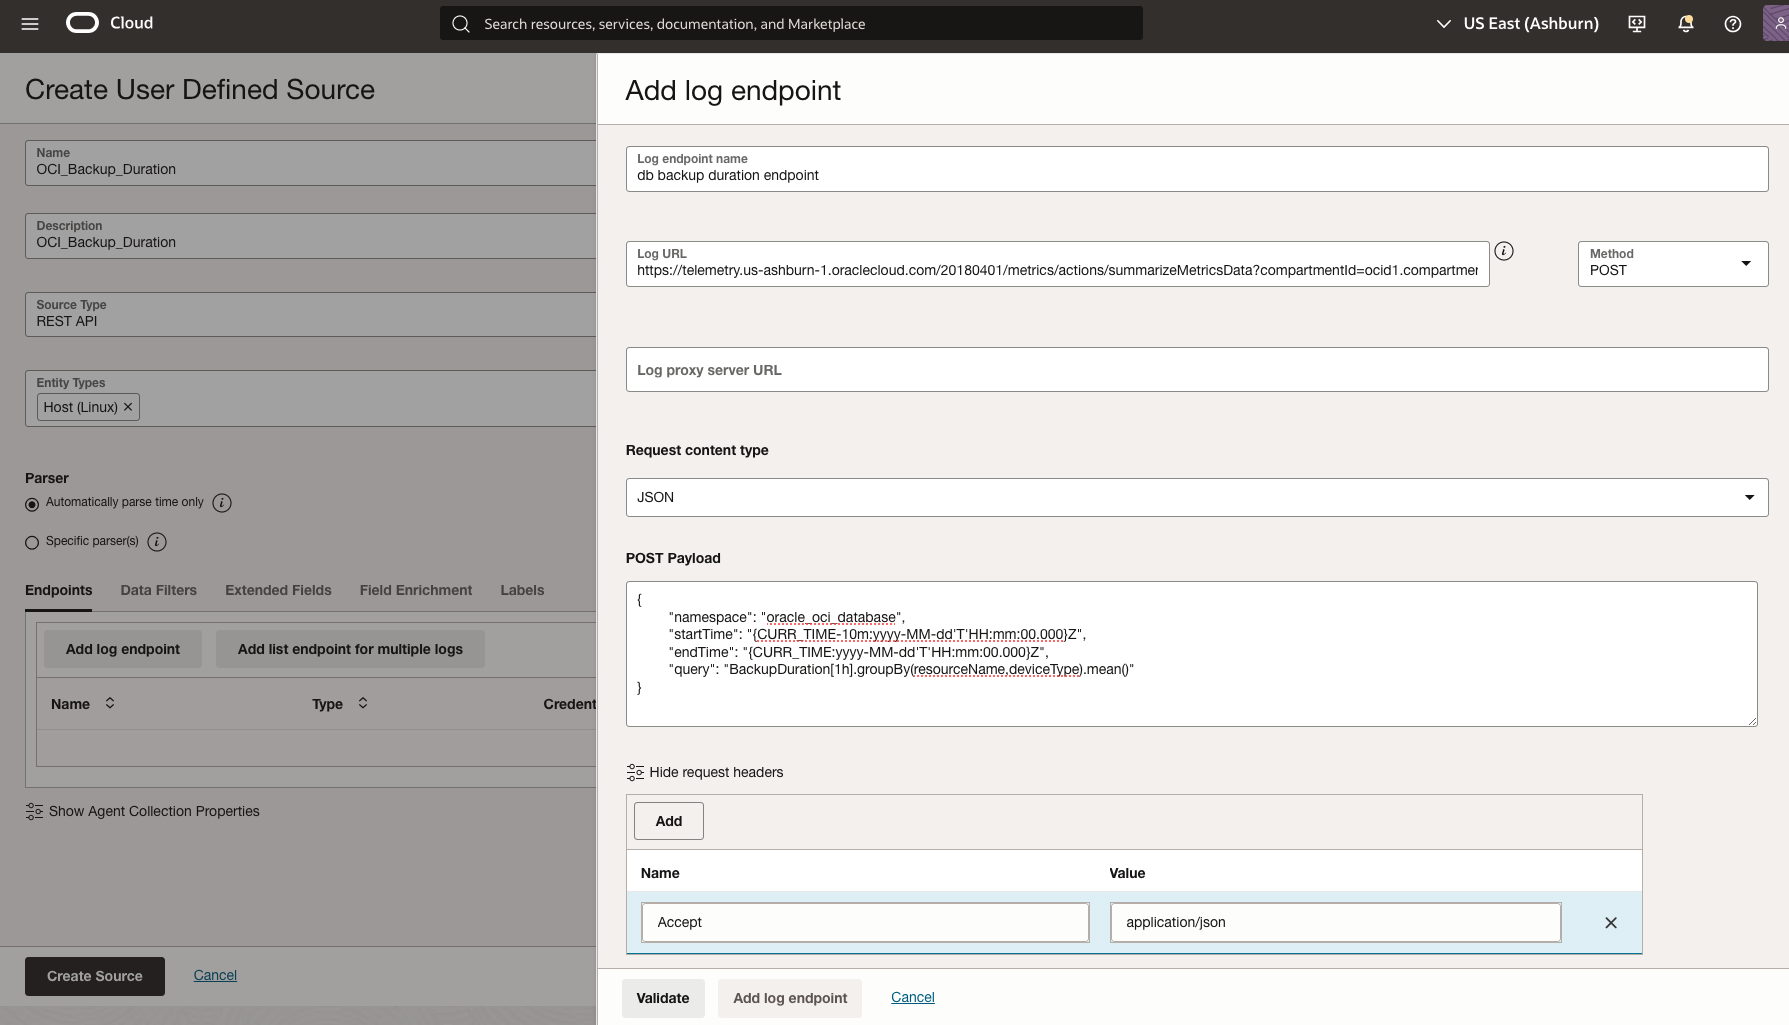
Figure 4: Configure the OCI Backup Duration logs source settings
-
Validate configuration and click Save changes
– Autonomous Recovery Service REST API endpoint To create an OCI Log Analytics REST API-based log source, follow these steps:
-
Access Log Analytics Administration Console
- Log in to the Oracle Cloud Console.
- Navigate to Observability & Management > Log Analytics.
- Click on the Administration tab.
-
Create a New Log Source
- In the left navigation pane, select Sources.
- Click Create Source.
-
Configure Source Details
- Name: Enter a descriptive name for your source (e.g., “OCI_DB_recovery_Logs”).
- (Optional) Download OCI_DB_recovery_Logs example log source directly from Github repo: here, and import the Log Source by following the doc
- Source Type: Select REST API.
- Entity Type: Choose “Host(Linux)” as the Entity Type.
- Parser: Select “OCI_DB_Recovery_Logs” as the Parser.
-
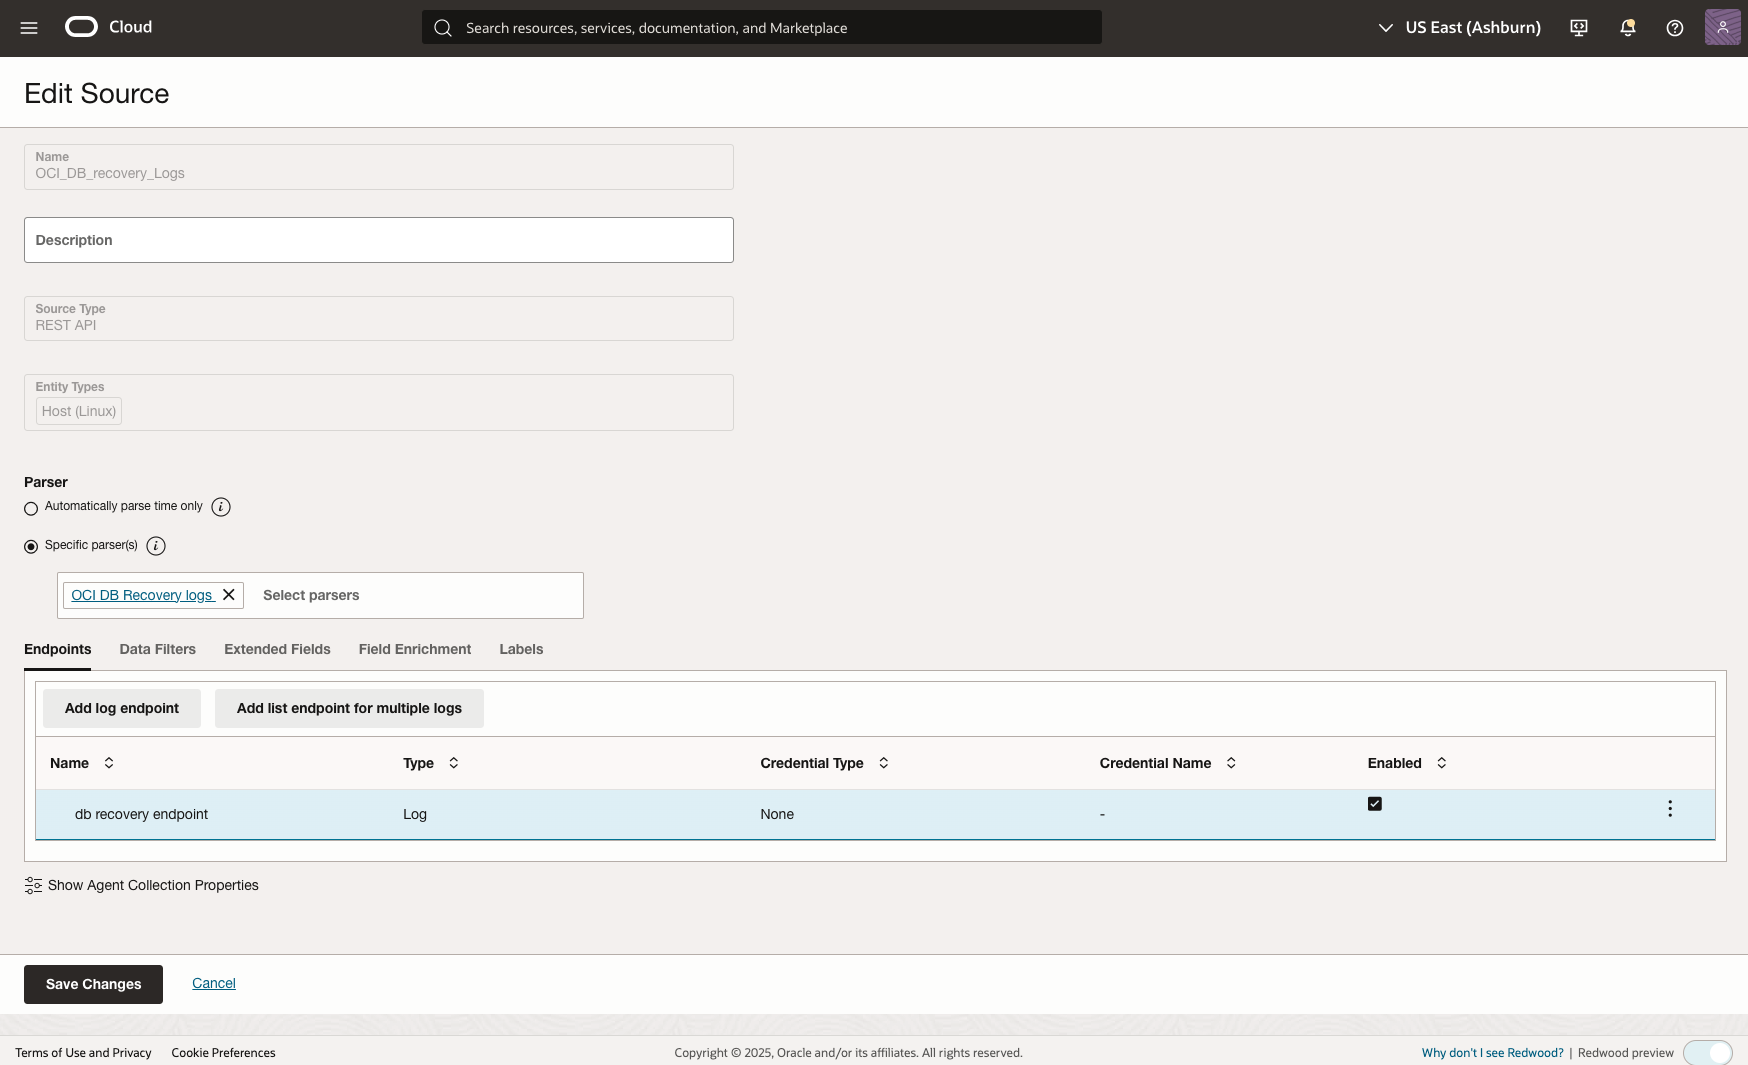
Figure 5: Configure the OCI DB recovery logs source settings
-
Define REST API Endpoint
- In the Endpoints tab, click Add log endpoint.
- Enter a name for the endpoint: db recovery endpoint
- Enter the Log URL for the OCI Recovery Service endpoint you want to collect logs from.
- Example for listing protected databases:
https://recovery.us-ashburn-1.oci.oraclecloud.com/20210216/protectedDatabases?compartmentId={COMPARTMENT_ID}
- Example for listing protected databases:
- Request headers
- Accept: application/json
- Credentials
- Log credentials type: None
-
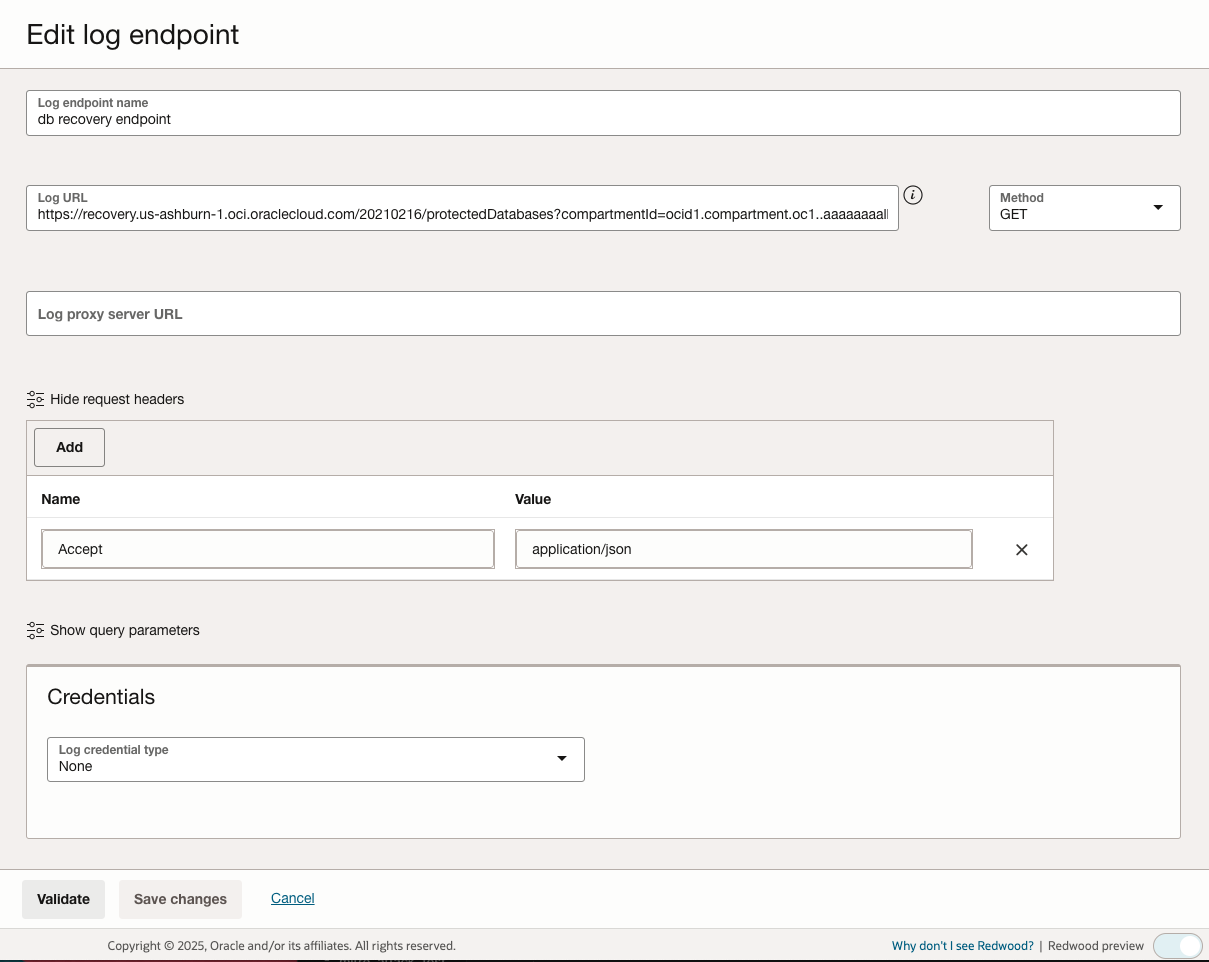
Figure 6: Configure the OCI DB recovery logs source settings
-
Validate configuration and click Save changes
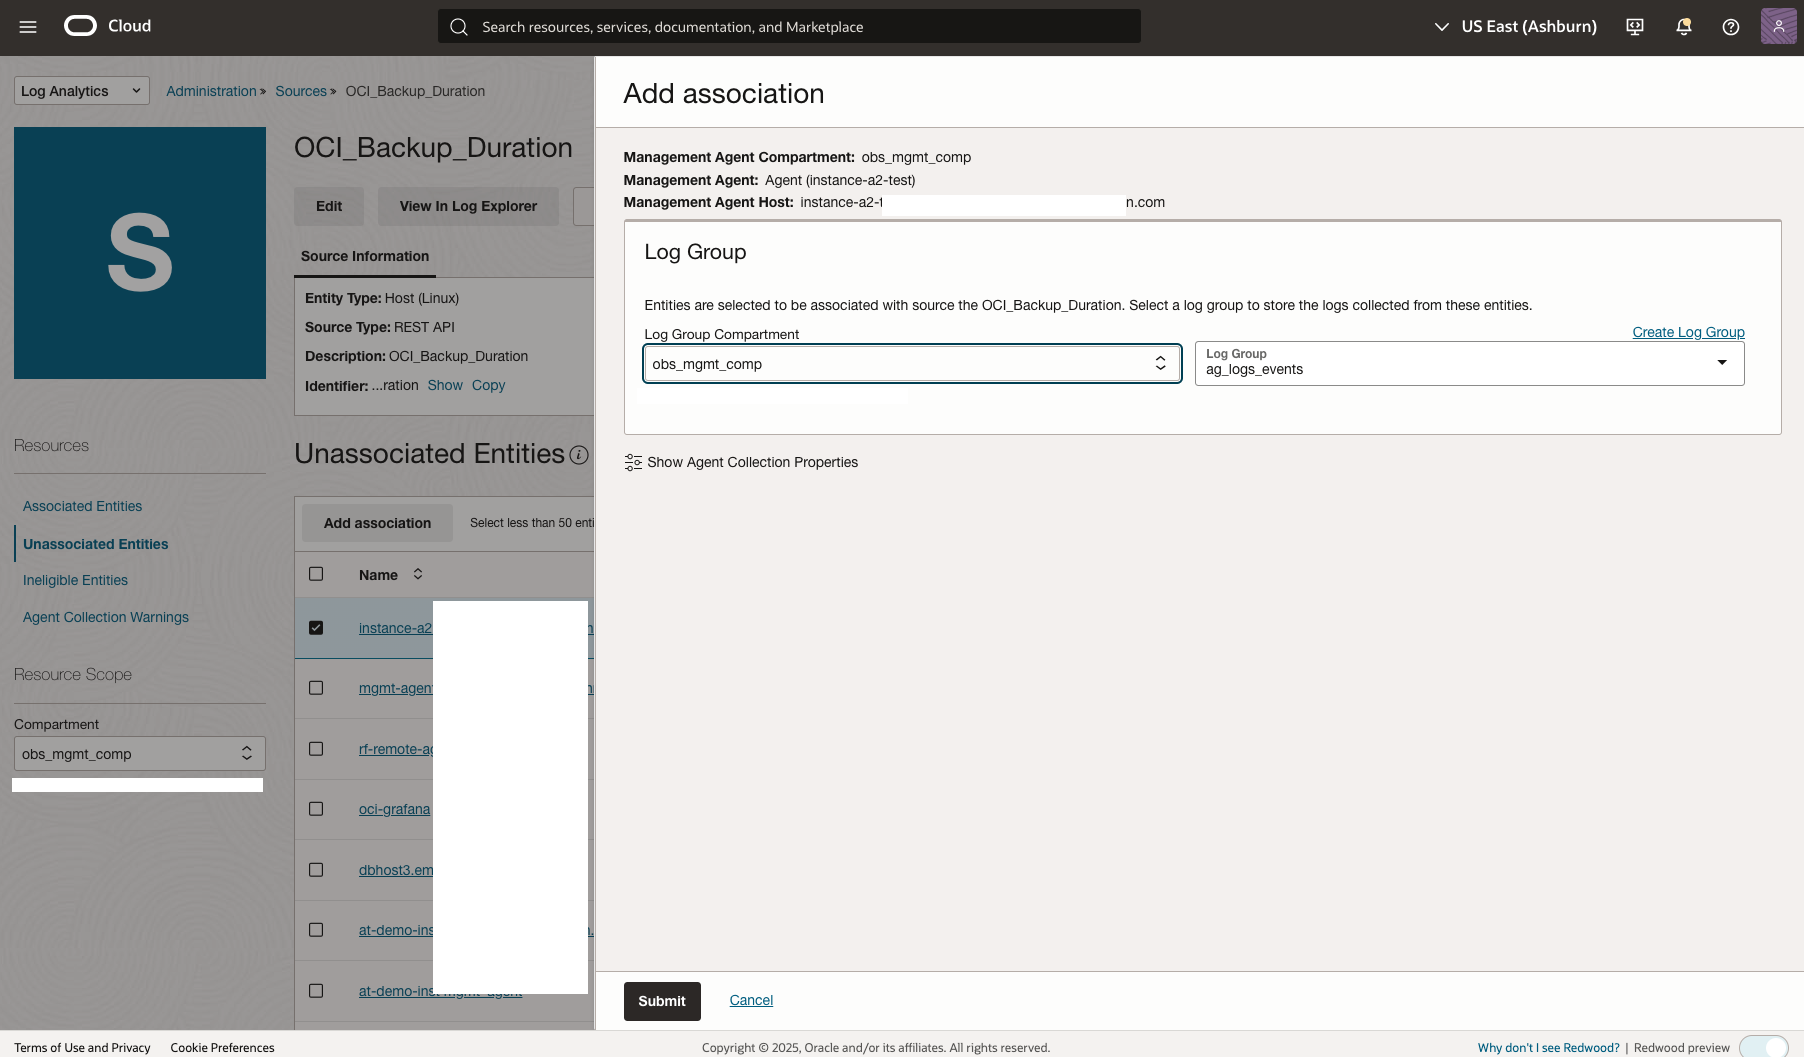
Step 5: Associate the Management Agent with the log source
- Navigate to Log Analytics > Administration > Sources
- Select Log Source OCI_Backup_Duration
- Select the Unassociated Entities menu
- Select your Management Agent host entity
- Click Add Association
- Verify the Management Agent information is displayed
- In the Log Group section, select an existing log group or create a new one for your log source data
- Click Submit to finalize the association
Step 6: Use Log Analytics query language to get backup and recovery insights
- Navigate to Log Analytics > Log Explorer
- Enter the following query as a example:
-
'Log Source' = OCI_Backup_Duration | link 'OCI Resource Name', BackupDestinationType, Metric_Value
-
- Click Run
- Verify the query results
-
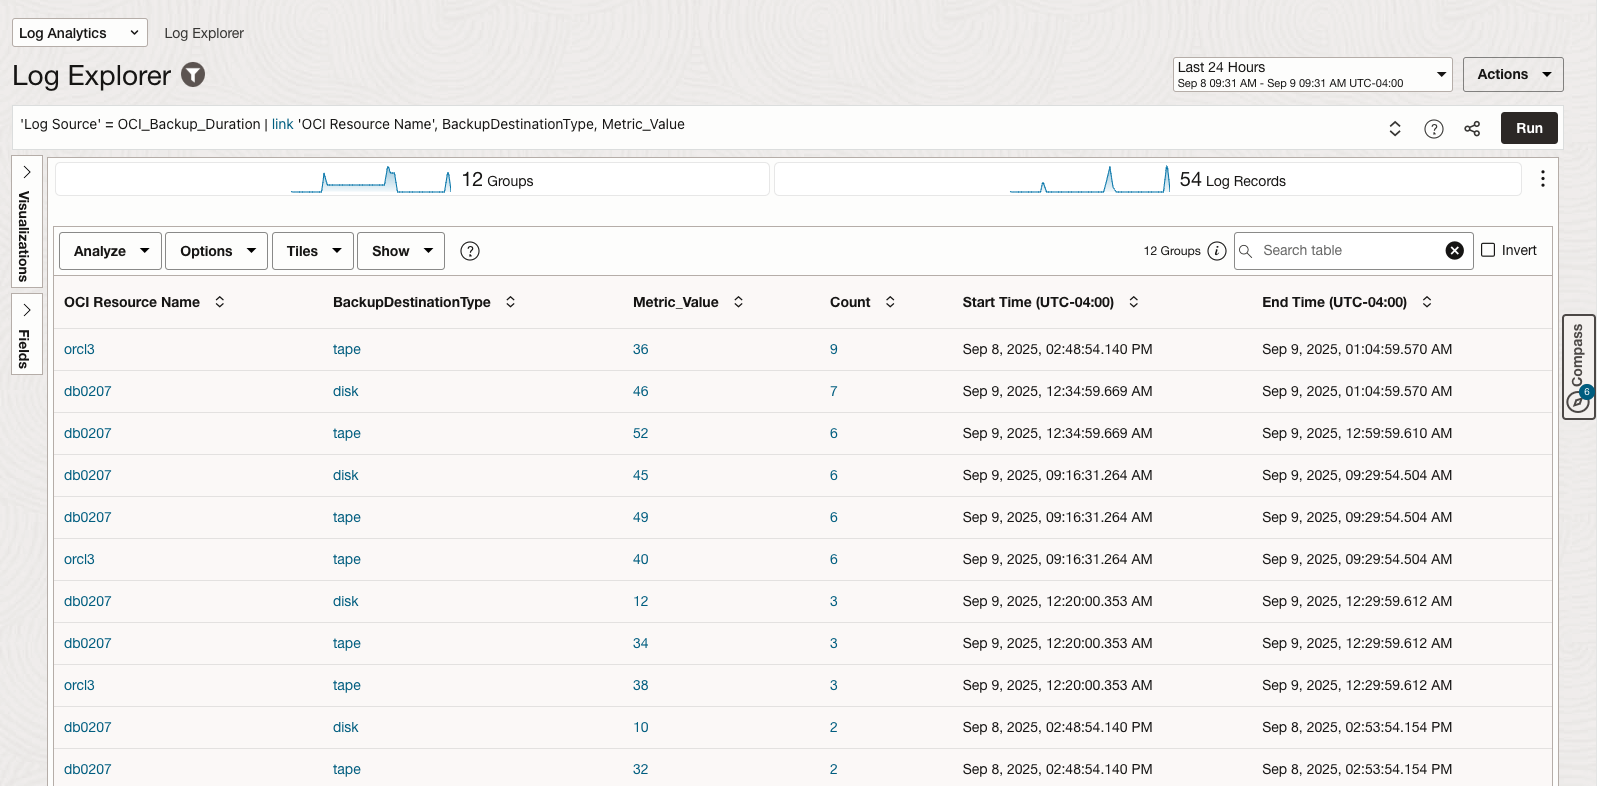
Figure 8: OCI Backup Duration query results
Conclusion
By ingesting OCI Monitoring metrics data into Log Analytics using the REST API Source approach, organizations can transform their observability strategy through several key value propositions:
-
Unified Data Platform
- The integration creates a single pane of glass where metrics data becomes searchable, filterable log entries. This transformation enables teams to apply Log Analytics’ advanced query capabilities to time-series data, breaking down traditional silos between metrics and logs monitoring.
-
Dimensional Data Enrichment
- OCI Monitoring metrics contain rich dimensional information (resourceName, deviceType, compartmentId, etc.) that becomes fully exploitable when converted to log format. Users can:
- Create custom fields from metric dimensions
- Build dynamic filters based on resource attributes
- Perform granular analysis across multiple dimension combinations
- Generate insights that aren’t readily available in standard metrics dashboards
- OCI Monitoring metrics contain rich dimensional information (resourceName, deviceType, compartmentId, etc.) that becomes fully exploitable when converted to log format. Users can:
The result is a comprehensive observability ecosystem where OCI database operations become fully transparent, predictable, and optimizable through data-driven insights.
References
- Elevate OCI Identity Security by collecting historical OCI Audit Logs using OCI Log Analytics REST API Ingestion
- Oracle Cloud Infrastructure Security Fundamentals Dashboards using OCI Logging Analytics
- Elevating Network Security: Introducing New SFD Network Security Dashboard
- Oracle Log Analytics REST API Documentation
- OCI Monitoring Service REST API
- OCI Database Service API Documentation
- OCI Log Analytics Dashboard Creation Guide