Hi! Welcome to the 2nd blog in the NVA Logging series. In this entry, we will demo the Unified Monitoring Agent from the Logging Service with Network Virtual Appliances running in OCI. While any type of NVA should work, I will only do a demo on Fortinet, Checkpoint and Palo Alto. Let’s jump into it.
Quick links:
Integrating 3PP Firewalls with OCI Logging Services – Concepts
Integrating 3PP Firewalls with OCI Logging Services – Unified Monitoring Agent Demo
Integrating 3PP Firewalls with OCI Logging Services – Management Agent Demo
In the previous entry we discussed the components of the solution based on this diagram:
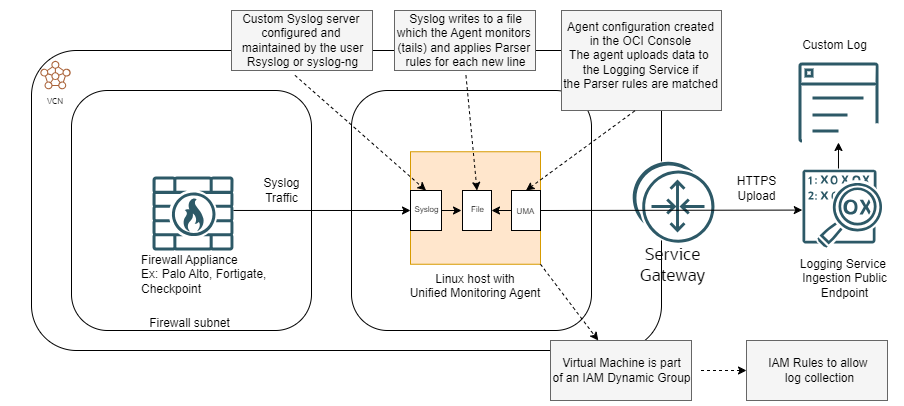
This blog will not cover the Firewall deployment nor the VCN infrastructure needed for the solution as it would take too much space. Before you begin make sure that:
– You have a VCN Subnet in mind where the Linux host running the Unified Agent will reside.
– The Firewall appliance must be able to reach the Linux host on TCP/UDP and the required port (default for Syslog is 514).
– The Linux host must be able to reach into OCI Services via a Service Gateway or a NAT Gateway.
If the infrastructure is in place (VCNs, Routes, Security List entries, Gateways) then we can start the configuration. The deployment has two parts: a generic first part which is the same for any NVA and a specific part to each Vendor.
Deployment common for all NVA types:
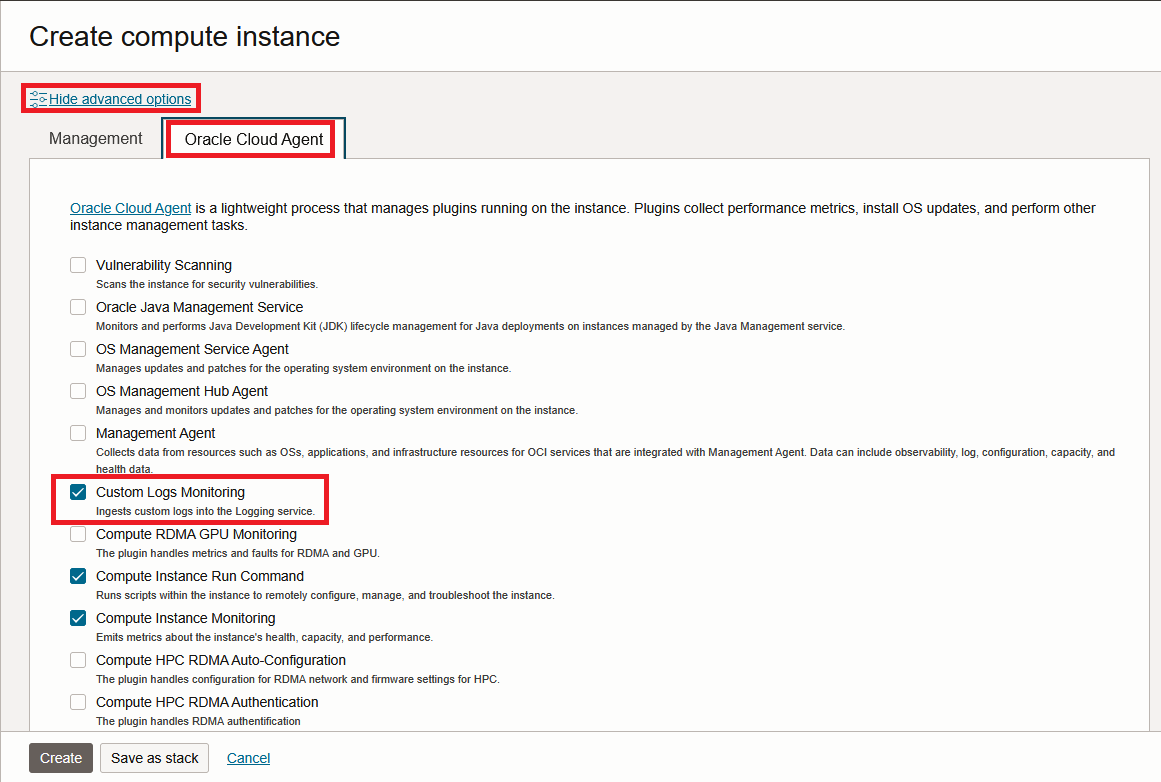
1. Deploy a Host for the Unified Monitoring Agent. I will use Oracle Linux from an OCI Image which will provide the Agent out-of-the-box. During the VM creation wizard check that “Custom Logs Monitoring” is enabled (should be by default).
After the VM is deployed, make sure you can login to it trough SSH and then get its OCID from the OCI Console.
2. Create an IAM Dynamic Group
Go to the Burger Menu -> Identity and Security -> Domains and click the Domain that is currently in use. Go to Dynamic Groups and create a new one.
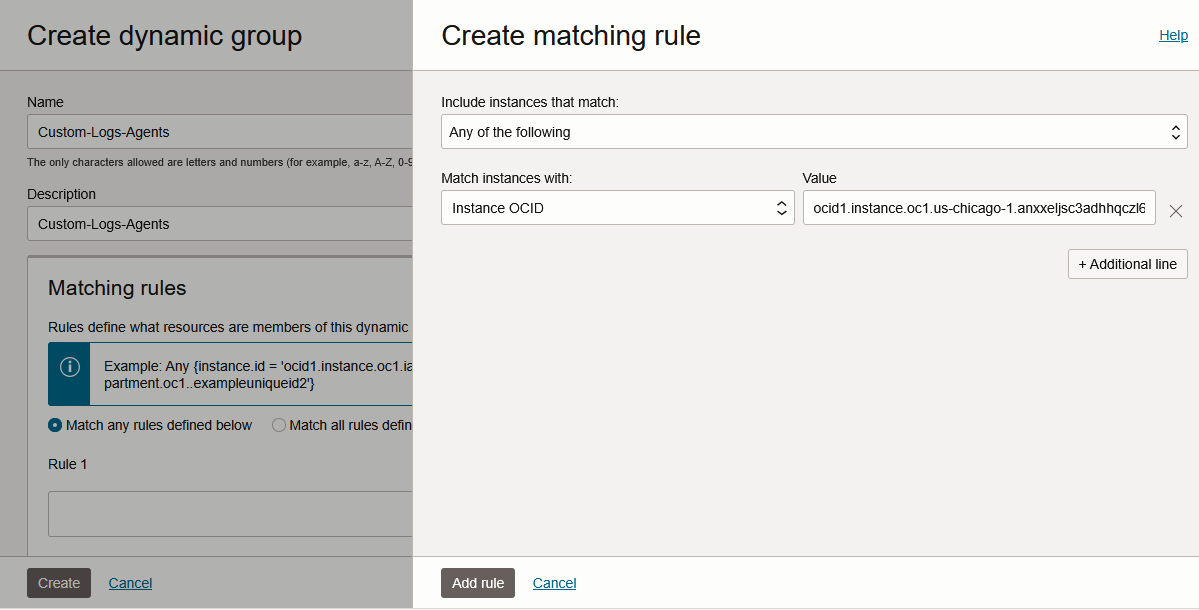
Remember the names of the Domain and the Dynamic Group.
3. IAM Policies. Go to the Burger Menu -> Identity and Security -> Policies and create an IAM Rule:
allow dynamic-group '<identity_domain_name>'/'<group_name>' to use log-content in tenancy
4. Login to the Agent VM with SSH.
Let’s create a folder and file to hold incoming logs:
sudo mkdir /var/log/NVA
sudo touch /var/log/NVA/nva.log
sudo chown -R opc:opc /var/log/NVA
sudo chmod 666 /var/log/NVA/nva.log
Let’s configure Rsyslog:
sudo vi /etc/rsyslog.conf
Go to the end of the file and the following:
template (name="CustomFormatNVA" type="string"
        string="%syslogtag%%msg%\n")

ruleset(name="remoteNVA"){
    action(template="CustomFormatNVA" type="omfile" file="/var/log/NVA/nva.log")
}

module(load="imtcp")
input(type="imtcp" port="514" ruleset="remoteNVA")
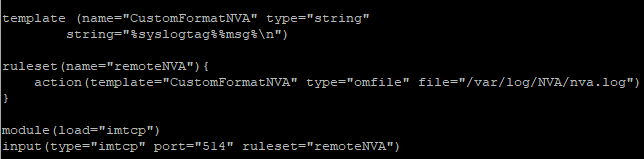
That will do a few things:
– It will enable Rsyslog to listen on TCP 514.
– It will create a custom log format which contains only the actual received message without any local addon data.
– Any log received on TCP port 514 will be directed to /var/log/NVA/nva.log
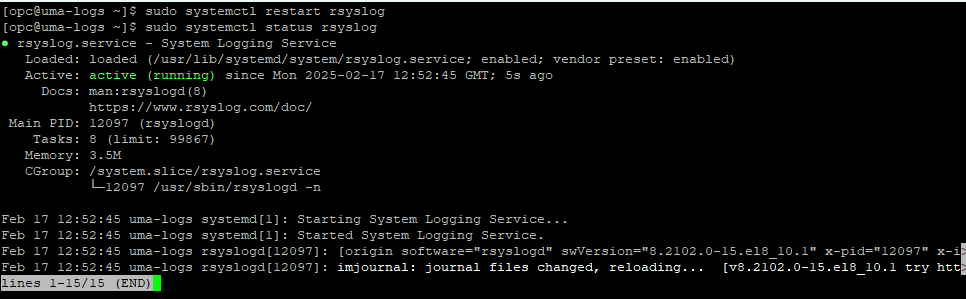
Next, restart Rsyslog and make sure it comes back in a running state:
Next, add a firewalld entry:
sudo firewall-cmd --permanent --add-port=514/tcp
sudo firewall-cmd --reload
And that’s it! Next, let’s see vendor specific configuration.
Deployment specific to each firewall type
FortiGate Next-Gen Firewall
For the Fortigate setup we will use the JSON Parser as it autoconfigures all log fields. Login with SSH to the Fortigate Firewall and give the following commands:
config log syslogd setting
    set status enable
    set server "10.0.1.29"
    set mode reliable
    set format json
end
For the “server” IP use the IP of the Agent VM.
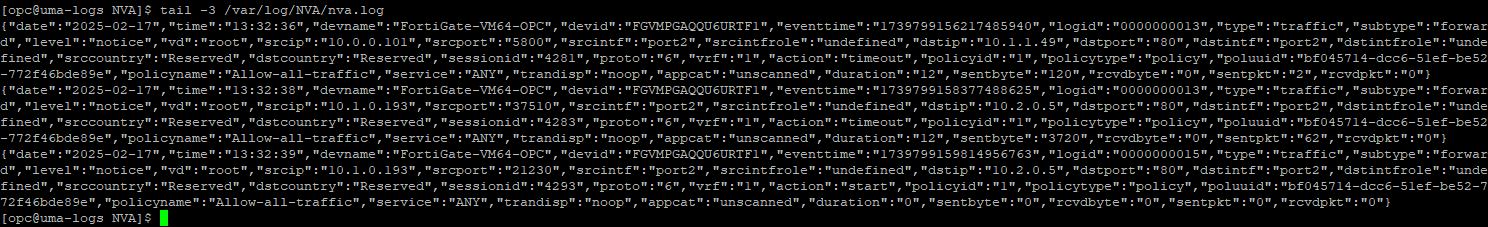
Before moving on, make sure the /var/log/NVA/nva.log populates, in the Agent VM.
tail -3 /var/log/NVA/nva.log
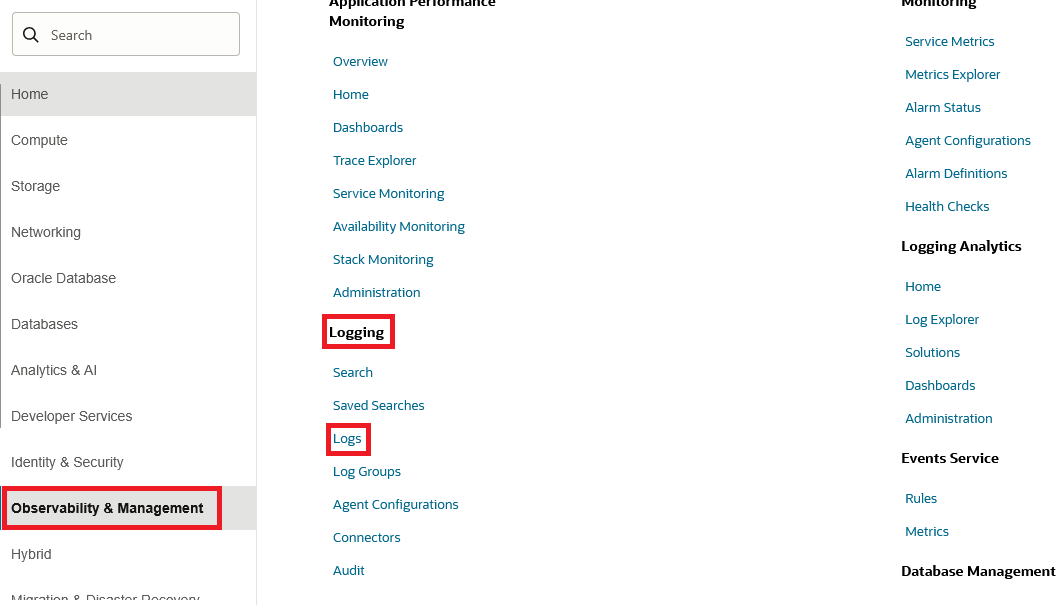
Next, login to the OCI Console, go to Observability & Management -> Logging -> Logs.
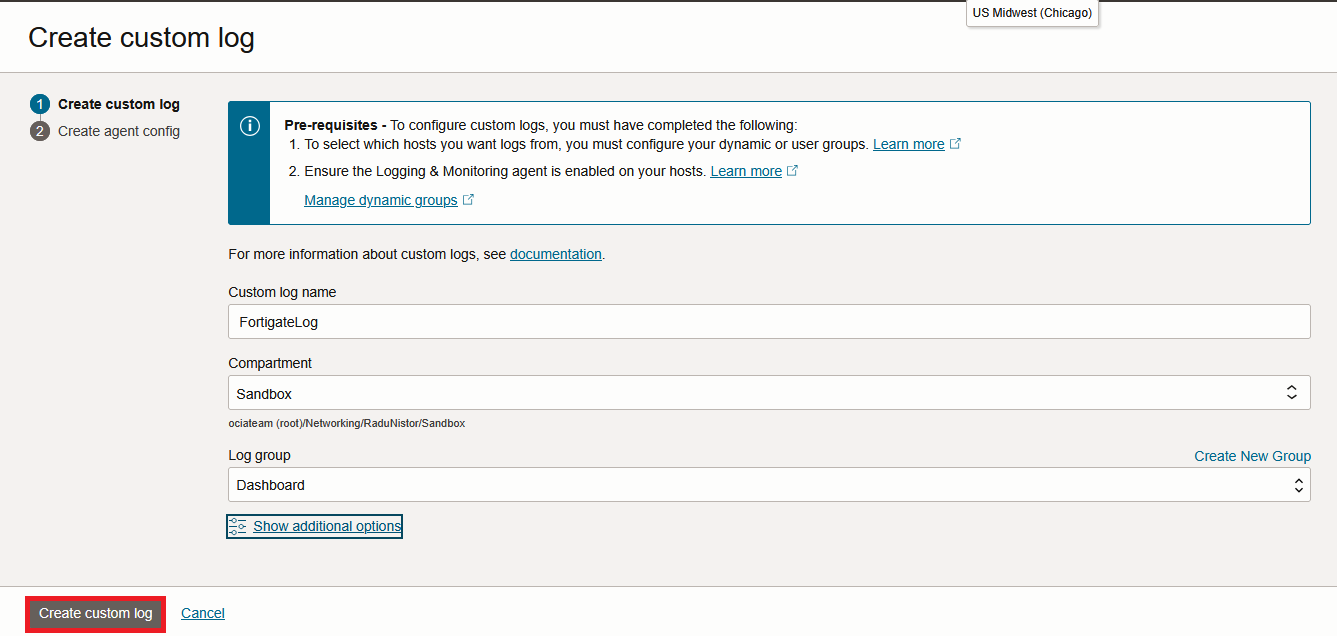
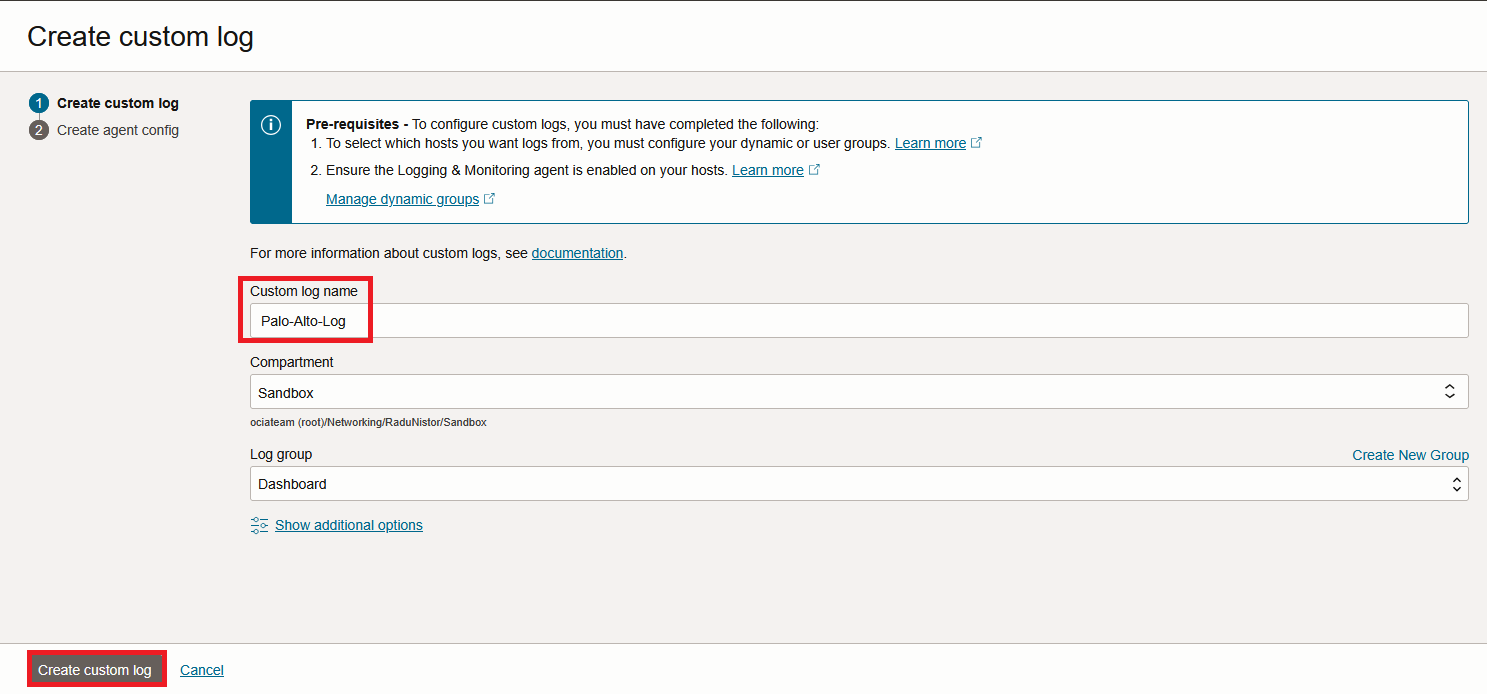
Press Create Custom Log. In the menu that opens, first give it a name and then press “Create Custom Log”.
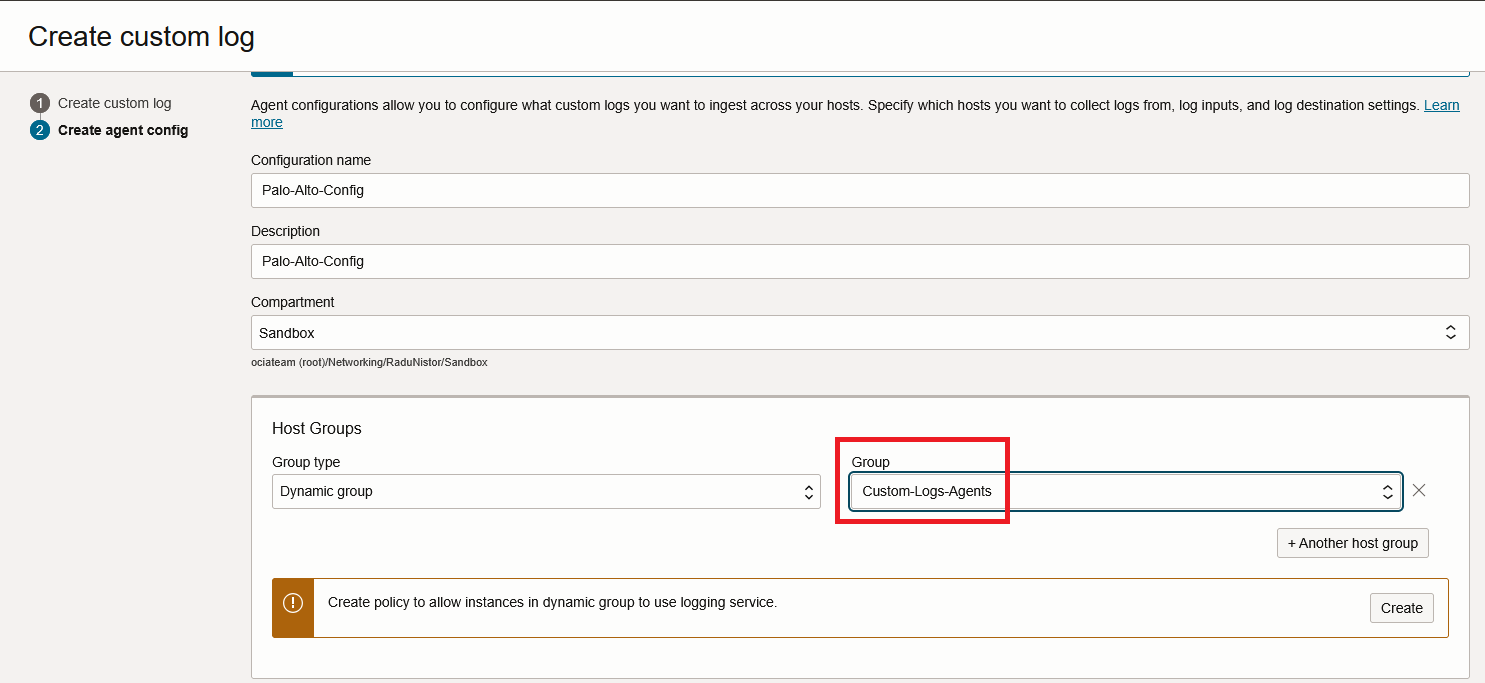
In the next page, the Agent Configuration will show. Give the configuration a name and make sure you link it to the correct Dynamic Group created a few steps back.
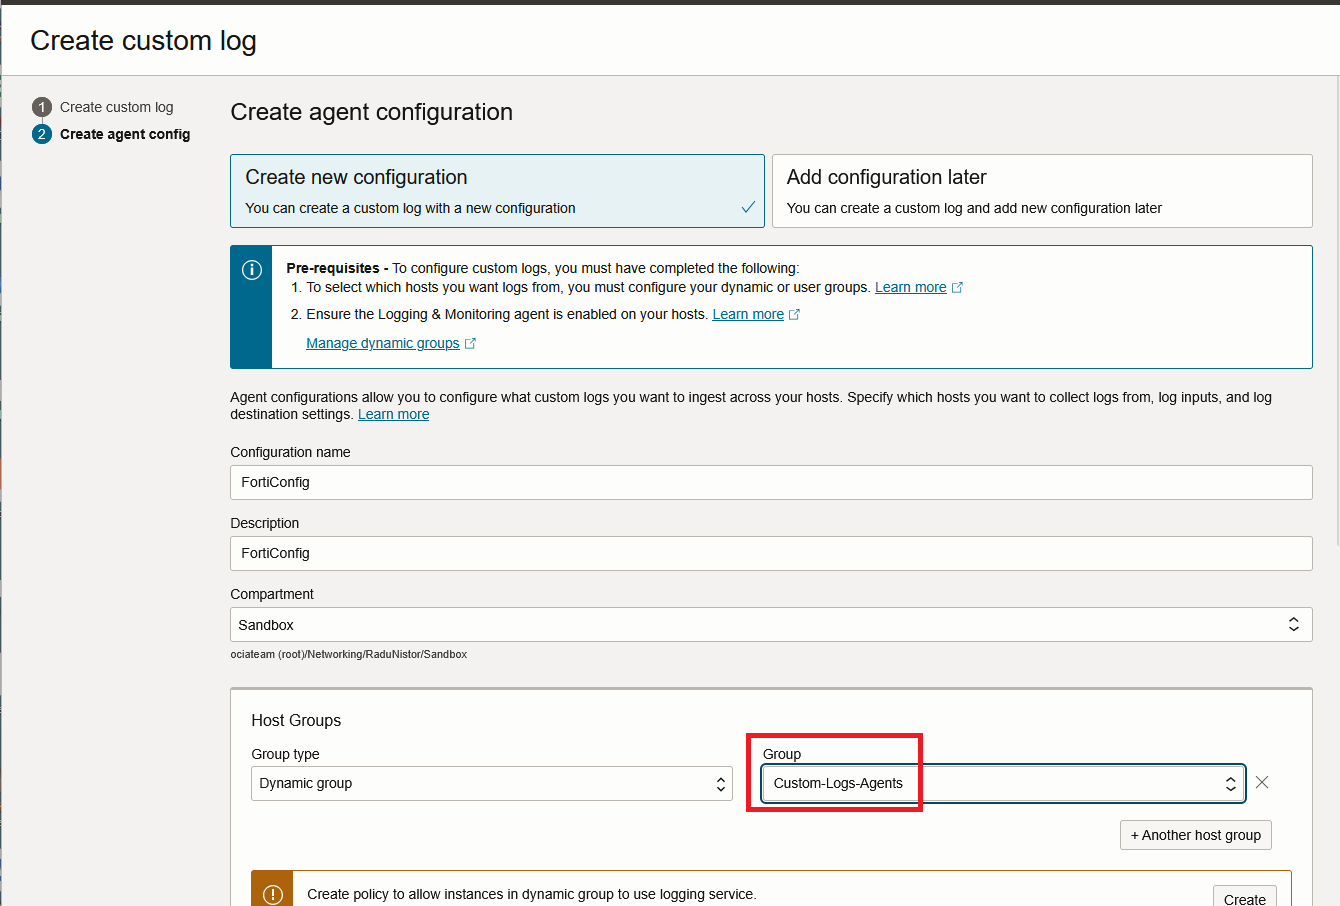
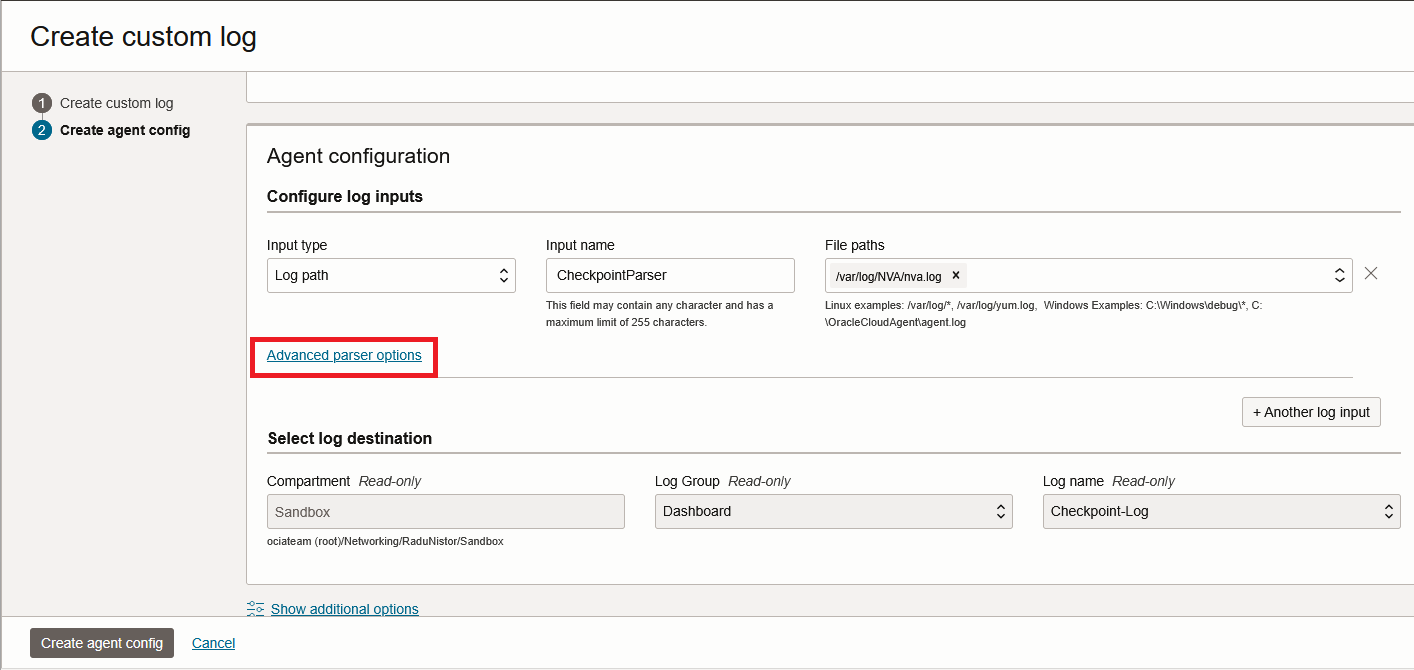
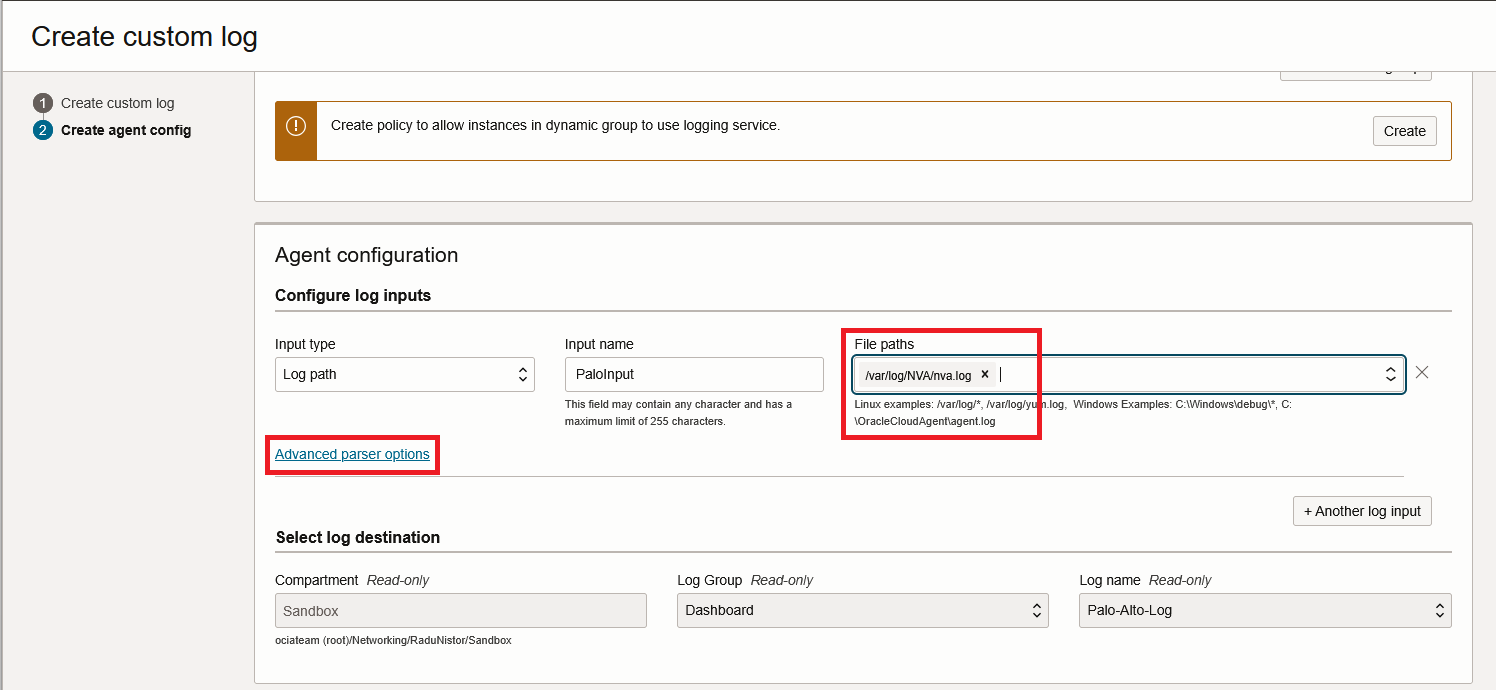
Next, make sure the Input type is “Log path” and give the log location as created previously. After that, press “Advanced parser options”.
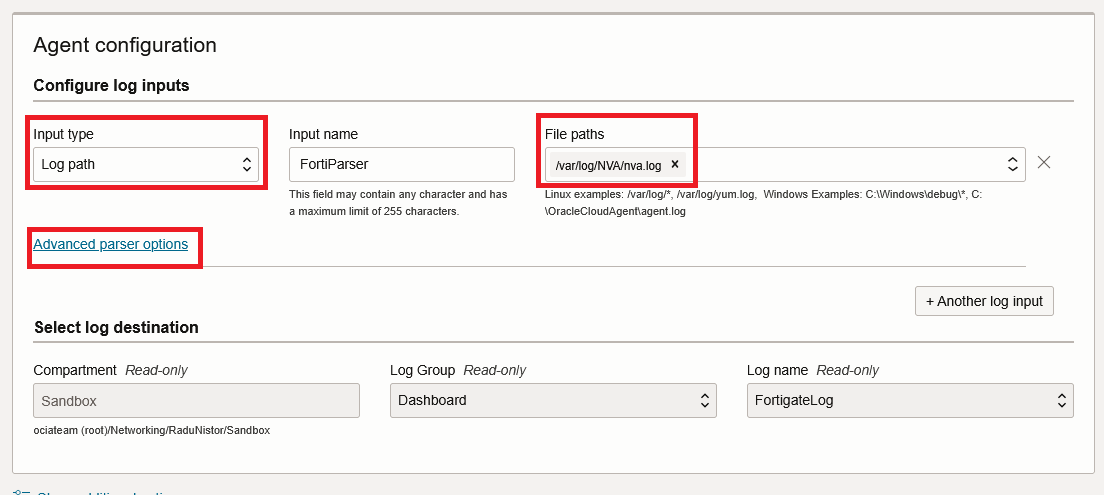
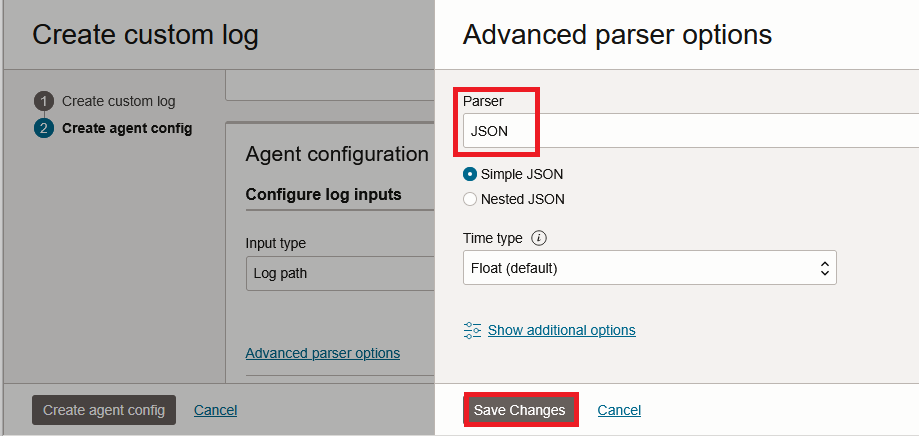
In the parser configuration, configure as below:
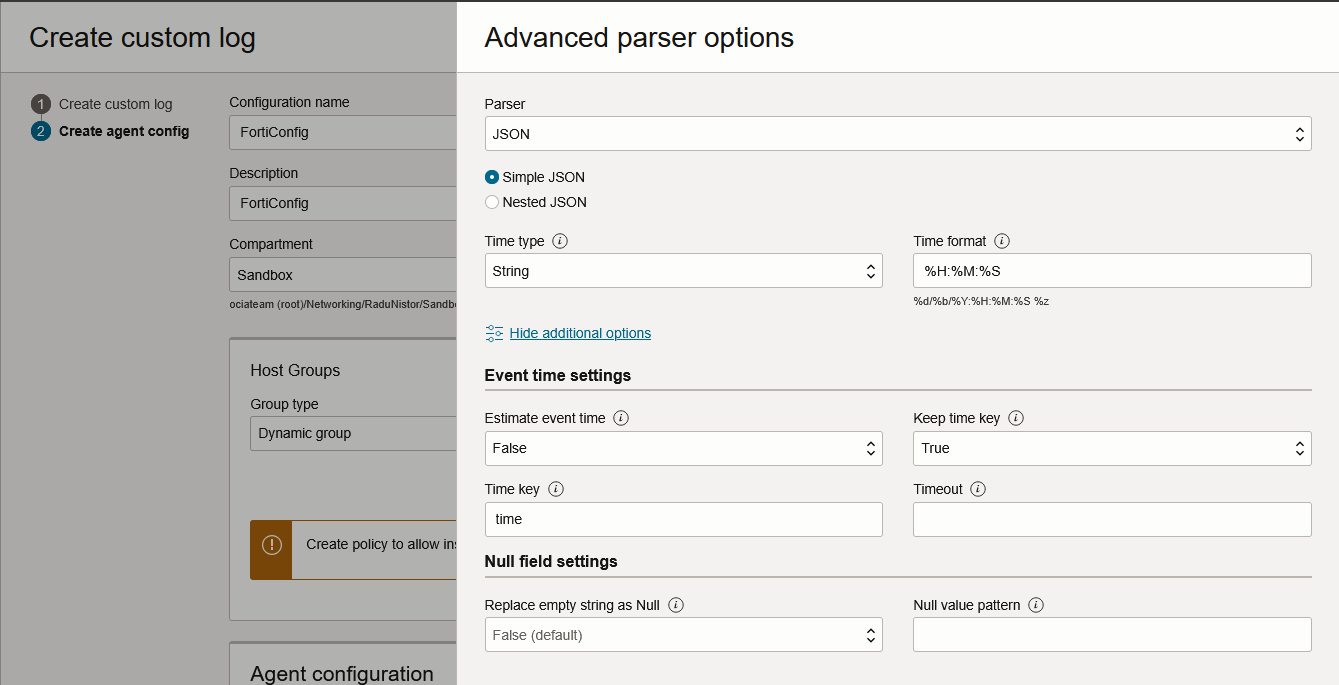
Press Save Changes and Create Agent Configuration.
The configuration will be pushed to the VM and, in a few minutes, the Log should start to populate:
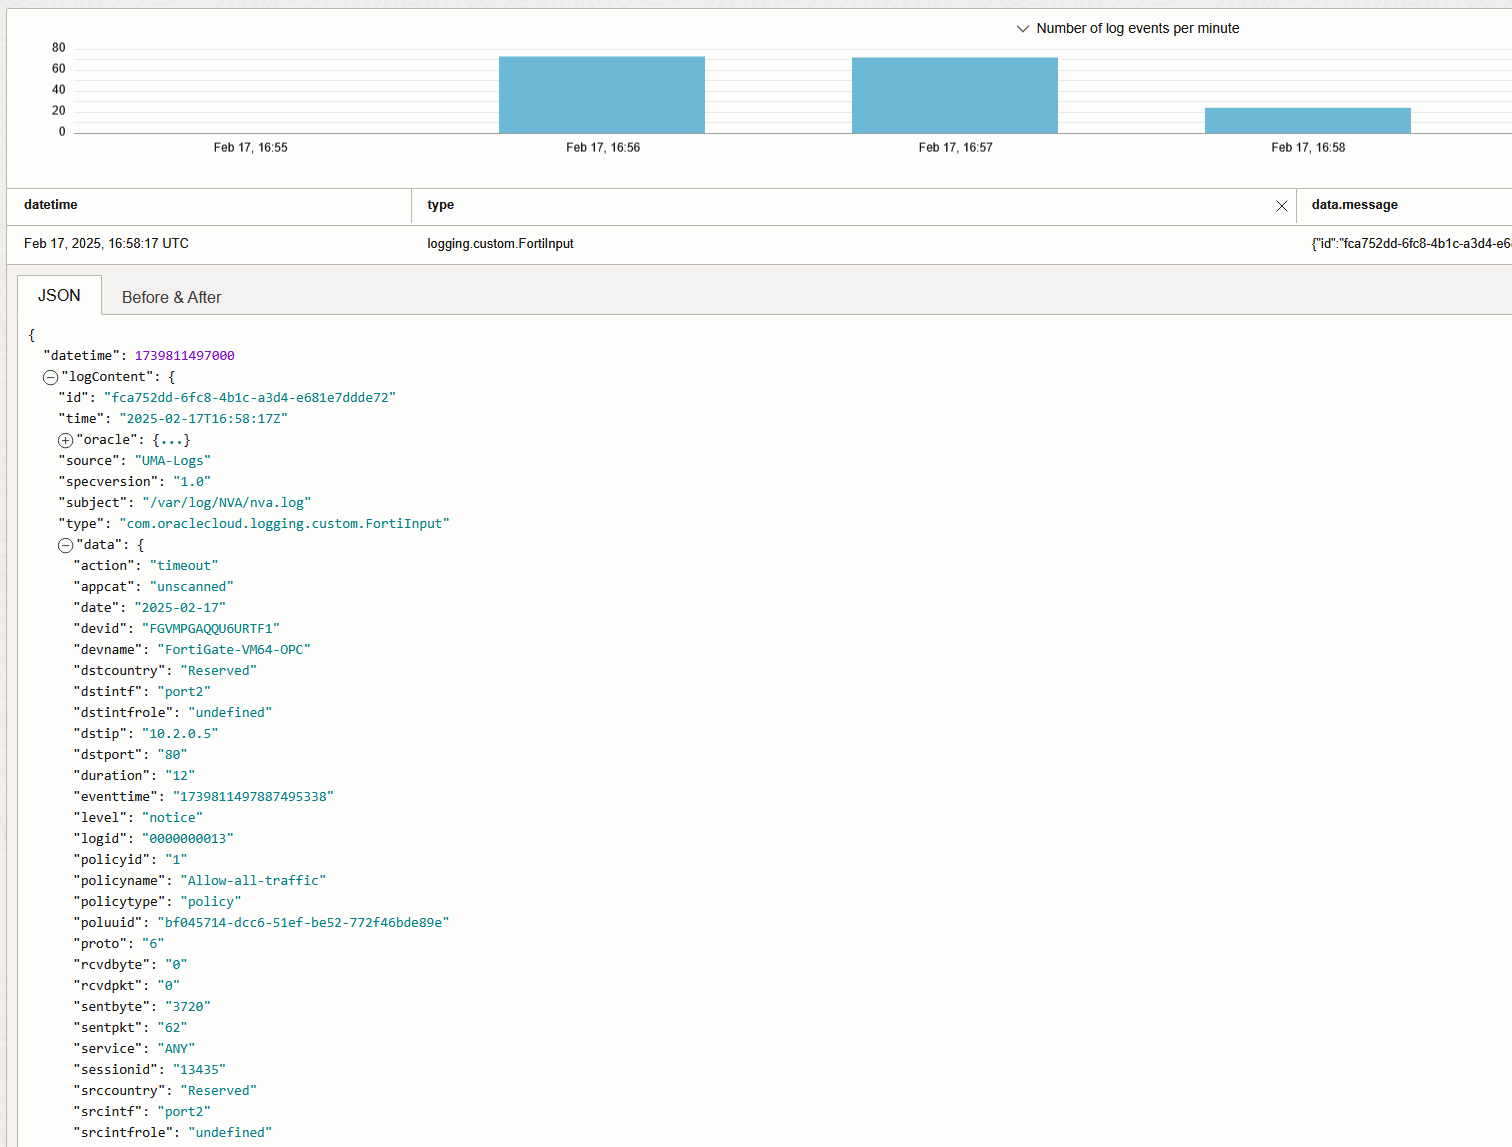
And that’s it! We are now injecting Fortigate Traffic Logs into the OCI Logging Service.
Checkpoint CloudGuard Next-Gen Firewall with CloudGuard Security Management
Prerequisites:
– The Checkpoint Firewalls require the use of a Security Management Appliance to be able to create the advanced logging configuration.
– The Security Management Appliance must already be connected to any Firewalls that will send logs to the Agent VM.
– You will also need the Smart Console software to connect to the Management System.
The Checkpoint logging will again use the JSON format which makes the configuration very simple. We will use this tutorial to create a JSON Log Exporter towards the OCI VM.
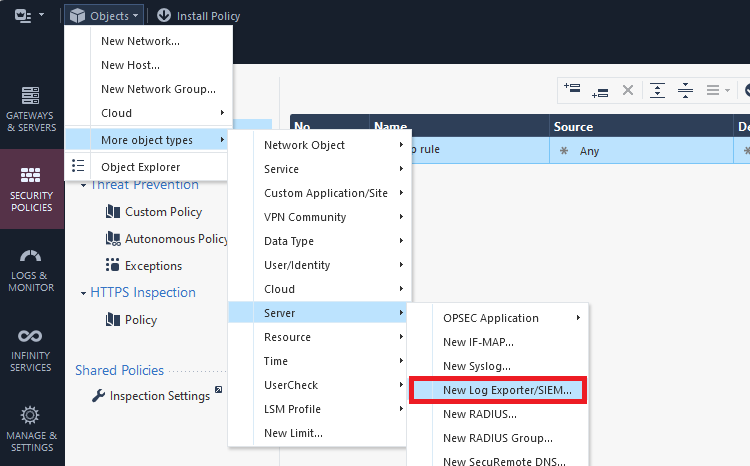
Connect to the Management System with the Smart Console. Create a new Log Exporter:
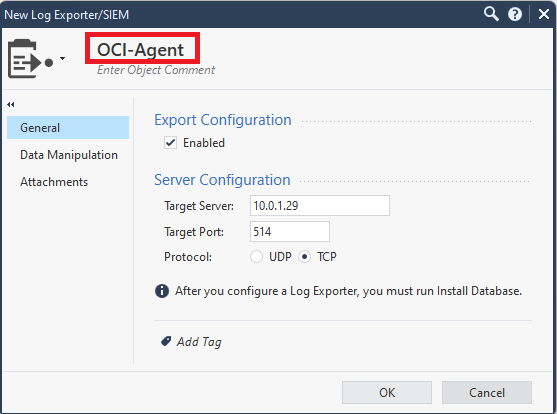
Under General, input the correct IP, port and protocol as configured on the VM, in the previous steps.
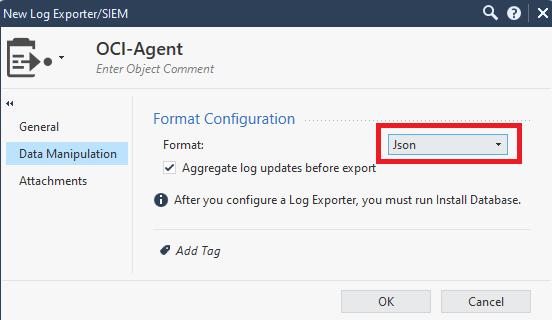
Next, under “Data Manipulation”, make sure you select JSON.
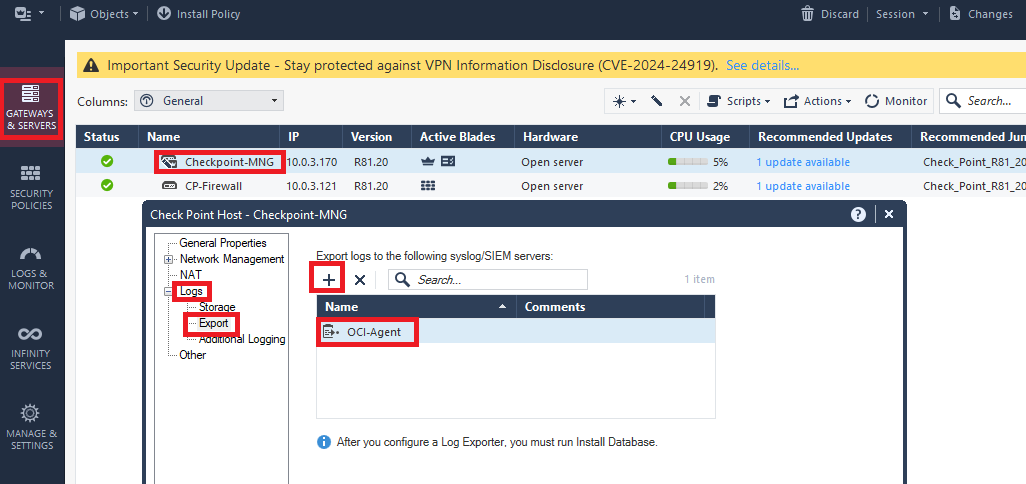
Next, click “Gateways and Servers”, then double click the Management server, then go to Logs/Export and add the newly created Export target.
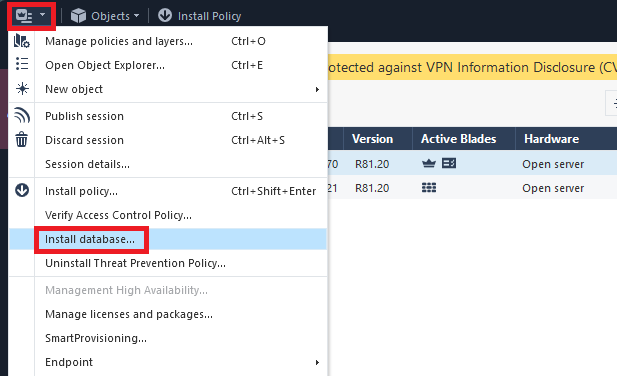
Next, click the dropdown menu and select “Install database” and accept the inputs to start the installation.
After the install is completed, make sure your security policies are configured to log the traffic.
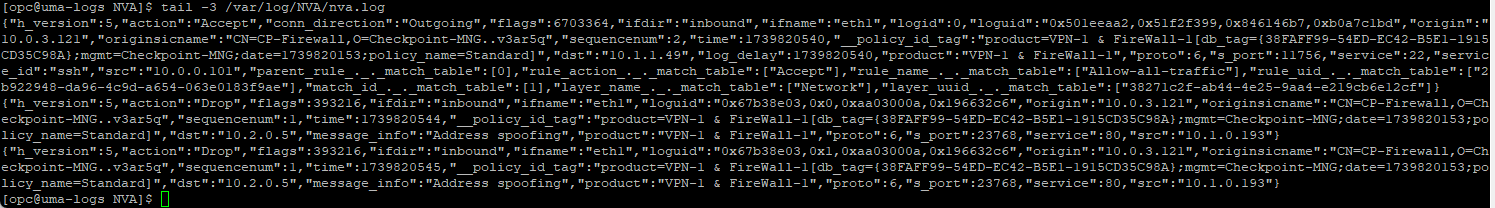
Before moving on to the OCI Agent Configuration, make sure to syslog file gets populated.
tail -3 /var/log/NVA/nva.log
Next, login to the OCI Console, go to Observability & Management -> Logging -> Logs.
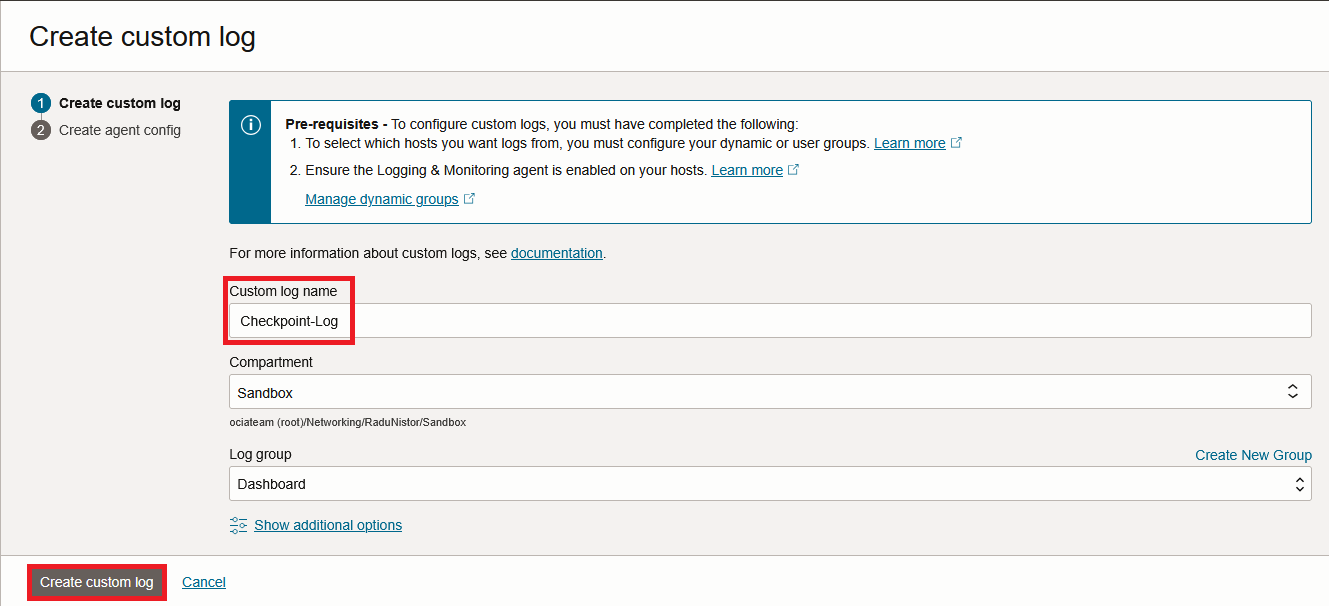
Press Create Custom Log. In the menu that opens, first give it a name and then press “Create Custom Log”.
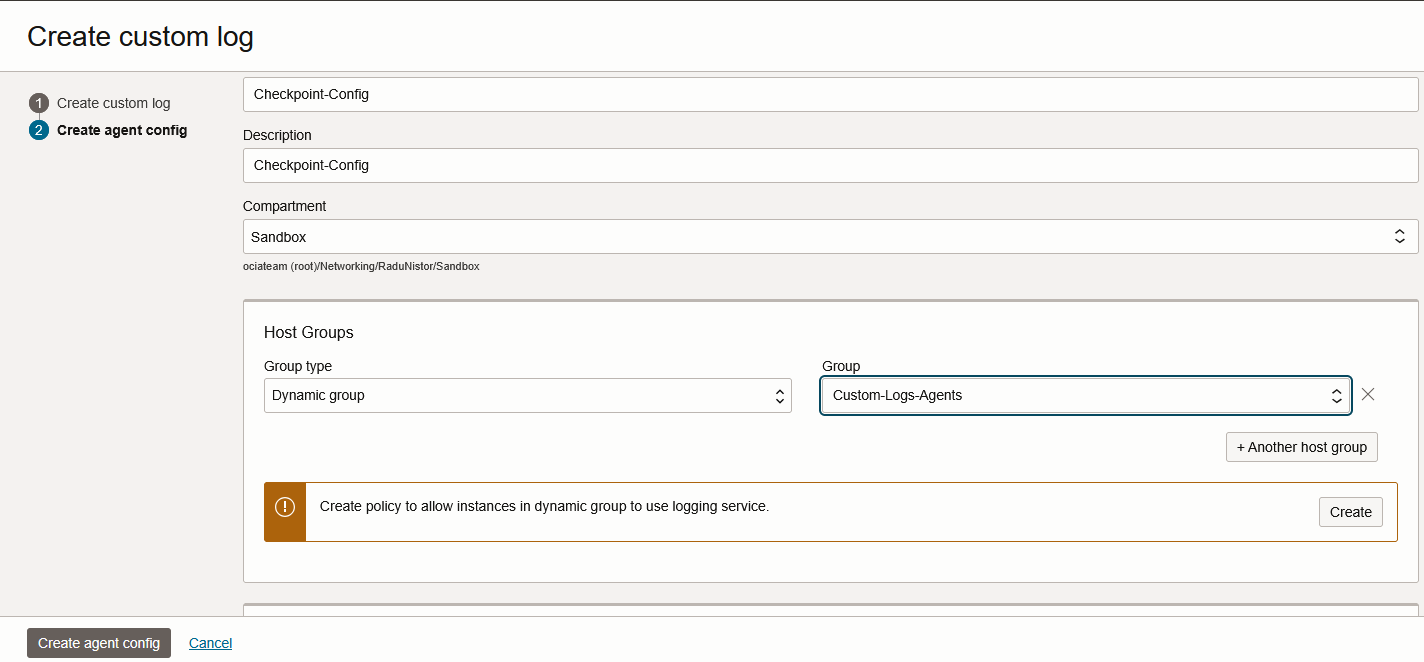
In the next page, the Agent Configuration will show. Give the configuration a name and make sure you link it to the correct Dynamic Group create a few steps back.
Next, make sure the Input type is “Log path” and give the log location as created previously. After that, press “Advanced parser options”.
In the advanced config, input the following:
Save Changes and press Create agent config. Give it a few minutes and the Custom Log should start to populate.
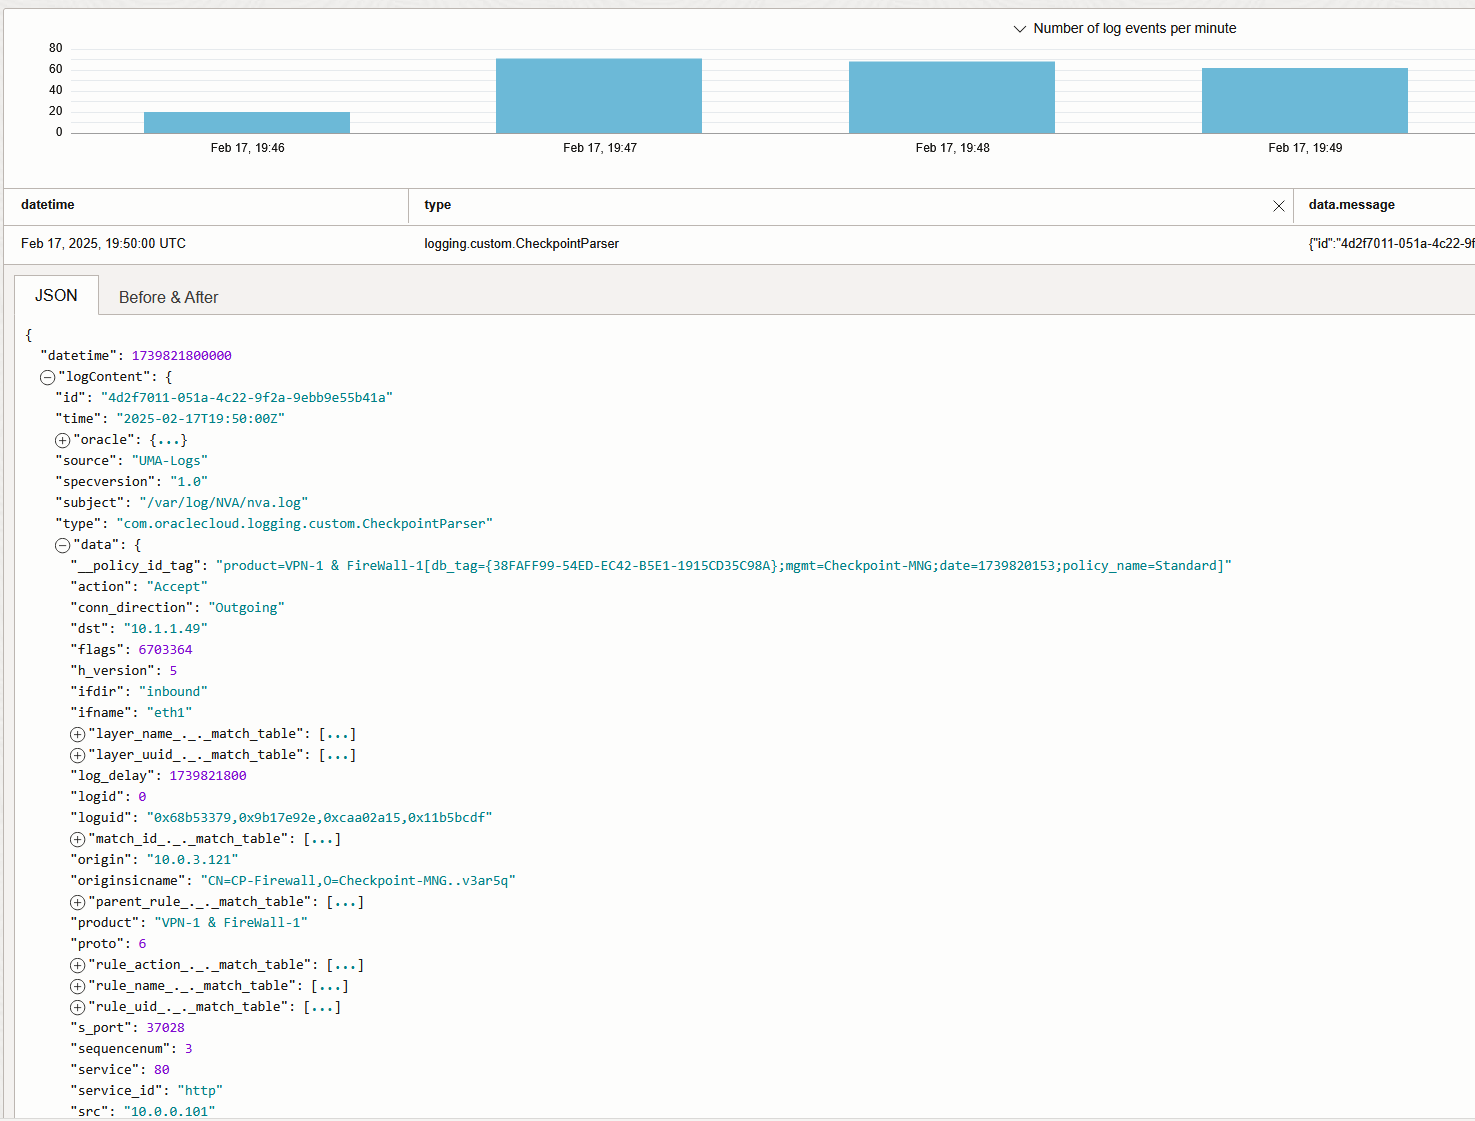
And that’s it! We are now injecting Checkpoint Traffic Logs into the OCI Logging Service.
Palo Alto
The last demo is focused on Palo Alto firewalls. As Palo Alto does not natively support JSON formatting of the logs, we will need to create our own Fluentd Parser based on Regex. In general, any NVA should follow this procedure, if it does not support JSON formatting.
When defining the Logging inside PANOS we have the ability to specify the log fields and order which will help us define the REGEX Parser. The other way of doing it would be to send logs in the default format, take them from the SYSLOG file and analyze them. For this demo, I will create a custom log format.
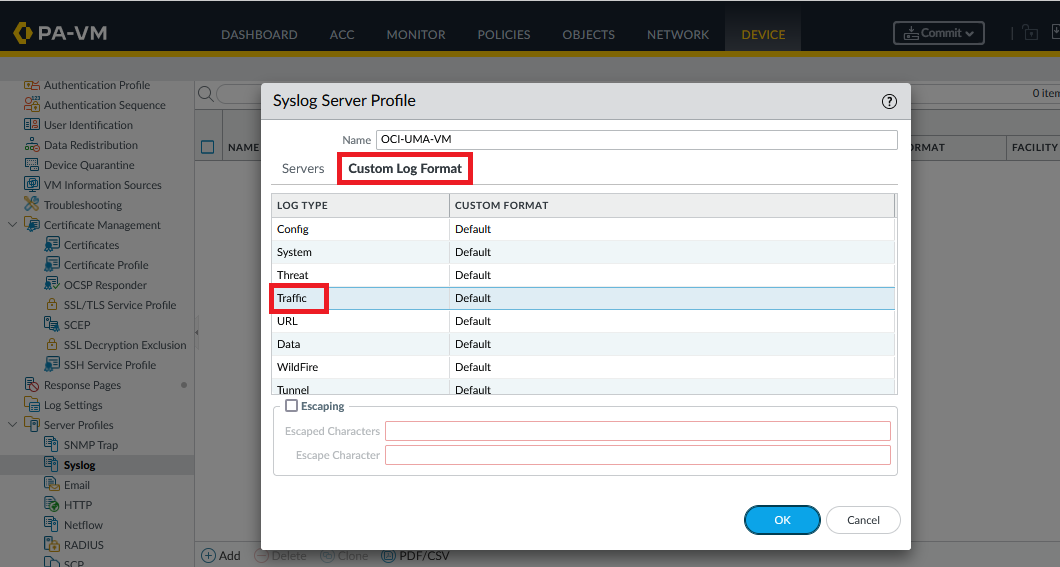
First, login into the PA Firewall and define a Syslog server profile:
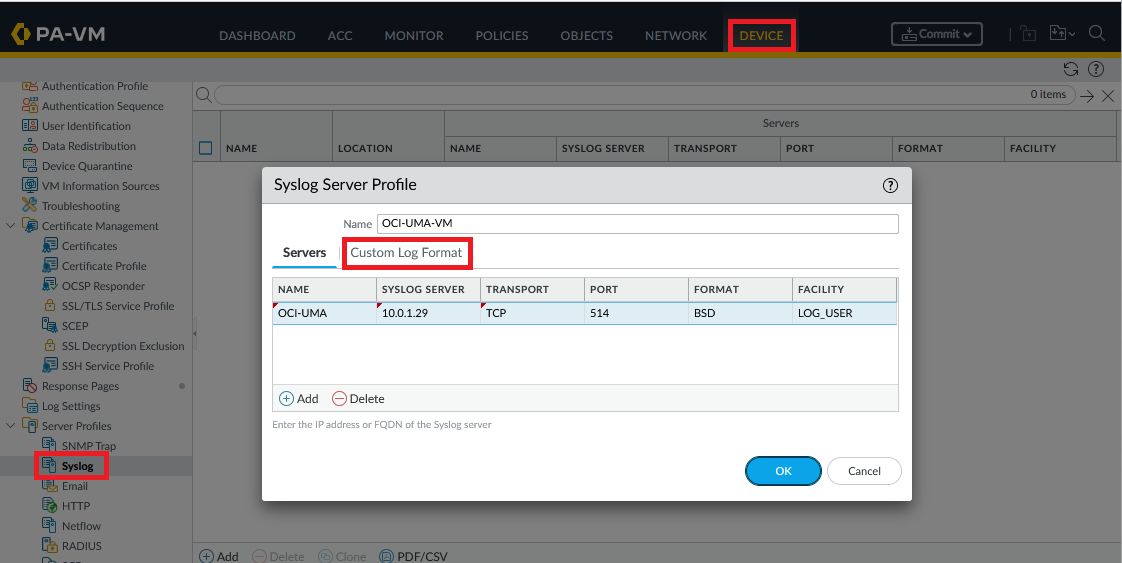
Next, click on Custom Log Format and define a log format that works for you. For this demo, I will create a basic log structure but you can choose any structure that you like or even leave the default. The important thing to note is that each field in the log needs a Regex definition (more on that later). Palo Alto has documented all the possible fields of the log here.
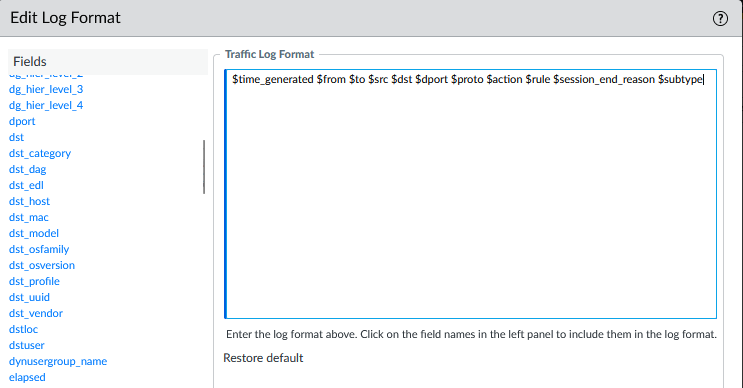
Copy the Log Format in a notepad, we will need it for the Regex part. Mine is:
$time_generated $from $to $src $dst $dport $proto $action $rule $session_end_reason $subtype
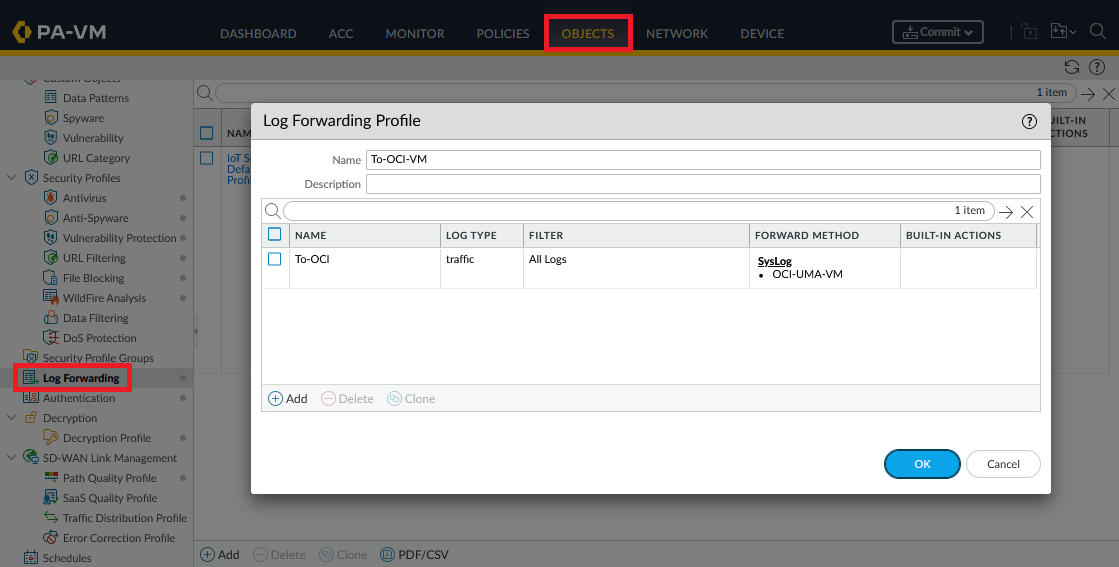
Next, define a log forwarding profile, for Syslog, which uses the previously created Server Profile. Note that I will focus on Traffic Logs but you can follow this procedure for any log type.
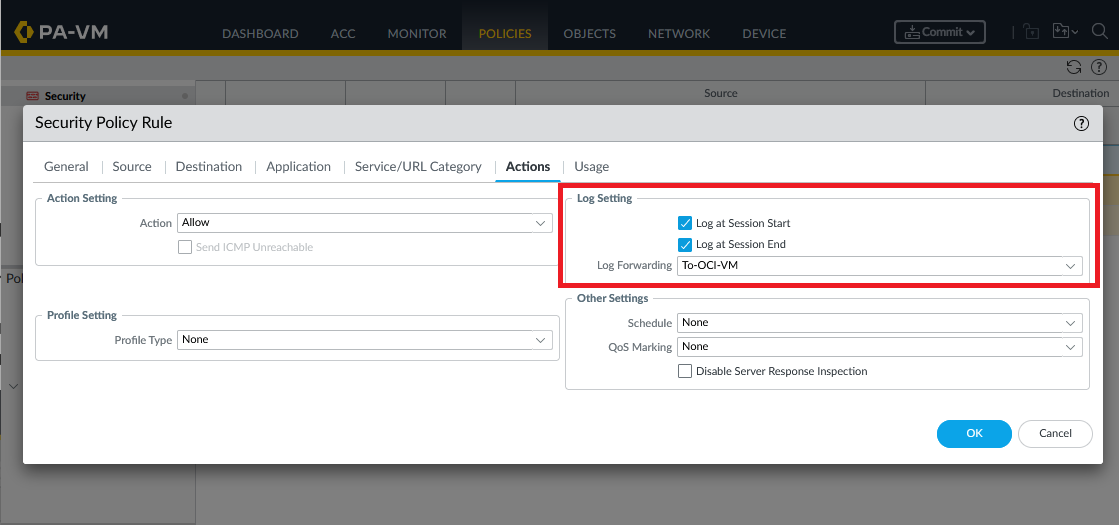
Last, enable Log Forwarding on any Security Policy you want:
Commit the configuration. Before moving on to the OCI side, make sure the Log file on the OCI VM gets populated.
tail -3 /var/log/NVA/nva.log

Next, login to the OCI Console, go to Observability & Management -> Logging -> Logs.
Press Create Custom Log. In the menu that opens, first give it a name and then press “Create Custom Log”.
In the next page, the Agent Configuration will show. Give the configuration a name and make sure you link it to the correct Dynamic Group create a few steps back.
Next, make sure the Input type is “Log path” and give the log location as created previously. After that, press “Advanced parser options”.
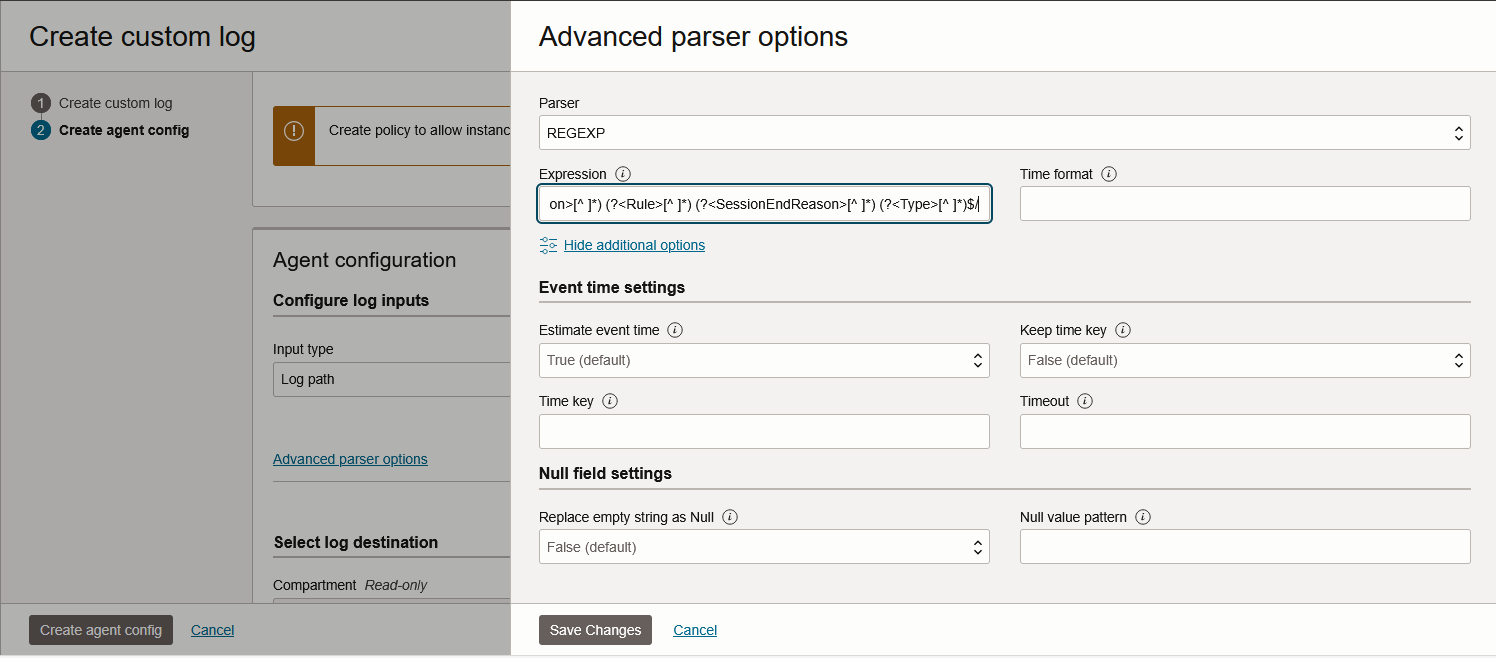
In the advanced config, input the REGEXP Parser. We will use a Regex function called “Named Capturing Group” which works by defining a name of a field and a pattern to match, something like this (?<name>pattern).
We will basically translate the previously created log format:
$time_generated $from $to $src $dst $dport $proto $action $rule $session_end_reason $subtype
Into a Regex Capturing set of Groups which looks like this:
/^(?<Date>[^ ]*) (?<Time>[^ ]*) (?<SourceZone>[^ ]*) (?<DestinationZone>[^ ]*) (?<SourceIP>[^ ]*) (?<DestinationIP>[^ ]*) (?<DestinationPort>[^ ]*) (?<Protocol>[^ ]*) (?<Action>[^ ]*) (?<Rule>[^ ]*) (?<SessionEndReason>[^ ]*) (?<Type>[^ ]*)$/
Each field in the Log gets its own Capturing Group with the exception of “time_generated” which gets two groups, Date and Time. The Groups are separated by the character “space”. Input the above in the OCI Parser Config:
Save Changes and press Create agent config. Give it a few minutes and the Custom Log should start to populate.
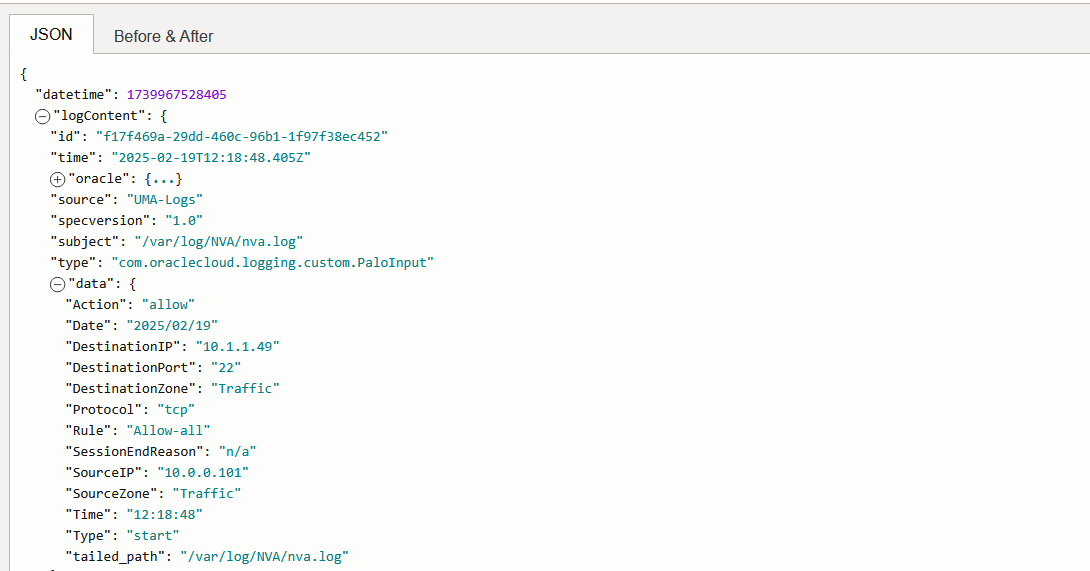
And that’s it! We are now injecting Palo Alto Traffic Logs into the OCI Logging Service.
Troubleshooting tips
Let’s say you created all constructs but the Custom Log does not get populated. Here are a few files you could check:
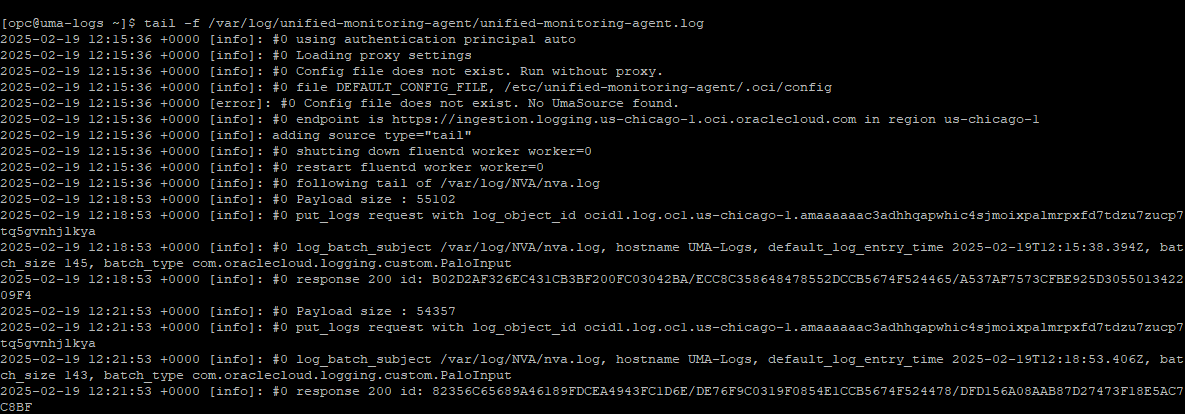
1. The UMA log file can show interesting data. If everything went well, you should see, from time to time, successful API CALLs that upload log entries:
tail -f /var/log/unified-monitoring-agent/unified-monitoring-agent.log
if you see errors you may want to restart the agent:
sudo systemctl restart unified-monitoring-agent
if you see Parser Errors you need to work on the Parser definition until they disappear.
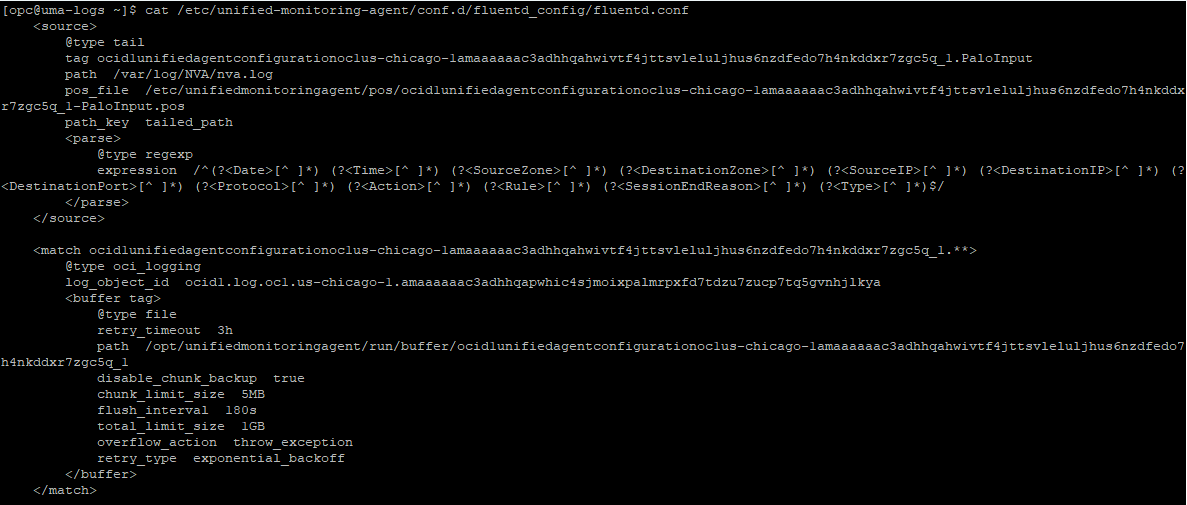
2. If the Agent is running fine it will download from OCI the configuration of the FluentD Parser which you can see in the Fluentd conf file:
cat /etc/unified-monitoring-agent/conf.d/fluentd_config/fluentd.conf
If it’s not there, or the config is different than what you have in the portal, you can force a redownload of the config with:
sudo systemctl restart unified-monitoring-agent_config_downloader
3. Make sure that your NVAs are correctly configured regarding time and timezones. Some of the OCI Parsers will look into the time field and will not be able to inject logs into OCI if the time in the Logs is not correct.
And that’s it! I hope this helps you!
