Hi! Welcome to the 3rd blog in the NVA Logging series. In this entry, we will demo the Management Agent, running a Logging Analytics plugin, with Network Virtual Appliances running in OCI. While any type of NVA should work, I will only do a demo on Fortinet, Checkpoint and Palo Alto. As discussed, OCI provides a predefined set of constructs of most Network Virtual Appliances but you can always build your own constructs (Parsers, Sources), if your NVA is not in the list.
Quick links:
Integrating 3PP Firewalls with OCI Logging Services – Concepts
Integrating 3PP Firewalls with OCI Logging Services – Unified Monitoring Agent Demo
Integrating 3PP Firewalls with OCI Logging Services – Management Agent Demo
In the first blog we discussed the components of the solution based on this diagram:
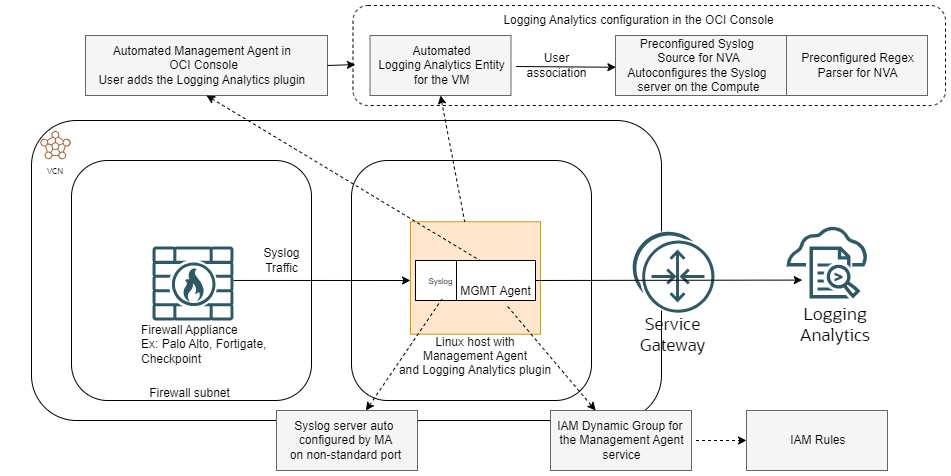
This blog will not cover the Firewall deployment nor the VCN infrastructure needed for the solution as it would take too much space. Before you begin make sure that:
– You have a VCN Subnet in mind where the Linux host running the Management Agent will reside.
– The Firewall appliance must be able to reach the Linux host on TCP/UDP and the required port which varies from vendor to vendor, for the predefined sources.
– The Linux host must be able to reach into OCI Services via a Service Gateway or a NAT Gateway.
If the infrastructure is in place (VCNs, Routes, Security List entries, Gateways) then we can start the configuration. The deployment has two parts: a generic first part which is the same for any NVA and a specific part to each Vendor.
Deployment for all NVA types
1. Go to the Burger Menu -> Identity and Security -> Domains and click the Domain that is currently in use. Go to Dynamic Groups and create a new one.
ALL {resource.type='managementagent', resource.compartment.id='ocid1.compartment.oc1..aaaaaaaay22……'}
Where the compartment OCID is the one in which you deployed the Compute Instance.
2. IAM Policies
Go to the Burger Menu -> Identity and Security -> Policies and create an IAM Rule
allow dynamic-group '<identity_domain_name>'/'<group_name>' to use metrics in tenancy
allow dynamic-group '<identity_domain_name>'/'<group_name>'  to {LOG_ANALYTICS_LOG_GROUP_UPLOAD_LOGS} in tenancy
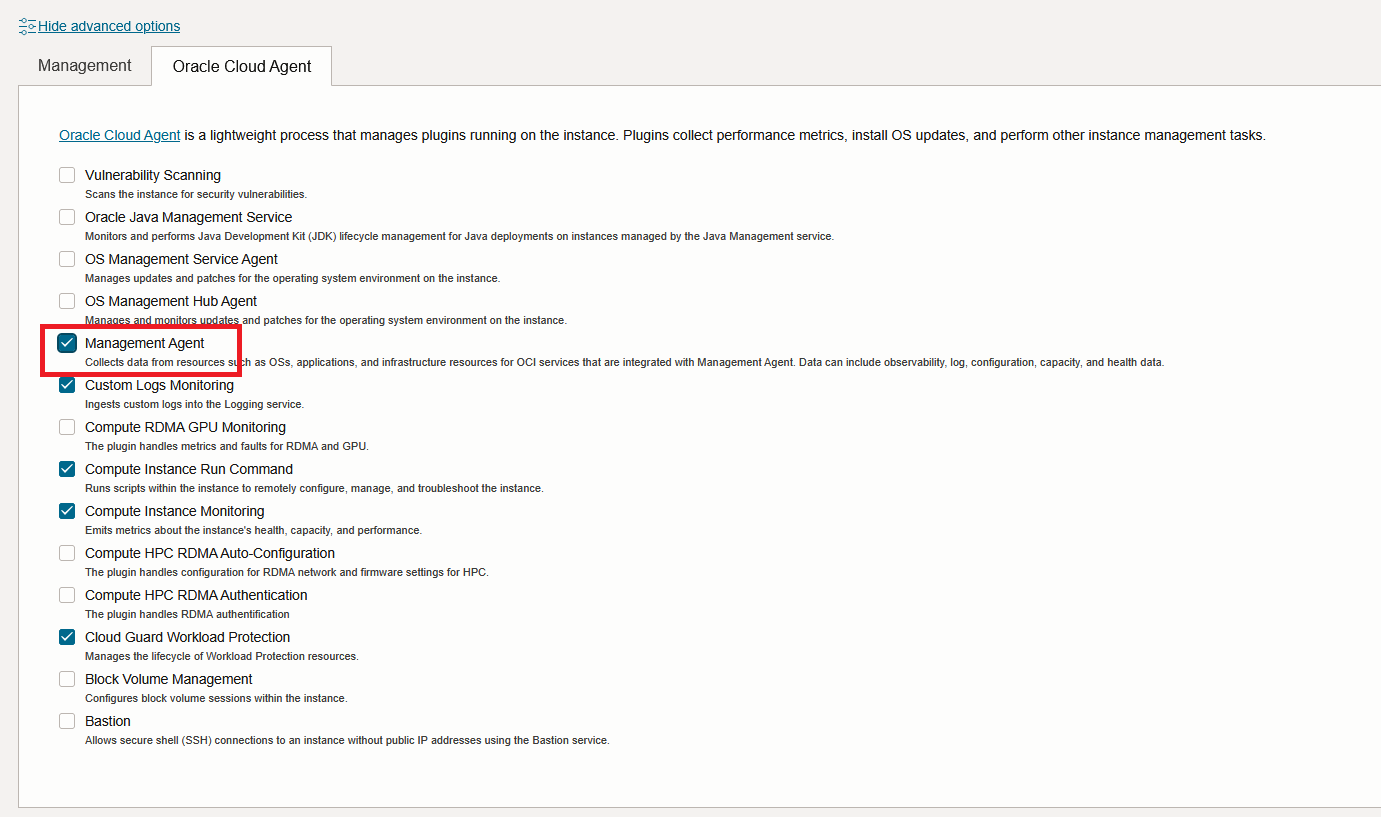
3. Deploy a Host for the Management Agent. I will use Oracle Linux from an OCI Image which will provide the Agent out-of-the-box but in a disabled state by default. Enable it during the VM creation. If you use a pre-existing VM, go to the VM details and enable the Agent.
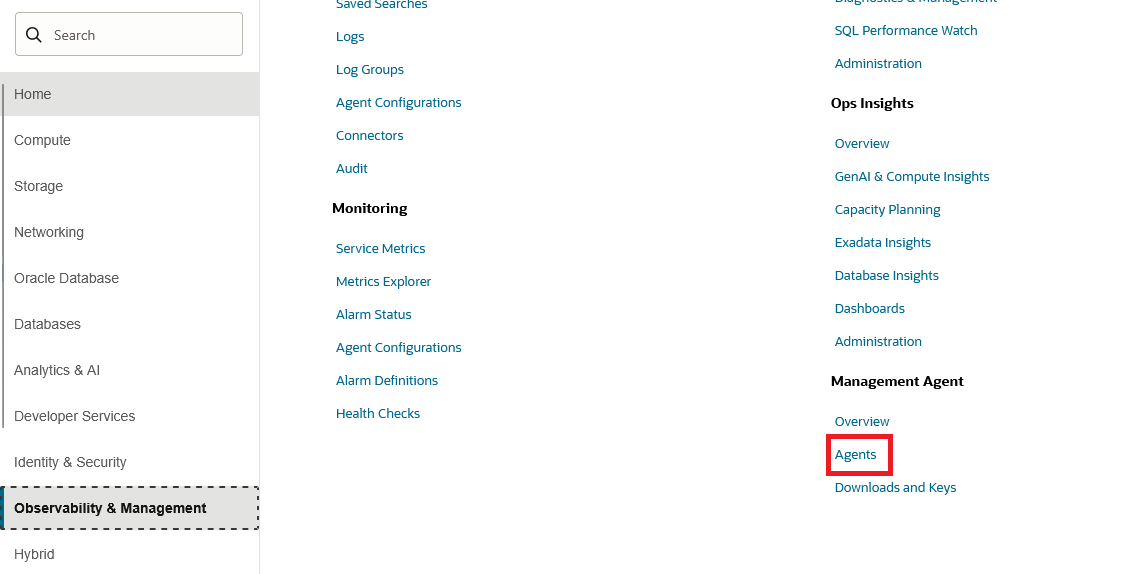
4. A few minutes after the VM is running, the service will autocreate an entry in the OCI Console. Go to “Agents” under “Management Agent” .
You should see the Agent in an Active state. Go to the end of the line to deploy plug-ins.
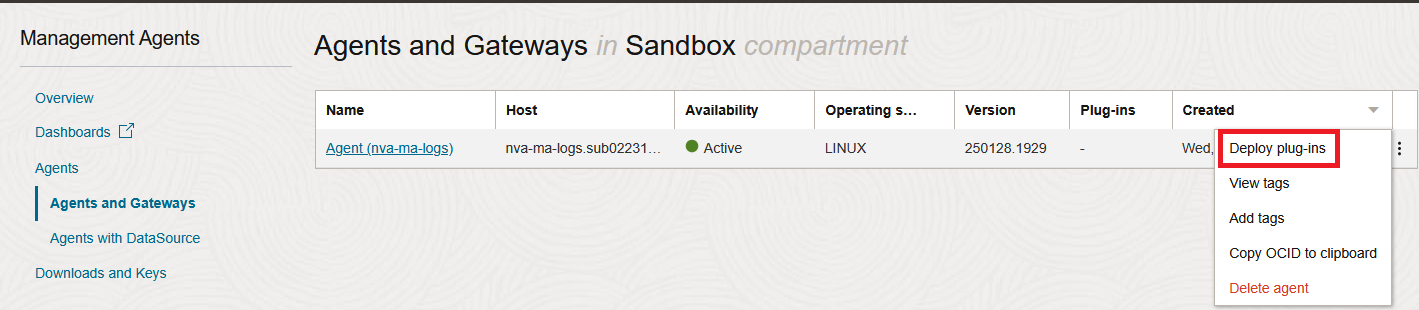
Deploy the Logging Analytics plugin.
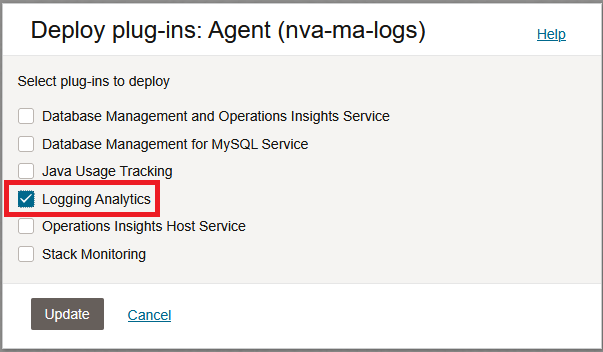
After you click Update, give it a few minutes to install and announce itself to the Logging Analytics service.
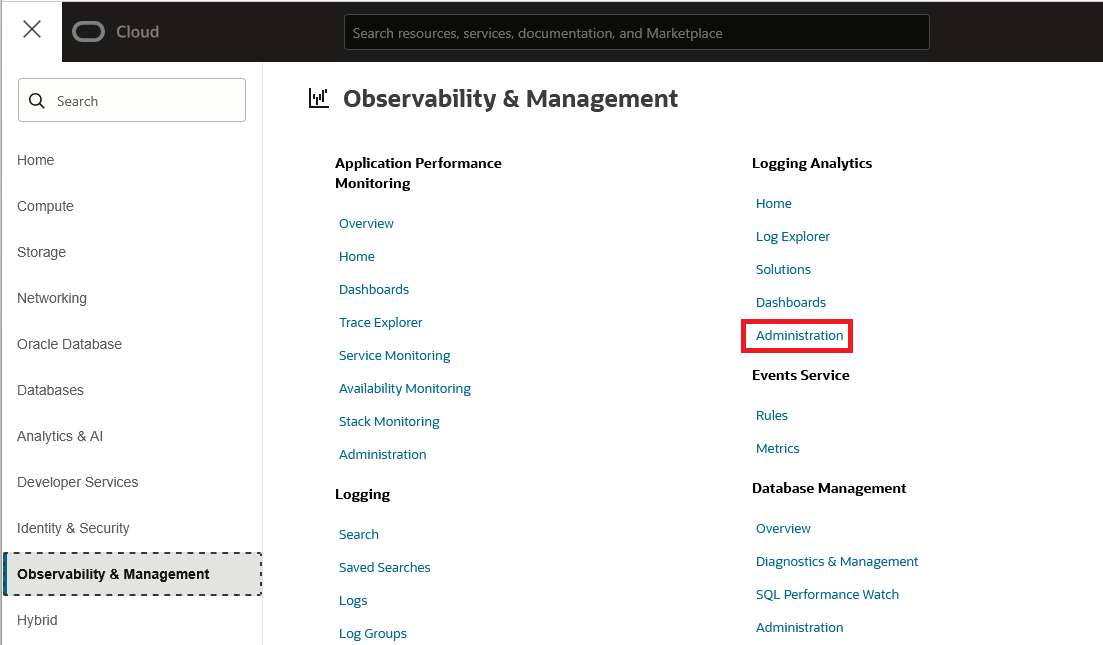
5. Next, go to the Logging Analytics Administration page:
On the left side, select Entities and make sure the service automatically created an Entity for the Compute you previously deployed, based on its name. Note that the service will create multiple entities for the VM.
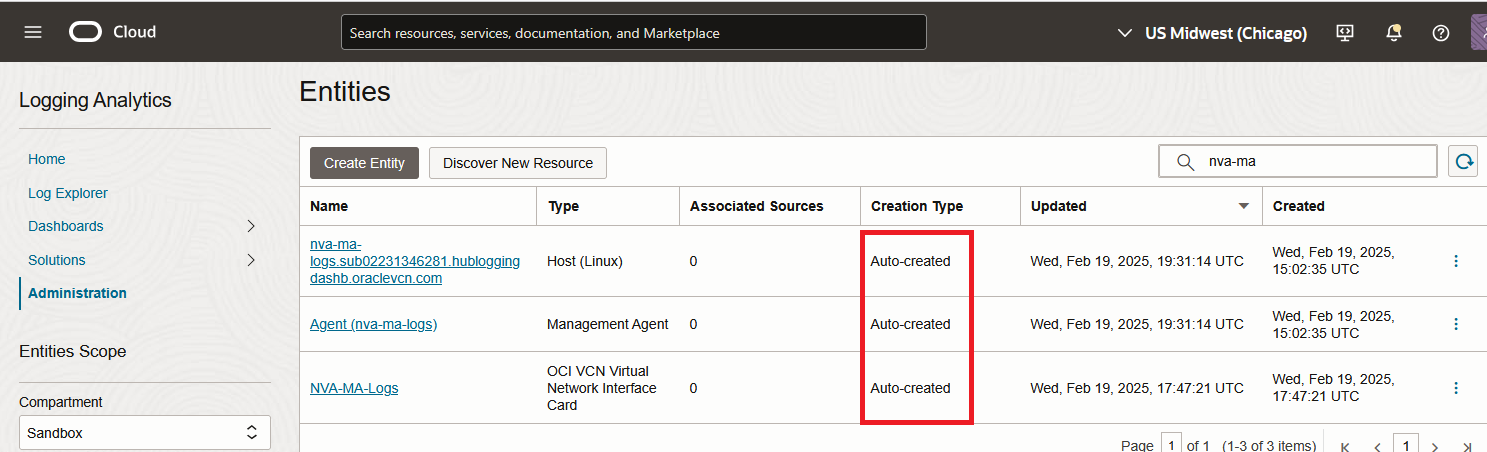
If the Entity was not created in a few minutes, do not move forward, try to redo the steps.
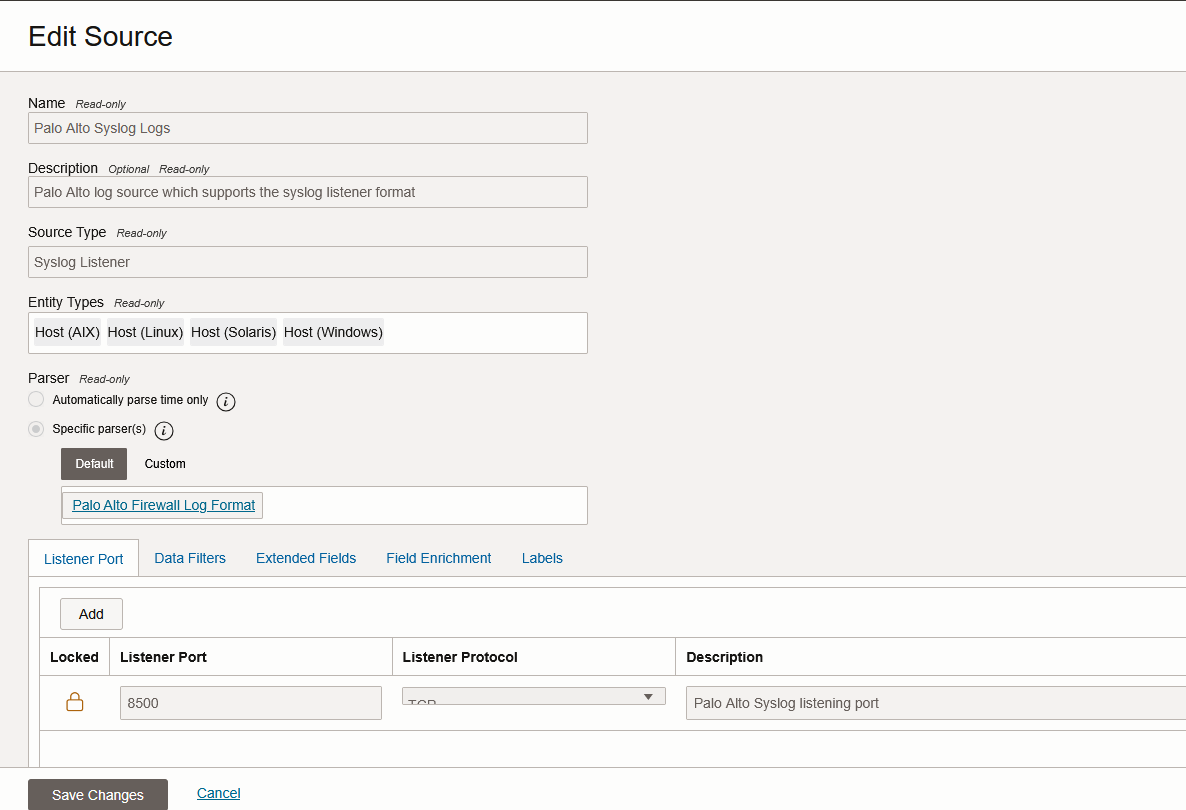
6. Before moving on the the Vendor specific configuration, we need to gather some data. OCI will provide preconfigured Sources for most NVAs but they are predefined with TCP and a non-stand syslog port. Go to this page and find if the NVA is automatically supported and on which port will the Management Agent listen. For our demo, we need to look for Palo Alto, Fortinet and Checkpoint, which will be:
– Palo Alto – TCP port 8500
– Fortinet – TCP port 8509
– Checkpoint – TCP port 8511
You can also see this info if you look in the predefined Source:
Vendor specific configuration
After the configuration above is done, we need to create a configuration which varies slightly between vendors.
Palo Alto
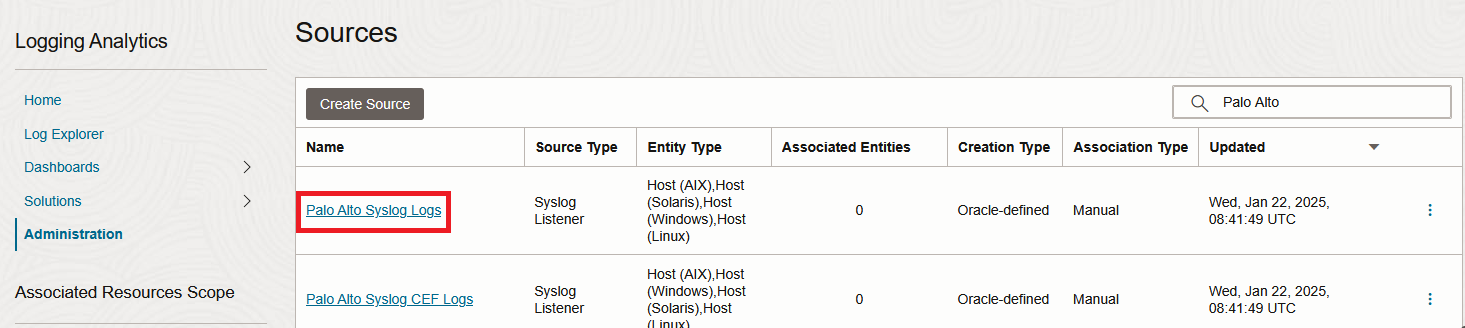
1. Go to Logging Analytics Administration page and click on sources, on the left. Filter all sources with “Palo Alto” and click on the first one.
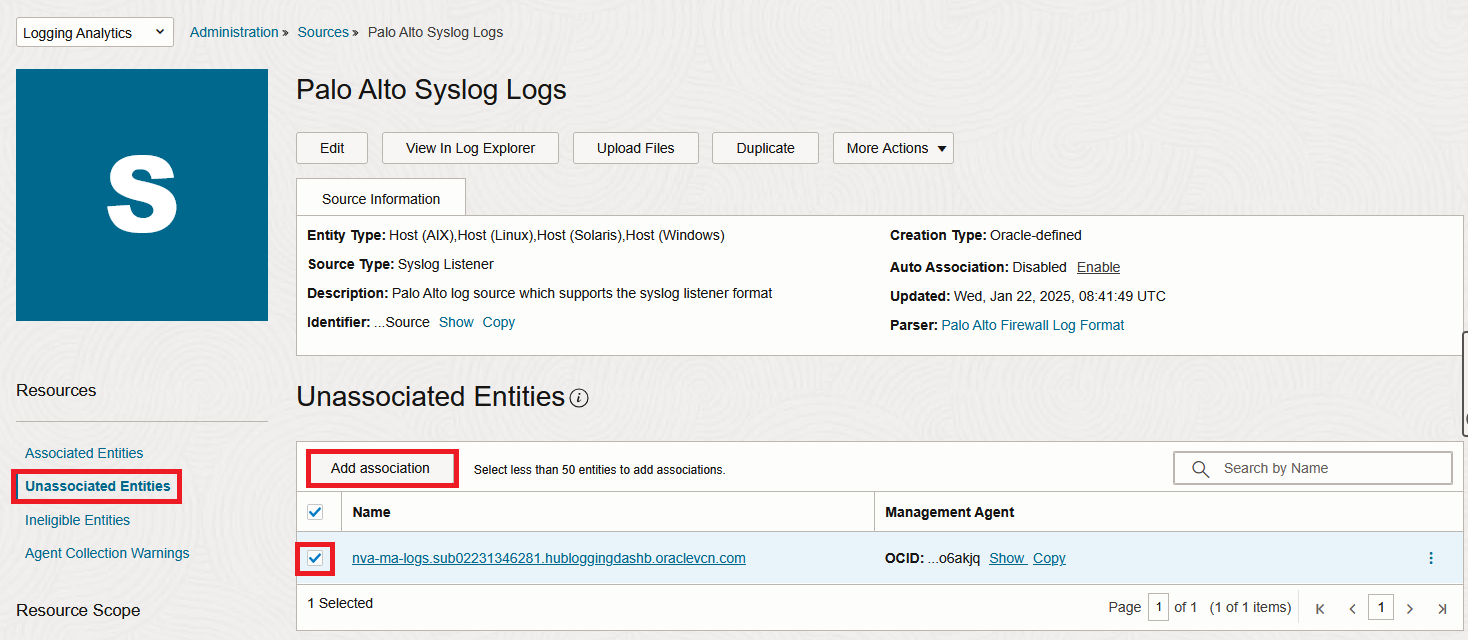
2. In the new menu, click “Unassociated Entities” and select your Entity then click “Add association”. Select a log group and Submit.
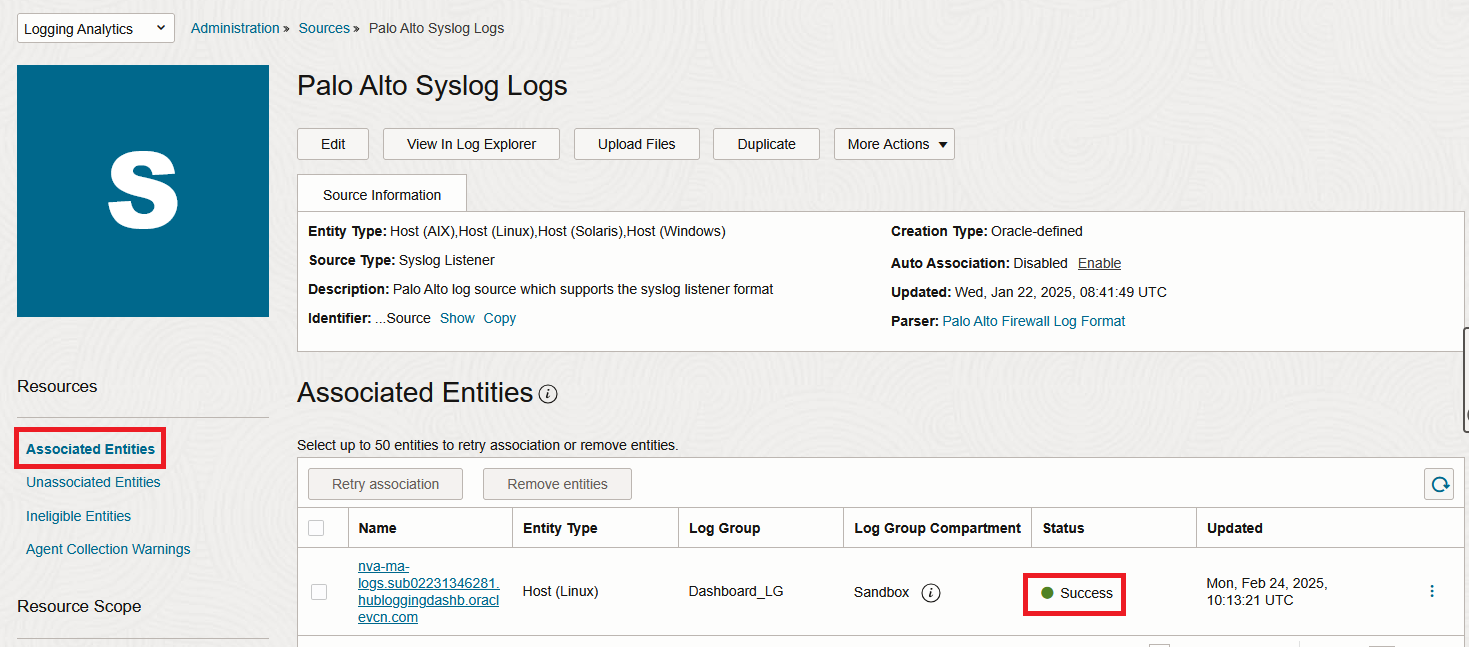
In a few seconds, the VM should appear under the “Associated Entities” menu:
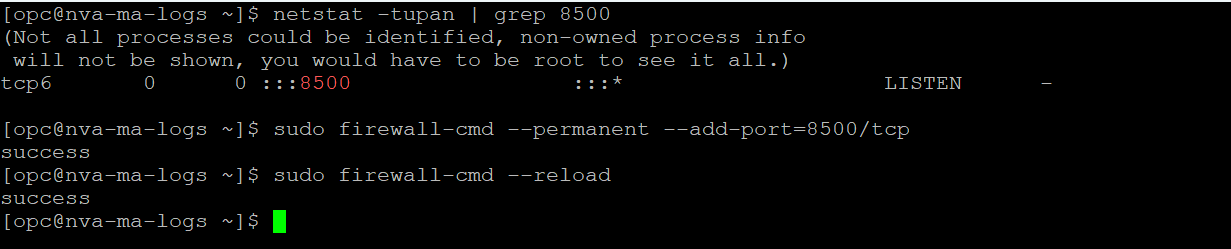
3. Login to the VM with SSH. When you do the association, the service automatically configures the Syslog server on the VM, with the predefined port (which is 8500 for Palo Alto). Make sure that it happened and also add firewalld entries for that port.
netstat -tupan | grep 8500
sudo firewall-cmd --permanent --add-port=8500/tcp
sudo firewall-cmd –reload
4. Now let’s move to Palo Alto configuration.
Login into the PA Firewall and define a Syslog server profile:
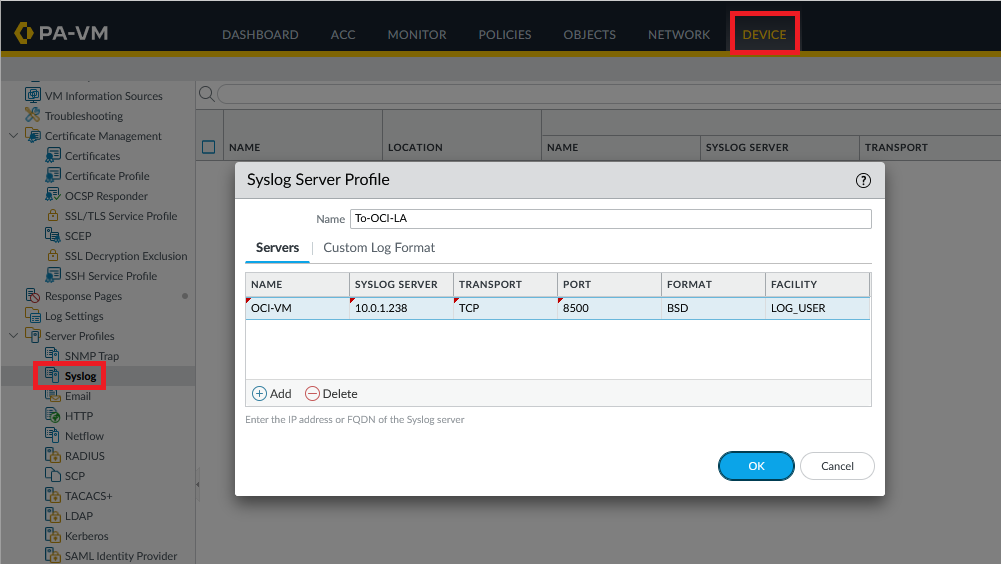
We will leave the log format in the default schema.
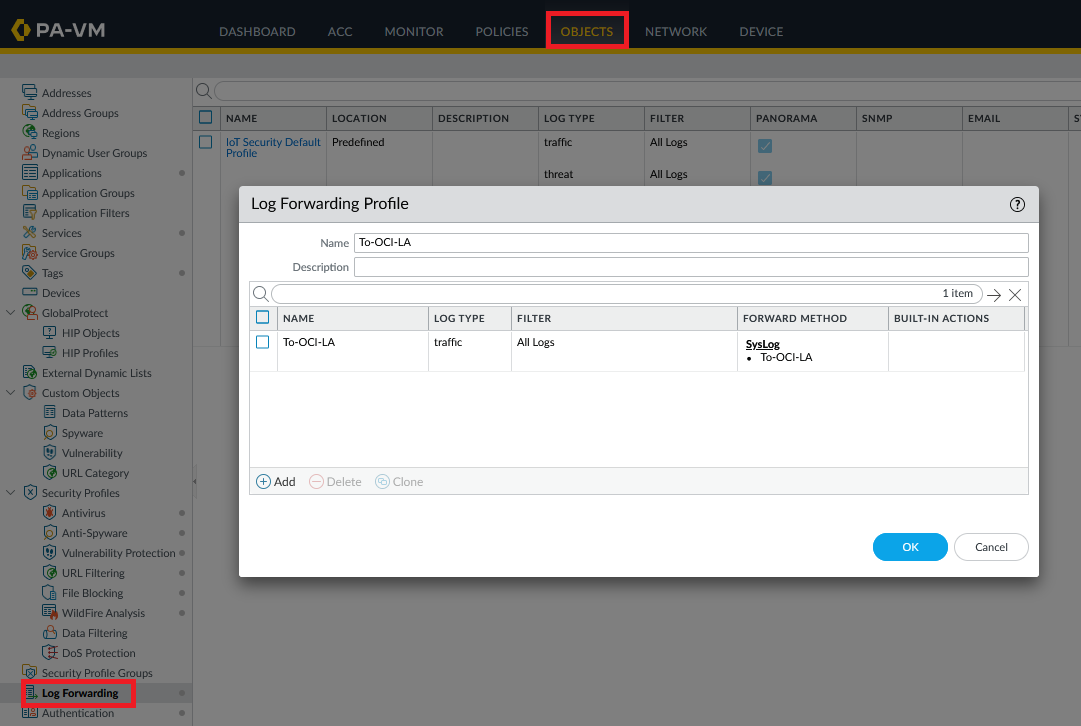
Next, define a log forwarding profile, for Syslog, which uses the previously created Server Profile. Note that I will focus on Traffic Logs but you can follow this procedure for any log type.
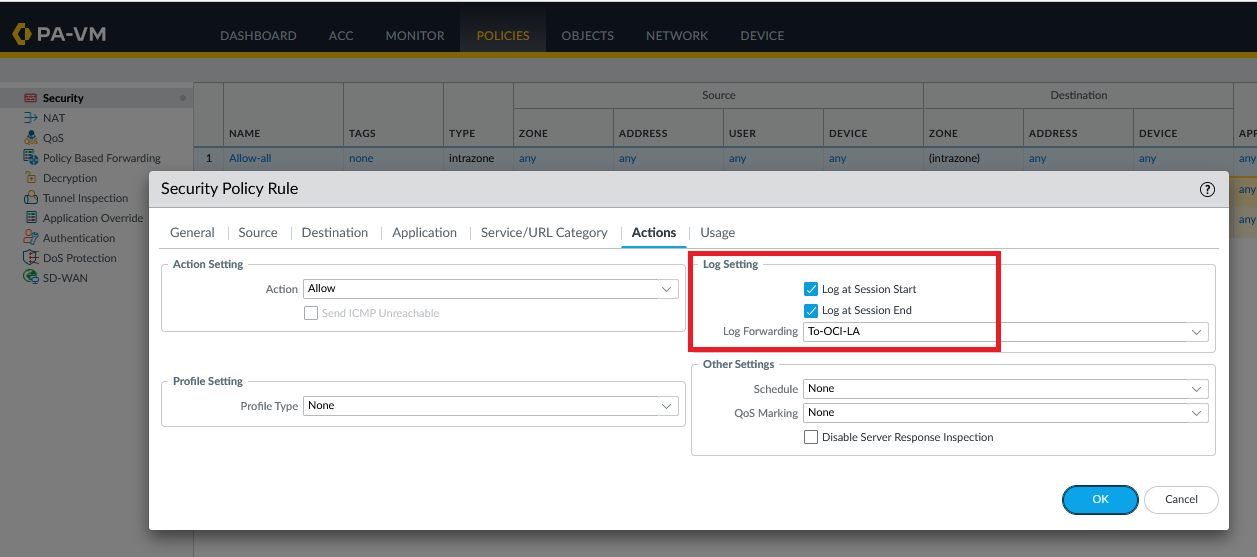
Last, enable Log Forwarding on any Security Policy you want:
Commit the configuration. In a few minutes, the Logs should appear under Logging Analytics Log Explorer.
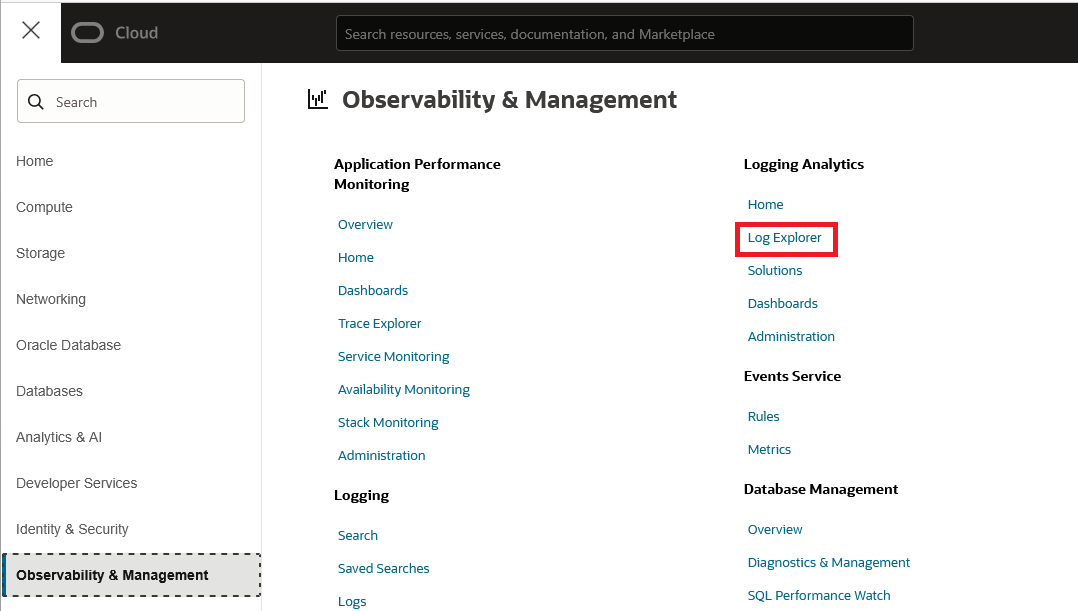
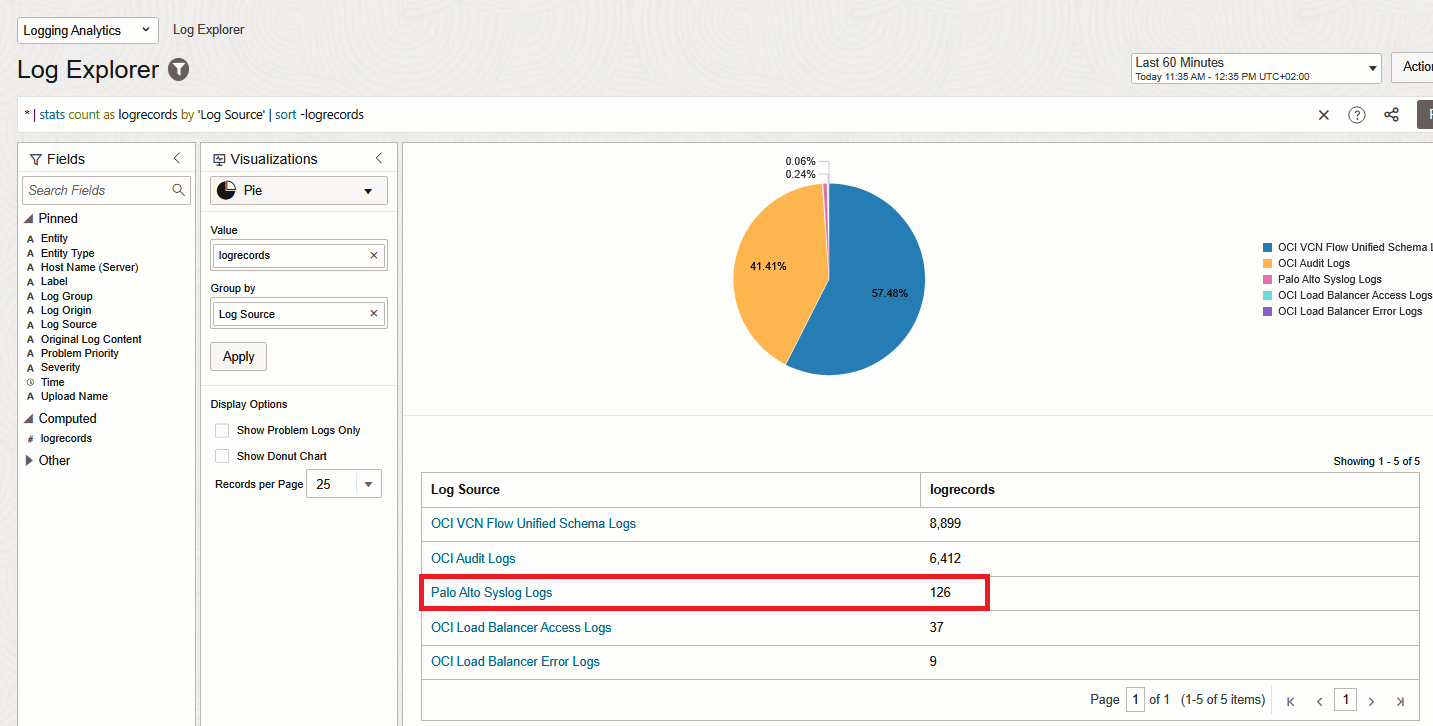
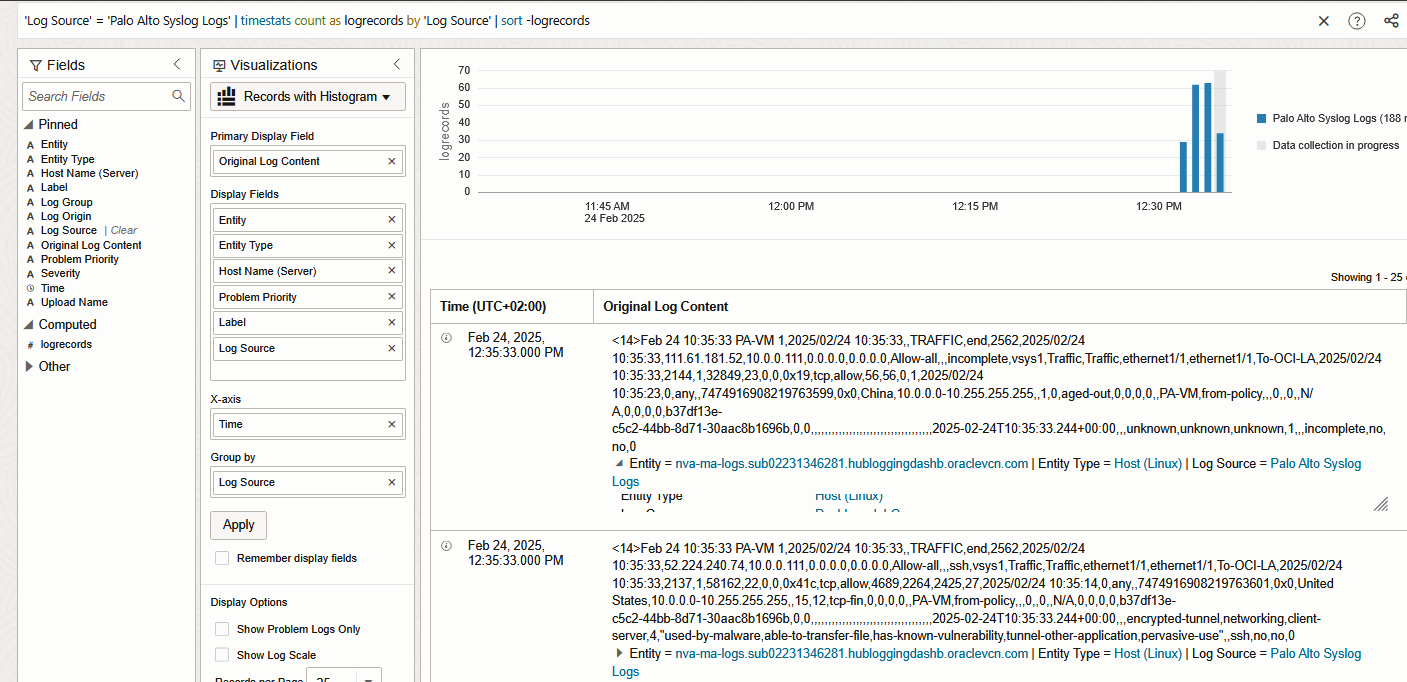
And that’s it! We are now injecting Palo Alto Traffic Logs into Logging Analytics.
Fortinet Firewall
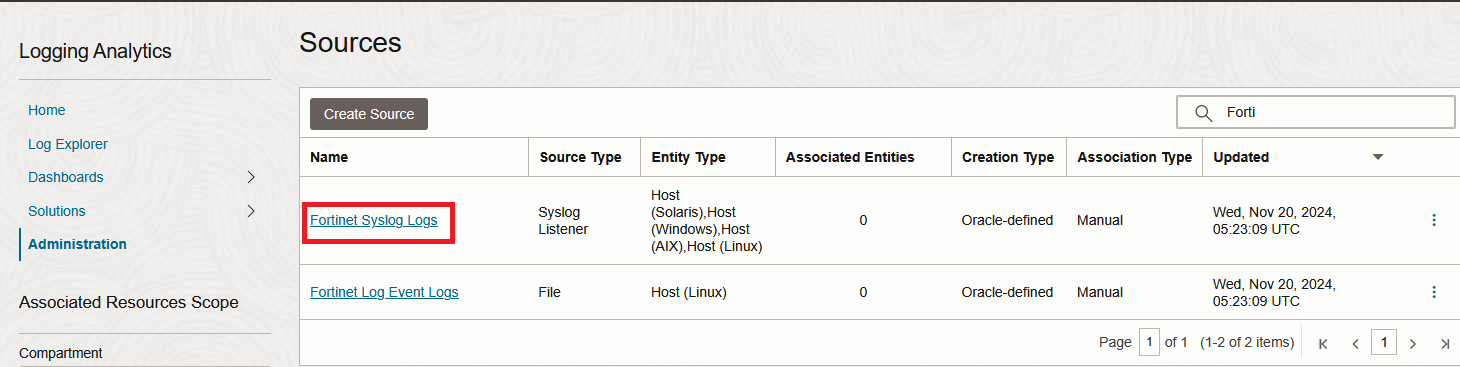
1. Go to Logging Analytics Administration page and click on sources. Filter all sources with “Fortinet” and click on the first one.
2. In the new menu, click “Unassociated Entities” and select your Entity then click “Add association”. Select a log group and Submit.
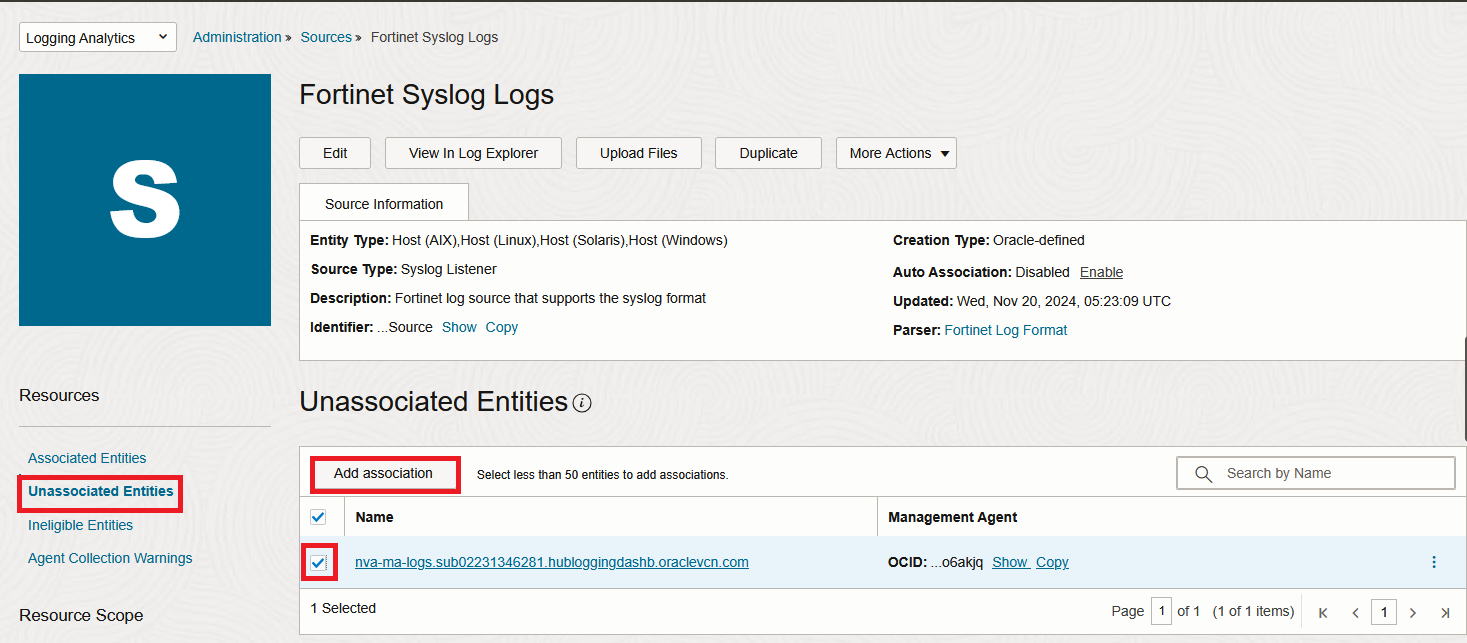
In a few seconds, the VM should appear under the “Associated Entities” menu:

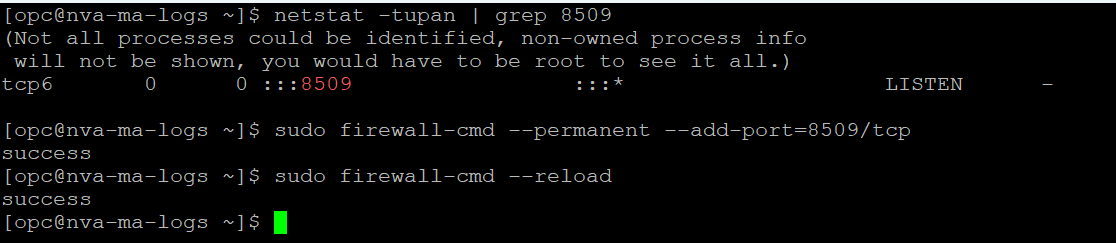
3. Login to the VM with SSH. When you do the association, the service automatically configures the Syslog server on the VM, with the predefined port (which is 8509 for Fortigate). Make sure that it happened and also add firewalld entries for that port.
netstat -tupan | grep 8509
sudo firewall-cmd --permanent --add-port=8509/tcp
sudo firewall-cmd --reload
4. Now let’s move to Fortinet configuration.
Login with SSH into the Fortinet Firewall and configure the Syslog server:
config log syslogd setting
    set status enable
    set server "10.0.1.238"
    set mode reliable
    set port 8509
end
For the server IP use the IP of the Agent VM. Note that the Parser is configured to work with the Default Syslog format.
5. In a few minutes, the Logs should appear under Logging Analytics Log Explorer.
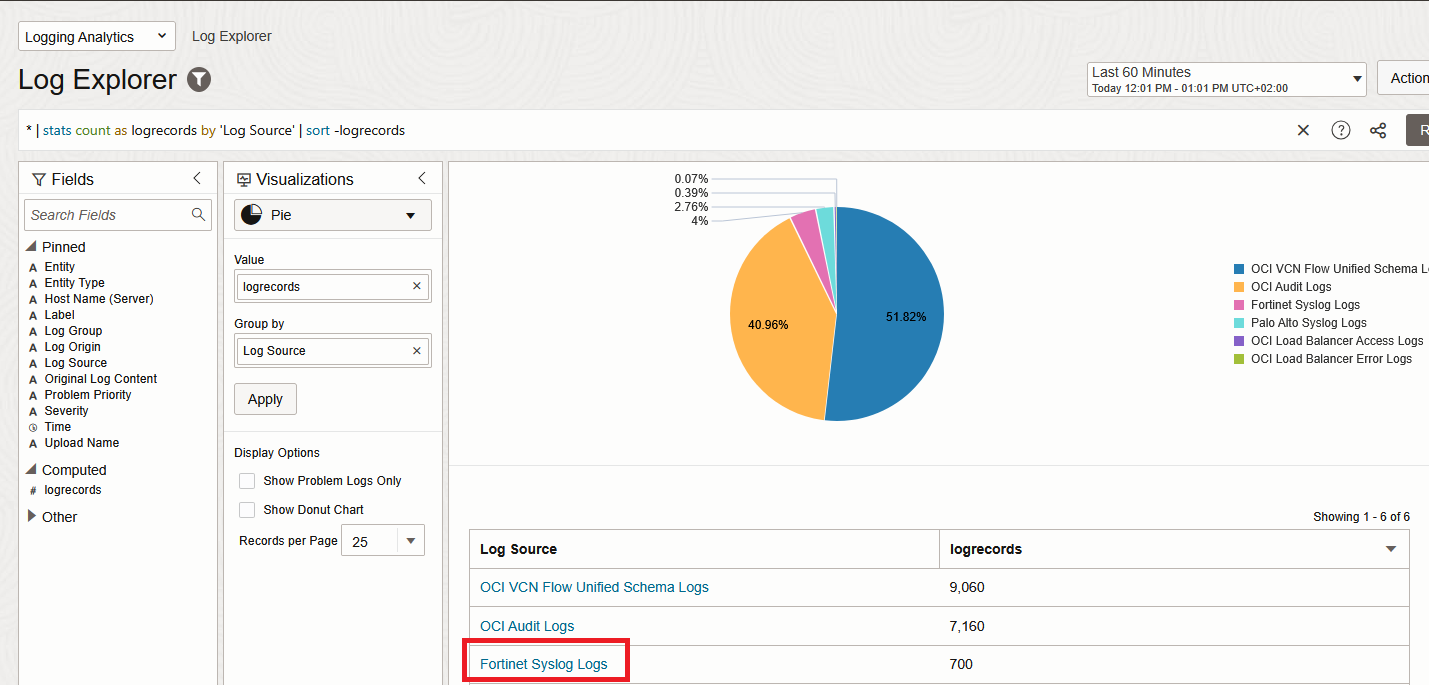
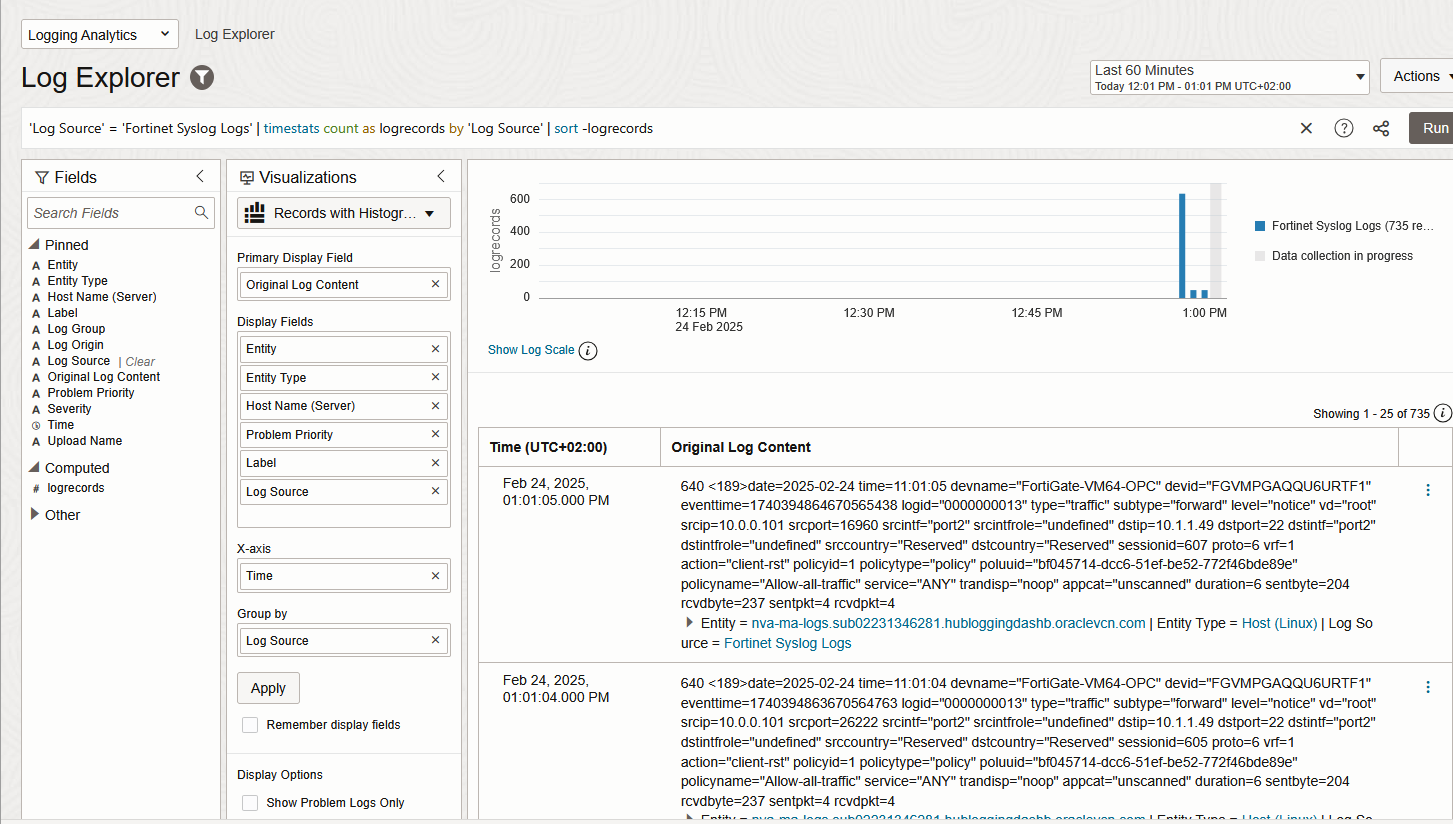
And that’s it! We are now injecting Fortinet Traffic Logs into Logging Analytics.
Checkpoint
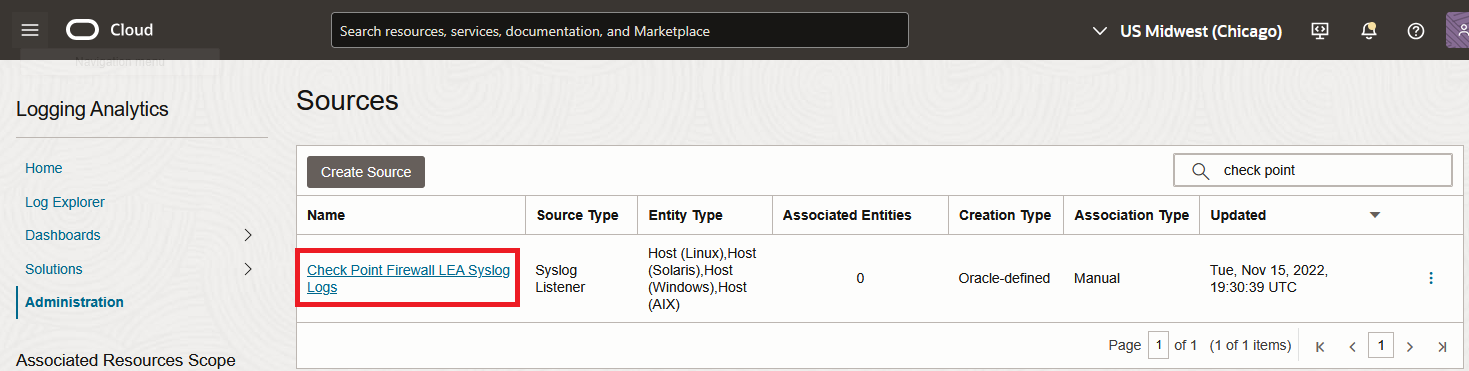
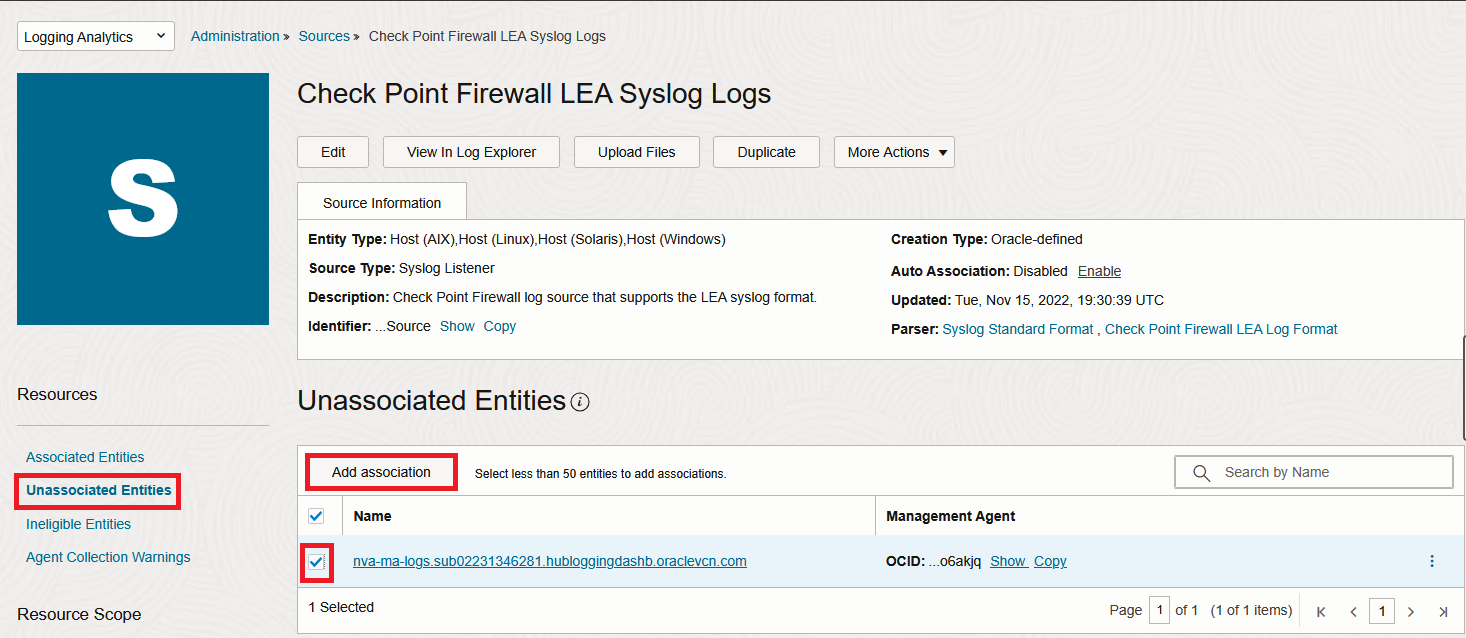
1. Go to Logging Analytics Administration page and click on sources. Filter all sources with “Check Point” and click on the result.
2. In the new menu, click “Unassociated Entities” and select your Entity then click “Add association”. Select a log group and Submit.
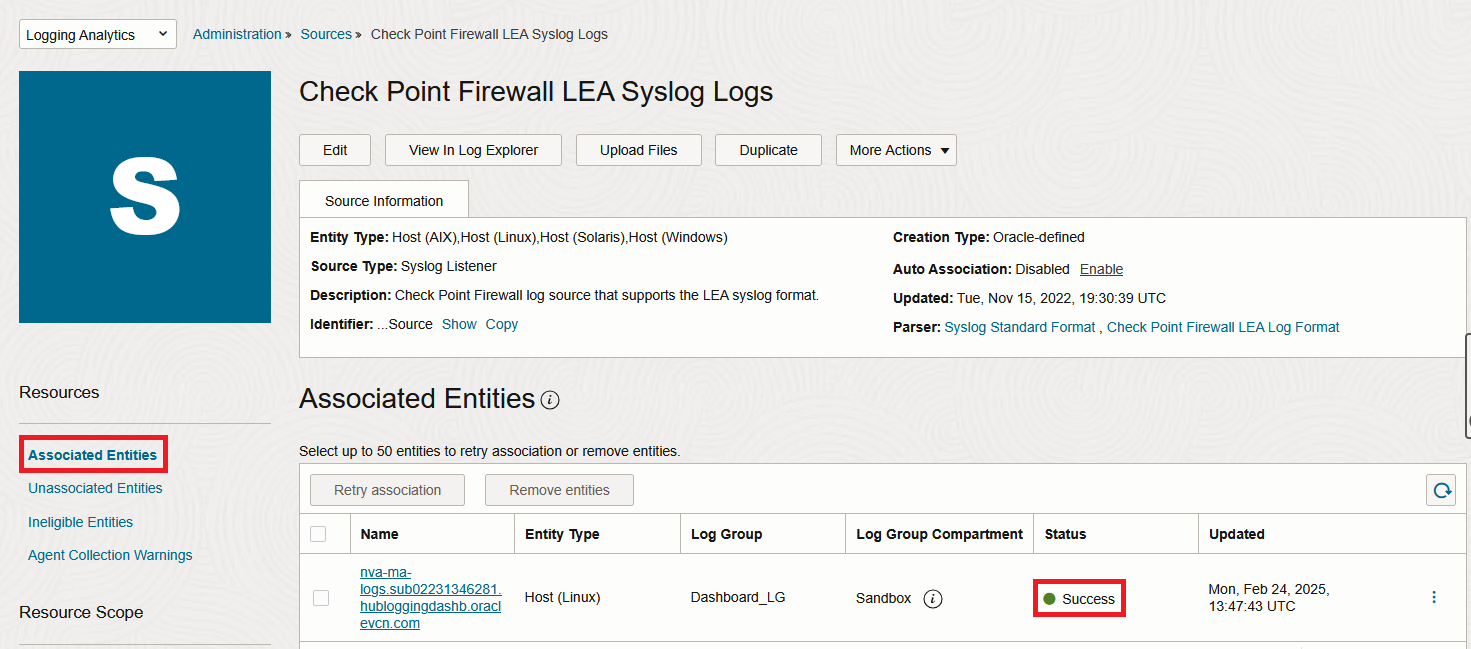
In a few seconds, the VM should appear under the “Associated Entities” menu:
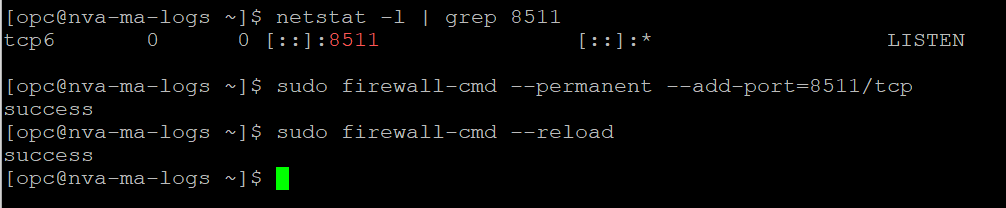
3. Login to the VM with SSH. When you do the association, the service automatically configures the Syslog server on the VM, with the predefined port (which is 8511 for Checkpoint). Make sure that it happened and also add firewalld entries for that port.
netstat -l | grep 8511
sudo firewall-cmd --permanent --add-port=8511/tcp
sudo firewall-cmd --reload
4. Checkpoint configuration
Prerequisites:
– The Checkpoint Firewalls require the use of a Security Management Appliance to be able to create the advanced logging configuration.
– The Security Management Appliance must already be connected to any Firewalls that will send logs to the Agent VM.
– You will also need the Smart Console software to connect to the Management System.
The Checkpoint logging will use the standard Syslog format . Note that the OCI Parser was built to work with the LEA Module on the Checkpoint firewalls but the vendor is recommending to move to Log Exporter.
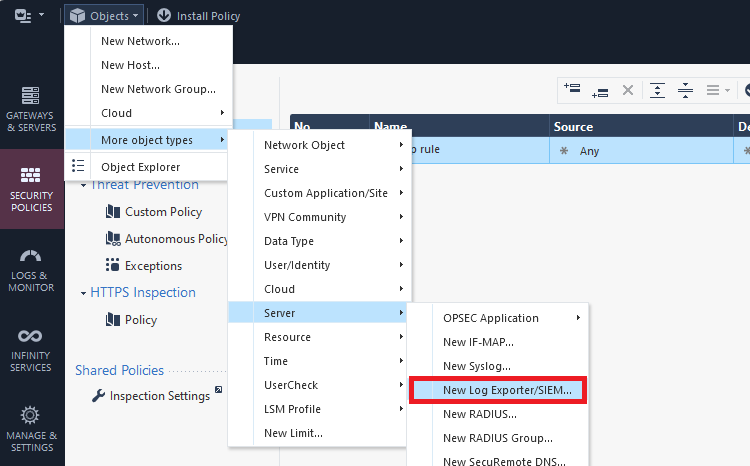
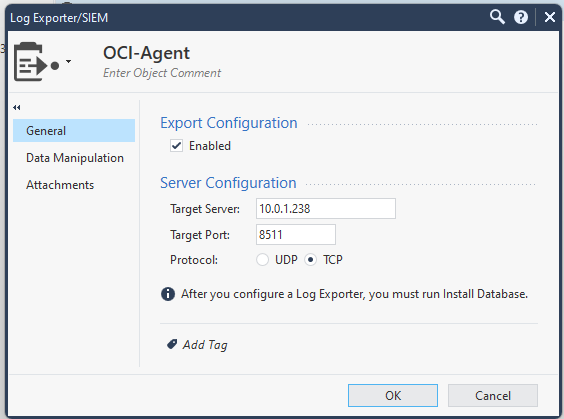
Connect to the Management System with the Smart Console. Create a new Log Exporter:
Under General, input the correct IP, port and protocol as configured on the VM, in the previous steps.
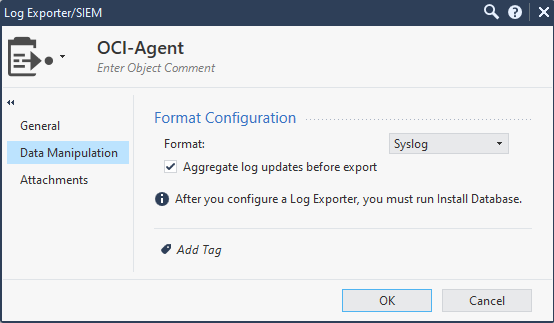
Next, under “Data Manipulation”, make sure you standard Syslog is selected.
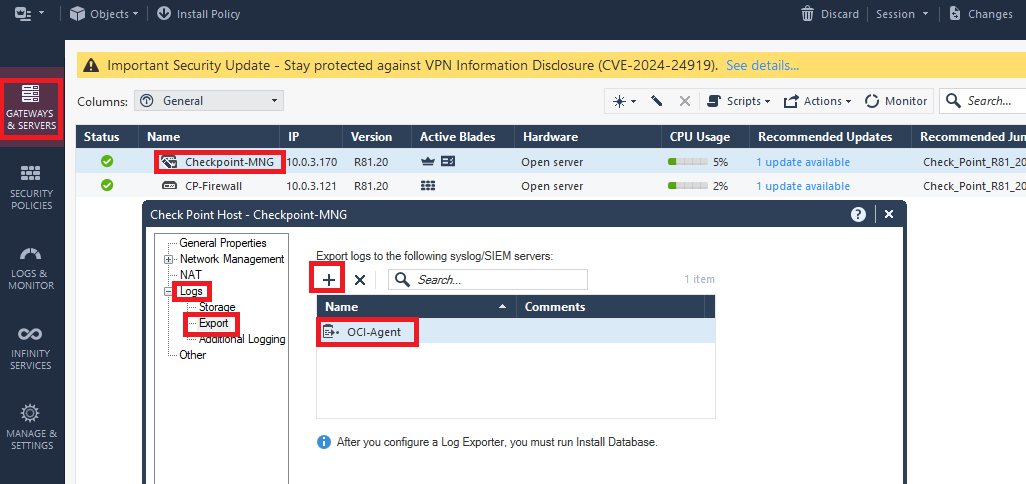
Next, click “Gateways and Servers”, then double click the Management server, then go to Logs/Export and add the newly created Export target.
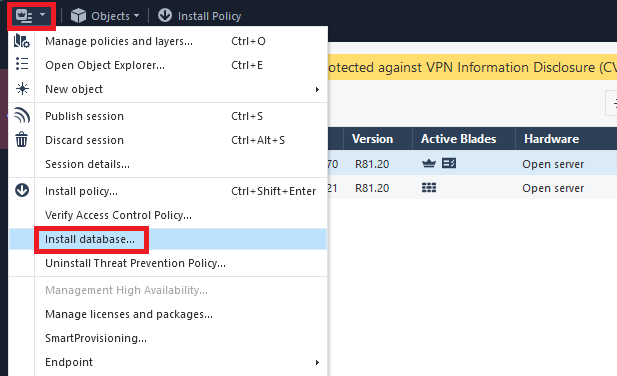
Next, click the dropdown menu and select “Install database” and accept the inputs to start the installation.
After the install is completed, make sure your security policies are configured to log the traffic.
5. In a few minutes, the Logs should appear under Logging Analytics Log Explorer.
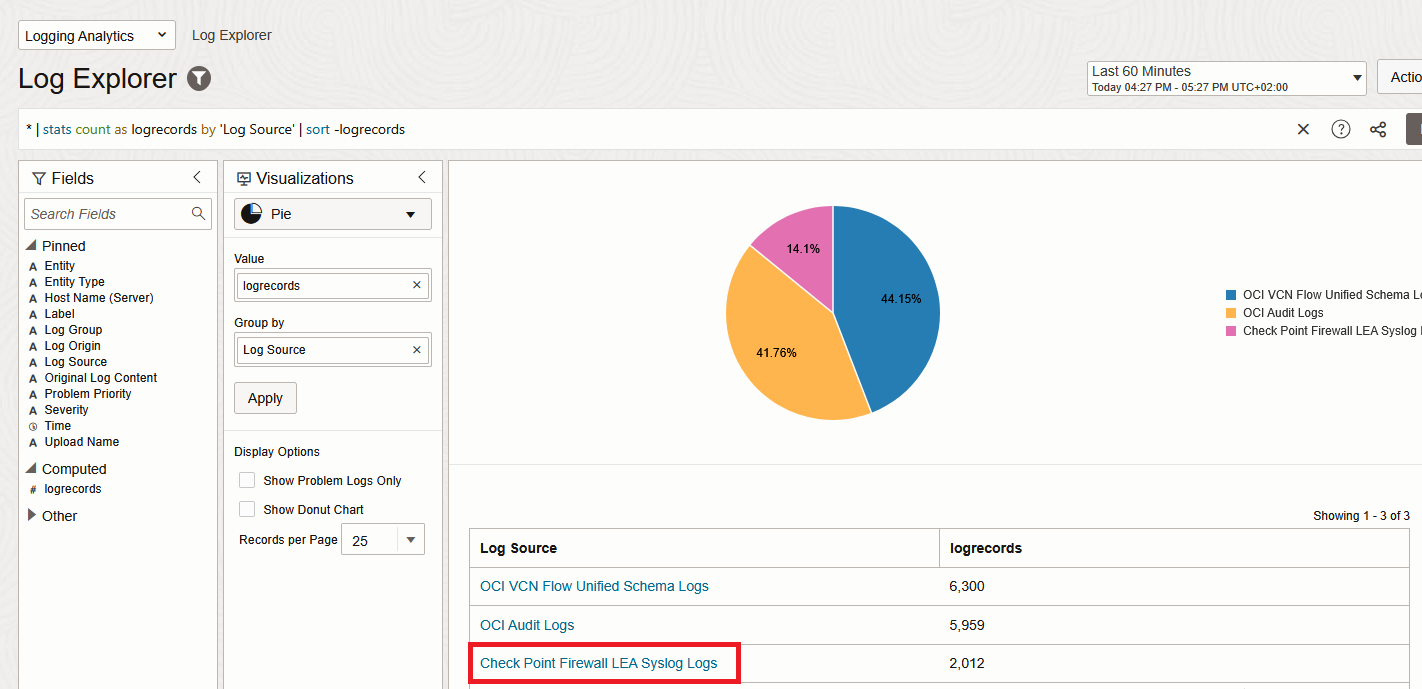
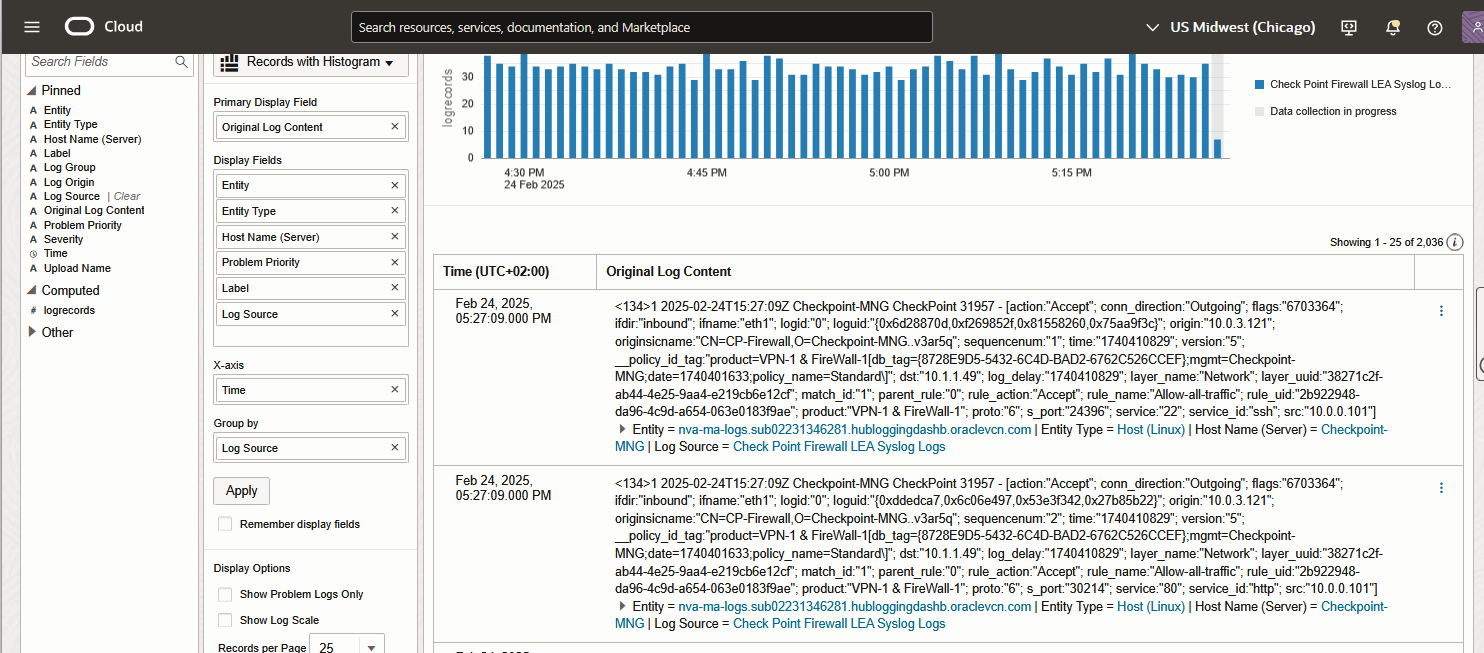
And that’s it! We are now injecting Checkpoint Traffic Logs into Logging Analytics.
Final thoughts
Once you have the Logs in Logging Analytics you can:
– Perform advanced querries on them and build build graphical representations of the output.
– Build Network Security Dashboards for a quick view on your network’s security posture.
