Hi! Welcome to a 3-part blog series focused on integrating NVA (Network Virtual Appliance) logs with OCI native logging services.
Quick links:
Integrating 3PP Firewalls with OCI Logging Services – Concepts
Integrating 3PP Firewalls with OCI Logging Services – Unified Monitoring Agent Demo
Integrating 3PP Firewalls with OCI Logging Services – Management Agent Demo
OCI Logging Services
Oracle Cloud Infrastructure has two distinct services for logging, each with its own function:
– OCI Logging service – each network service (ex: Load balancer, native network firewall,etc) that you deploy on the cloud platform can generate Service Logs automatically, without any additional configuration except enable/disable.
– OCI Logging Analytics – the Logging Analytics service is a cloud solution in Oracle Cloud Infrastructure that lets you index, enrich, aggregate, explore, search, analyze, correlate, visualize, and monitor all log data from your applications and system infrastructure.
These two services will easily work with cloud native logs but what happens if we want to interact with logs for a service or application that is not cloud native? The Logging Service has the ability to create Custom Logs where the source of the log can be virtually anything and there are also ways of creating custom logs inside Logging Analytics. Also, there are ways of moving logs from the Logging service to Logging Analytics, should you need it.
The easiest way to add external logs to those two services is with the use of Agents. OCI provides multiple types of agents that can be used for a variety of functions. More than that, any virtual machine that you deploy in the cloud from an OCI provided image will have most of these agents preinstalled and ready to go with a little extra configuration. For a deep dive on OCI provided Agents please review this great blog post. For the purpose of this blog, we will focus on only two Agents, the Unified Monitoring Agent and the Management Agent.
Agents for OCI Logging and Logging Analytics services
As said above, any virtual machine that you deploy using a cloud provided image should have the agents preinstalled. If they are not or if you use custom images, you can simply install them manually. Let’s look at what agent is needed for each of the two logging services:
– The agent for the OCI Logging Service that will interact with Custom Logs is called the Unified Monitoring Agent. In this link you will find details on the service and steps to install it if you are not using OCI provided images.
– The Logging Analytics Service does not have a dedicated agent but will work with the Management Agent which has a pluging dedicated for this service.
How does it work? We deploy one or more Virtual Machines which have the agent running and then we send logs to them in a format they can understand, using Syslog. Let’s look at a diagram:
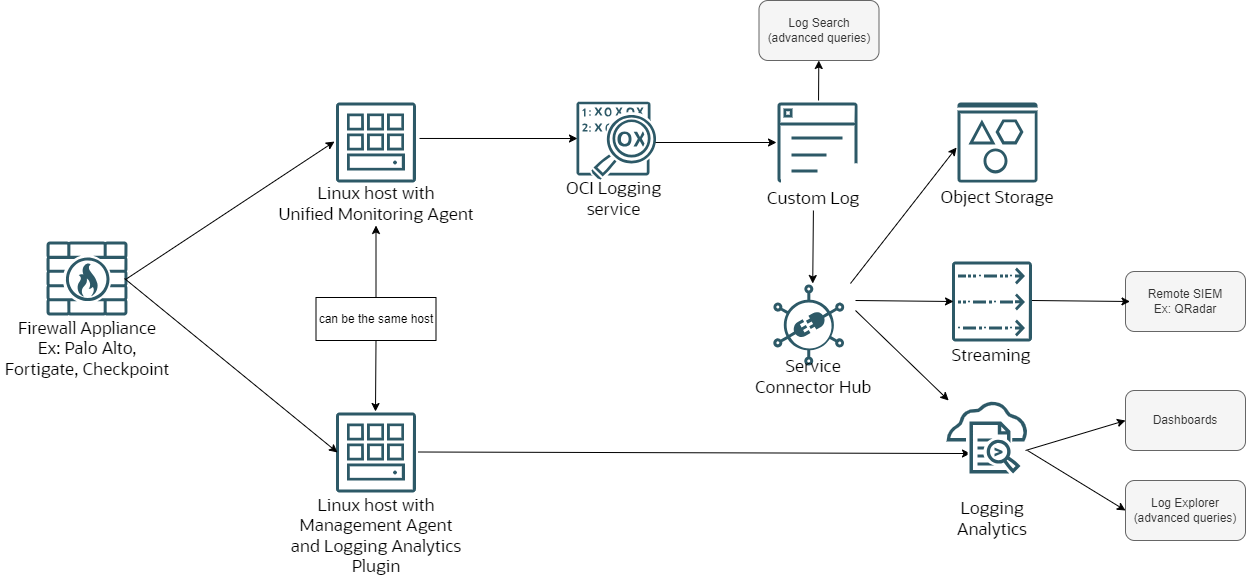
Both the Unified Monitoring Agent and the Management agent (with its plugin) have some particularities related to configuration which we will explore in the sections below.
OCI Logging Service – Unified Monitoring Agent (UMA)
Let’s do a deep dive into the Unified Monitoring Agent configuration. For the purpose of this blog series, we will focus on creating a Custom Log that shows Traffic Logs from a remote Firewall with demos on Palo Alto, Fortigate and Checkpoint. The Custom Log can then be sent to various other native services (using a Connector), as shown in the picture above, but that will be outside of the scope for this blog series.
If we were to focus on the top part of the picture above, a more detailed diagram would look like this:
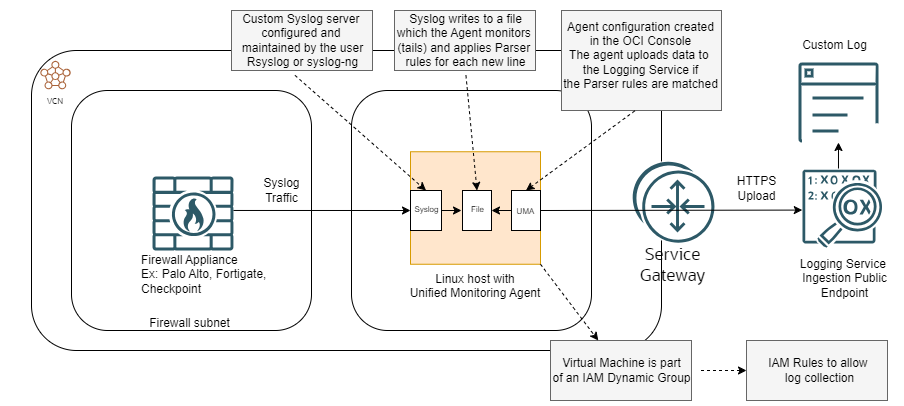
Lets discuss details on each of the involved components.
1. Log Source – The source of the log will be one or more Network Virtual Appliances. For the purpose of this series we will focus on Network Firewalls but it can be any Appliance that is capable of sending logs in the Syslog format. Also, any log type should work but I only tested with Traffic Logs.
One important thing to consider is the message format because that directly impacts the configured Parser on the OCI side. Most NVAs will do standard Syslog protocols (RFC-5424 and RFC-3164) with the Syslog message format but some NVAs (like Fortigate and Checkpoint) are able to send the logs in a JSON format, which greatly simplifies the OCI side configuration.
2. Agent Virtual Machine – The target of the traffic will be a Virtual Machine running the Unified Monitoring Agent. As said previously, most VMs deployed with an OCI provided image will have this agent preinstalled and preconfigured. The VM will need some user configuration, mainly on the syslog server side so SSH access to it is required. The Agent supports a number of Operating Systems and I used an Oracle Linux 8 for my tests.
Note that multiple VMs can be used with an OCI Network Load Balancer which will add a high-availability component for the architecture, however that is outside of the scope for this series.
3. Infrastructure – The VM will take the Syslog traffic, parse it with the configured Parser (more details below) of the UMA and then upload it to the Logging Service. The Logging Service Ingestion Endpoint is a public IP in the Region so the VM needs a path towards the Oracle Services Network. For my tests I used a VCN Service Gateway but a NAT Gateway would also work. Also, the routing and security constructs (NSG or SL) of OCI must allow the connectivity between the Firewall and the Agent Machine and from the VM to the Public Endpoint of the Logging Service.
4. OCI IAM Dynamic Group – after the VM that has the agent is created we need to configure a Dynamic Group with the VM’s OCID which will be used in an IAM Policy. If more VMs will be used, all of them need to be in the Dynamic Group.
5. IAM Policies – The VM and the Agent running on it need IAM Policies to be able to collect and upload logs to the Logging Service. The UMA Virtual Machine has a process that checks every few minutes for configuration done in the portal, downloads and applies anything you modify there. Only after the correct policies are in place will the VM be able to do that.
6. VM Syslog configuration – The Syslog configuration on the VM running the UMA is manual. A few points here:
– Any syslog server should work, I used Rsyslog because it comes preinstalled on Oracle Linux and I am more familiar with it but syslog-ng or any other should work just fine.
– The underlying transport protocol of the data can be either UDP or TCP as long as both sides ( VM and Firewall) support the configuration. TCP is recommended if you expect high volumes of logs.
– The format of the lines written by Syslog in the log file is extremely important because the UMA must be able to understand the content. The default Syslog configuration will write the log lines in the format Date+Time Source Actual-received-message. The problem is the first fields (Date+Time and Source) are preventing the OCI Parser to correctly work so we need to customize the Syslog service to remove them and put only the original Syslog message in the file. I will show how to do that in the demo blog.
7. Agent Configuration in the OCI Console. To create an Agent Configuration you will need:
a. The Dynamic group name create above with the correct IAM Policies in place.
b. A Custom Log as a target – when you create a Custom Log the Agent Configuration Wizard is launched.
c. Correct Parser configuration, detailed below.
Details on OCI Logging Parsers
The Unified Monitoring Agent uses fluentd to parse the logs. Whatever configuration you do in the OCI Console, the Agent will translate it into a fluentd configuration. While both Fluentd and the OCI Agent support multiple Parser types, only some of them will work with NVAs because of how they are defined. Also, I did not test all of them so you may find a better parser if you do your own tests. Out of the many Parser types , here are the ones I know will or will not work:
A) NONE – The first Parser type you can configure is “none”. This actually means the received content will not be parsed and the log entry will be taken “as is” and put in the Custom Log as a string. While this sounds great, it has a major drawback: unparsed logs are meaningless lines which the Log Explorer cannot understand so you will not be able to create a filter on a specific source IP, for example. Use this as a last resort, in case no other Parser works.
B) SYSLOG – While this would be the first one to think of as we are sending Syslog traffic from the NVAs, this will actually not work very well as the Syslog Parser has predefined fields which will not match a firewall traffic log. Do not use this parser at all as it will malform the log entry.
C) Regexp – This is what I would call the “universal” parser as it allows you to completely and freely define your log structure. The downside is it takes a lot of time to get it right and it requires knowledge of Regex. During the Parser definition you will have to state the Log structure in a format (?<NAME>PATTERN) where NAME is the name of the field (example: SourceInt, DestionationPort, etc) and Pattern is how the Parser looks for it in the received Syslog line. For most NVAs out there this would be the Parser to use. I will provide a demo on configuring it for Palo Alto.
D) JSON – This is the best Parser type because, in this format, the Log entry already contains the name of the field and the field value. This Parser will simply make everything work without any complex configuration, all fields will automatically match the NVA’s log structure. The downside is the NVA must be able to send the log entry in the JSON format natively which not a lot of NVAs can. Both Checkpoint and Fortinet are able to use this format so I will demo it in the next blog. Use this Parser whenever the source supports it.
Again, there are other Parser types that the Agent supports but they do not seem to work well with Firewall logs.
For a demo on UMA deployments for Palo Alto, Fortinet and Checkpoint, visit the 2nd blog in the series.
OCI Logging Analytics – Management Agent (MA) with the Analytics Plugin
The second service that supports integration with 3rd Party NVAs is the Logging Analytics service. As seen in the UMA discussion, you can take a Custom Log from the Logging Service and push it to Logging Analytics with a Connector. However, using the method below, you will completely bypass the Logging Service and send the logs directly to the Logging Analytics service.
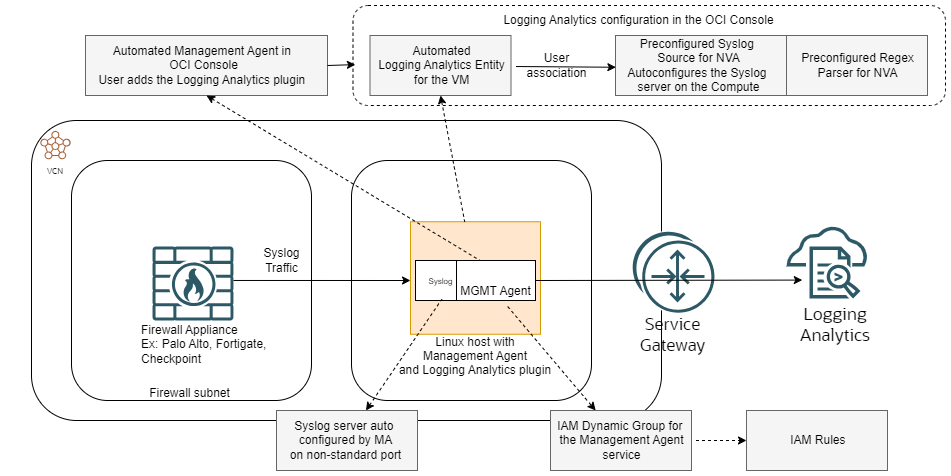
Let’s see the components of the solution:
1. Log Source – The source of the log will be one or more Network Virtual Appliances. For the purpose of this series we will focus on Network Firewalls but it can be any Appliance that is capable of sending logs in the Syslog format. Also, any log type should work but I only tested with Traffic Logs.
2. Management Agent VM – The target of the logs will be a Compute instance running the Management Agent. A big difference here is that the OCI provided images will come with the MA preinstalled but in a disabled state, as opposed to the UMA above which comes enabled by the default. When you enable the MA on the VM, a few things happen:
a. The Management Agent appears in the OCI Console. From there you will need to enable the Logging Analytics pluging so the Agent can talk to the service.
b. Once you enable the pluging, the Logging Analytics service autoconfigures something called an Entity which references the Virtual Machine running the MA. This Entity construct will further be used to apply Syslog and Parser configurations.
3. Infrastructure – The VM will take the Syslog traffic, parse it with the configured Parser (more details below) of the Logging Analytics service and then upload it. The Ingestion Endpoint is a public IP in the Region so the VM needs a path towards the Oracle Services Network. For my tests I used a VCN Service Gateway but a NAT Gateway would also work. Also, the routing and security constructs (NSG or SL) of OCI must allow the connectivity between the Firewall and the Agent Machine and from the VM to the Public Endpoint of the Logging Analytics Service.
4. OCI IAM Dynamic Group – after the VM that has the agent is created we need to configure a Dynamic Group for the Management Agent which will be used in an IAM Policy.
5. IAM Policies – The Agent running on the VM need IAM Policies to be able to collect and upload logs to the Logging Analytics Service.
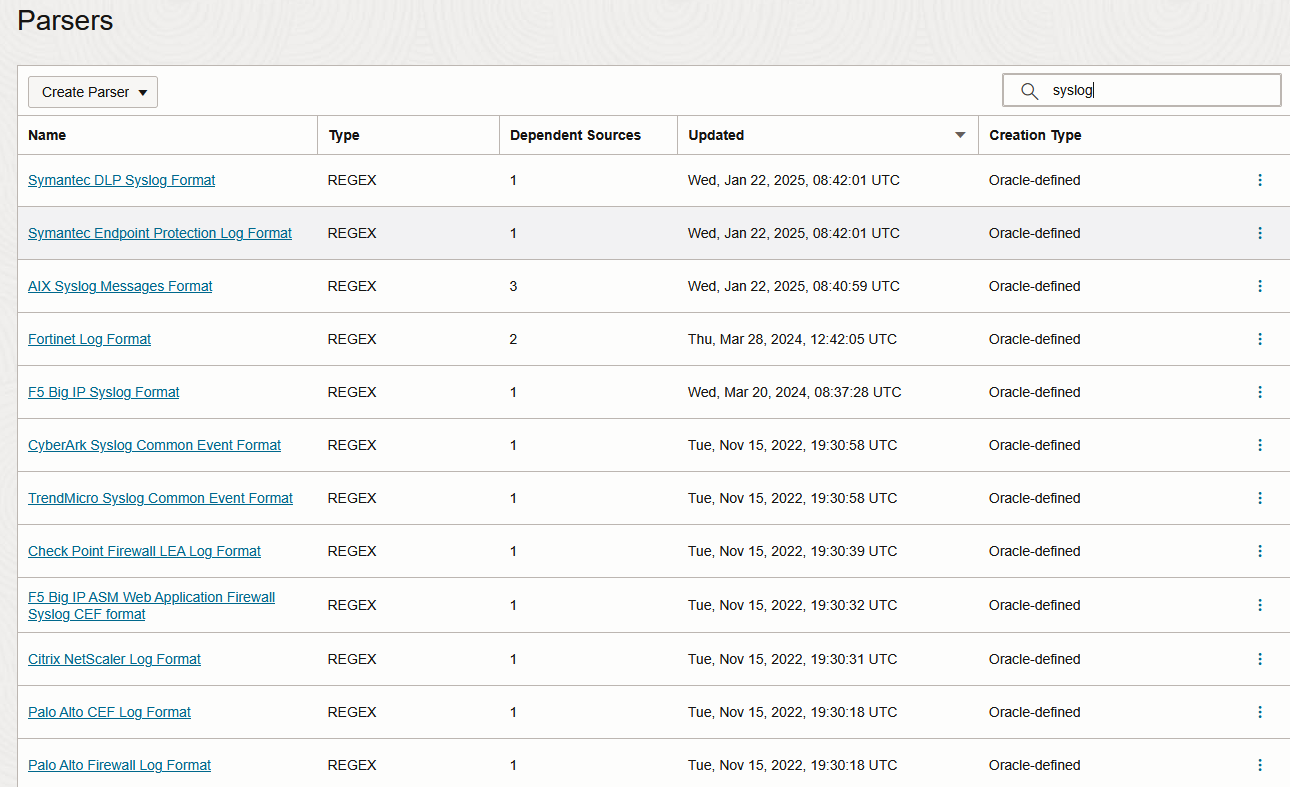
6. The Logging Analytics Parsers – Similarly to the Logging Service, the Logging Analytics service needs to parse the received Logs in order to create a structured entry which can then be interacted with for Dashboards or advanced querries. The nice thing is the service provides preconfigured Parsers for most NVAs (Palo Alto, Checkpoint, Fortinet included) which are created and maintained by the Analytics team. The Parsers are based on REGEX. Should you wish for it, you can create your own Parser with Regex or Json but for this blog we will use the preconfigured ones, seen below:
7. The Logging Analytics Sources – The sources are a construct which tells the service the method of log collection (ex: Syslog, File tailing, etc) and how to parse it (Parser). OCI does provide predefined Sources, based on Syslog, for a lot of NVAs. These are preconfigured to work on nonstandard ports to avoid conflicts. There is also the option to create your own Sources based on predefined or custom Parsers. For the demo I will use only predefined constructs.
So, to sum it up, the Management Agent workflow would be:
1. Create an IAM Dynamic Group based on the Management Agent Service, tied to the Compartment where the VM will be deployed.
ALL {resource.type='managementagent', resource.compartment.id='ocid1.compartment.oc1..aaaaaaaay22……'}
where the compartment is the one where you deployed the Virtual Machine.
2. Create IAM Policies for the Dynamic Group.
allow dynamic-group dg-name to use metrics in tenancy
allow dynamic-group dg-name to {LOG_ANALYTICS_LOG_GROUP_UPLOAD_LOGS} in tenancy
3. Deploy a VM in OCI using a cloud provided image which will have the Management Agent preinstalled. You can enable the agent at the VM creation menu. Alternatively, install and enable the agent.
4. Once the agent is enabled it will appear in the OCI Console under Observability & Management -> Management Agent. There is a menu there to enable the Logging Analytics Plugin.
5. The Agent will appear as an auto configured Entity under Observability & Management -> Logging Analytics.
6. (Optional) Write your own Logging Analytics Parser or use a predefined one. For many NVAs OCI provides predefined REGEX based Parsers which I will use in the demo.
7. (Optional) Write your own Loggin Analytics Source based on either File monitoring or Syslog with whatever Transport Protocol and Port you want. Link it to a Custom or Predefined Parser. Alternatively use the Oracle provided Syslog sources for NVAs which are already linked to the Oracle provided Parsers. These are based on TCP and a custom port.
8. Associate the Entity with the Source. This will make the Management Agent configure the syslog server on the VM and open the port.
9. Open the port in the VM Firewall (Firewalld, Iptables, etc).
10. Configure the Firewall to send Syslog traffic on the required port and using the required protocol (TCP/UDP). The Logs should appear in Logging Analytics.
For a demo on MGMT Agent deployments for Palo Alto, Fortinet and Checkpoint, visit the 3rd blog in the series.
Final thoughts
– You can use the same Virtual Machine for both services. If you do that, the best way would be to have the Management Agent do source tail of the log file.
– Especially for the Logging Service (Unified Monitoring Agent), make sure you have correct log rotation configured as Firewall logs will quickly fill the local storage.
– Always check the Usage on the VM running the Agents and make sure you add enough OCPUs/Memory so it can handle the incoming traffic.
– If you have multiple sources it is better to distribute the traffic across Agent machines with an OCI NLB. If you have a single source, only one backend will be used at a time.
– For high volume of logs, configure OCI Security Lists/NSGs with Stateless entries (you will need rules for both inbound and outbound).
I hope this helps you.