Overview
Oracle Business Intelligence (OBIEE/OAS) and Oracle Business Intelligence Applications (OBIA) are mission-critical platforms that enable organizations to make data-driven decisions. These systems are complex and span multiple tiers — including databases, WebLogic servers, BI components, and ETL tools.
Without proactive monitoring, performance issues, component failures, and integration problems can go unnoticed until they impact end-users or critical reporting processes. By using Oracle Cloud Infrastructure (OCI)’s Observability and Management services you can create a unified view across all tiers of your BI platform, enabling your operations and support teams to collaborate effectively.
In the First Part we focused on setting up monitoring for OBIEE/OBIA environments using Stack Monitoring
This blog explains how to create a metric extension to collect Audit data of Users Accessing OBIEE/OBIA environments and extending Management Dashboards to include a widget with the collected metrics.
Metric Extensions in Stack Monitoring
Prerequisites
Please ensure the prerequisites for enabling stack monitoring have been completed – refer to the documentation in the References section and the First Part of this Blog Series.
- Weblogic Domain is discovered in Stack Monitoring
- Oracle Database System which includes the Container and Pluggable Databases related to OBIEE/OBIA are discovered in Stack Monitoring
- Update License for Database System to Enterprise Edition, this is required for deploying Metric Extensions feature
Create Metric Extension
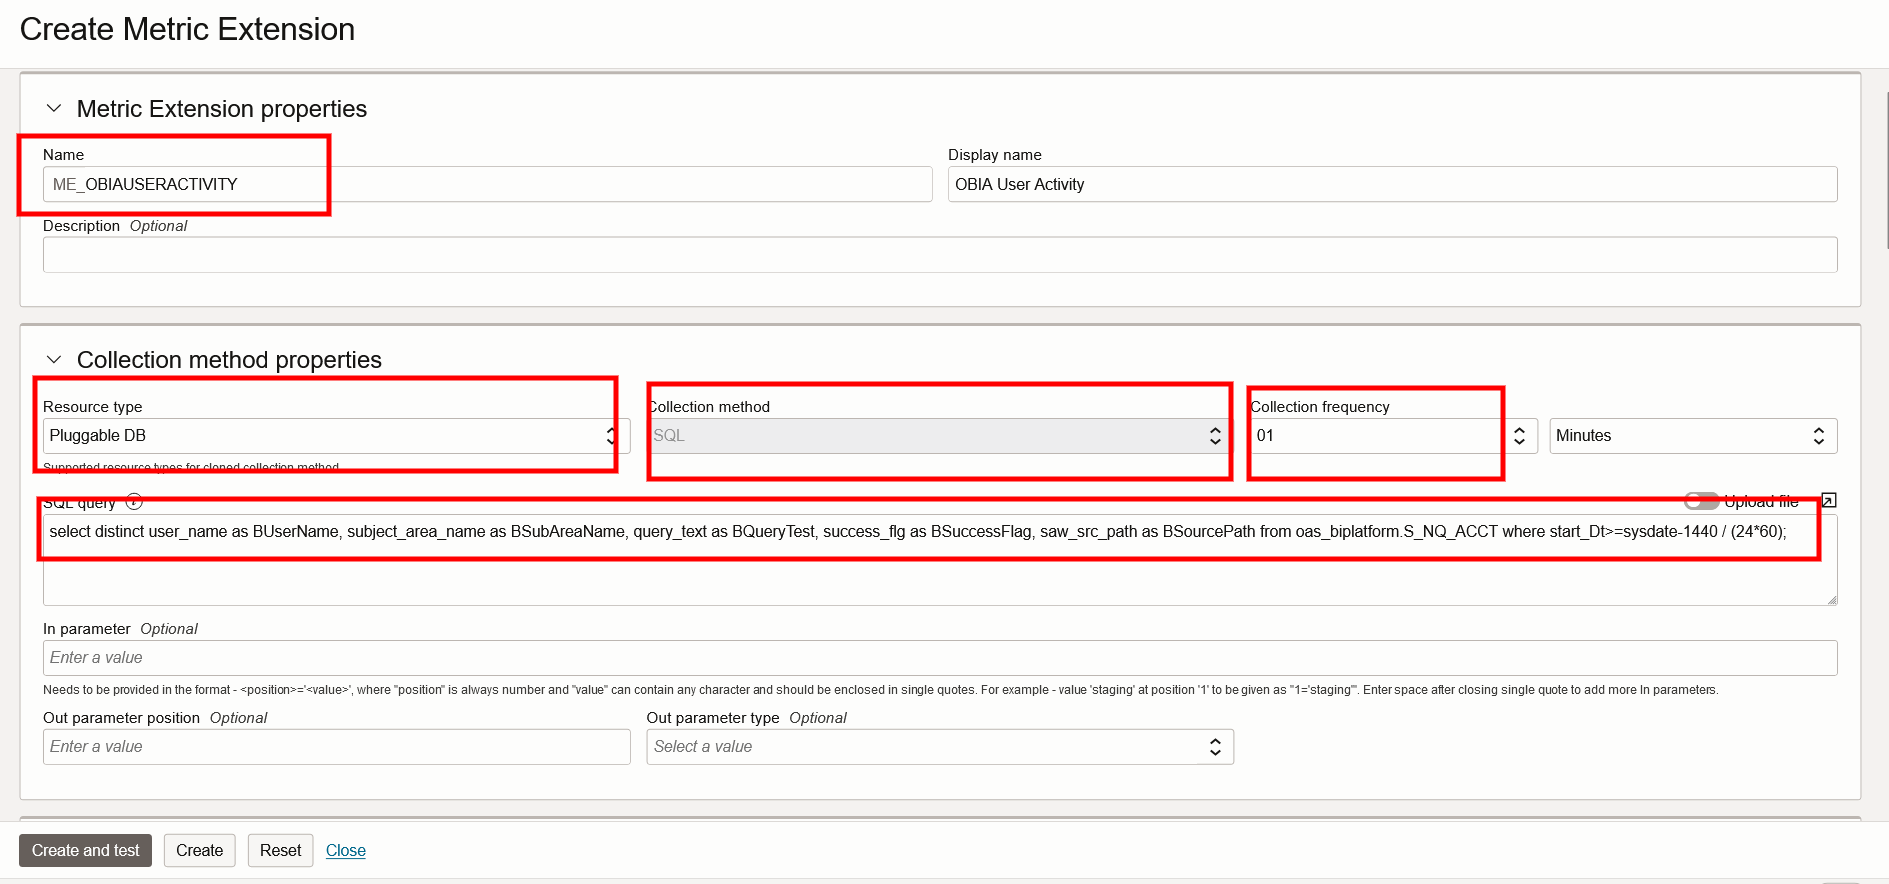
Step 1: Define Metric Extension Collection Properties
1. Log in to the OCI Console.
2. From the navigation menu, go to: Observability & Management → Stack Monitoring → Resources → Metric Extensions
Create a new metric extension
Name: Requires a ME_ prefix and cannot contain spaces or any special characters
Collection Method Properties
– Resource Type: This extension will be enabled on the Pluggable Database associated with the OBIEE Environment
– Collection Method: This will be defaulted to SQL
– Collection Frequency: Specify the duration in Minutes, this is how often you want to run the SQL query to collect the usage information
– SQL Query: Use the following query to collect the necessary User audit data from S_NQ_ACCT table. Please change the owner prefix as required. You can change the query depending on your requirements. Please make sure the start_Dt filter is changed to match the Collection Frequency indicated above. If there is an overlap, you might see duplication of Usage data. This query collects usage entries for the last 60 mins.
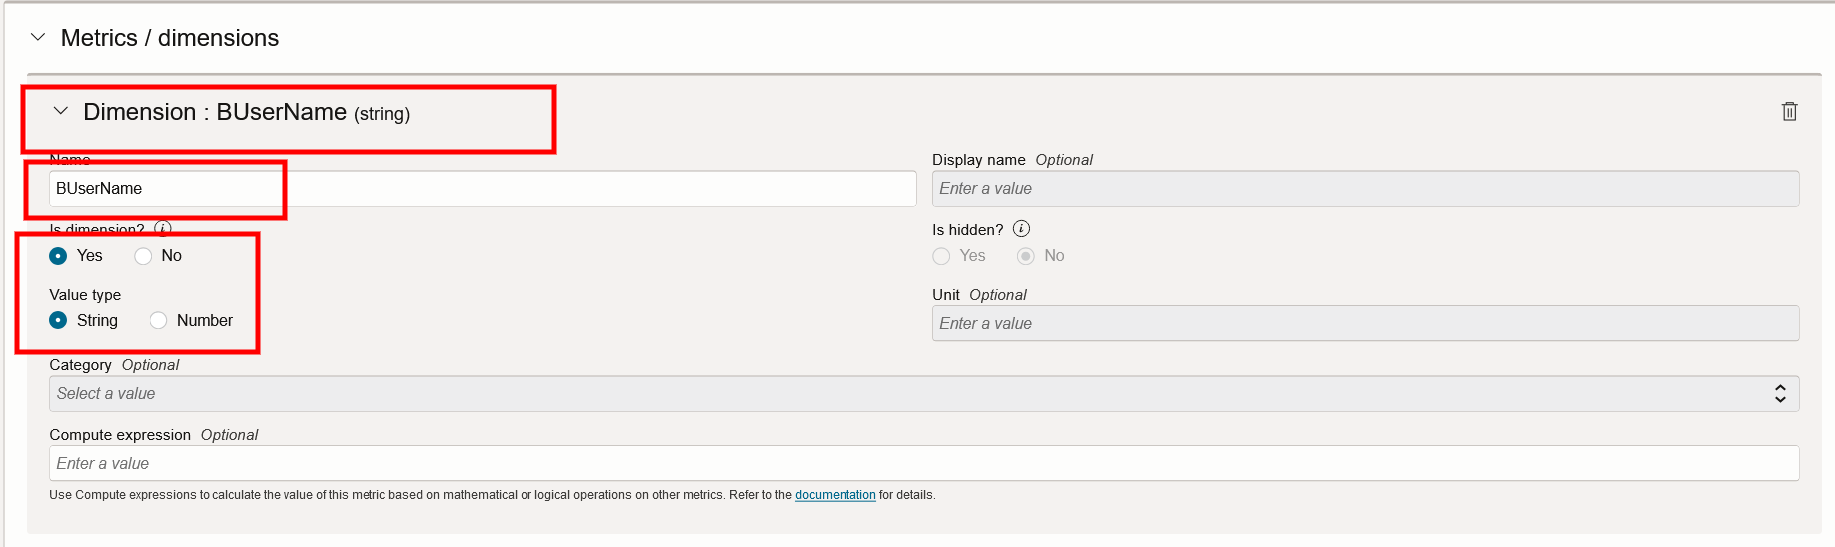
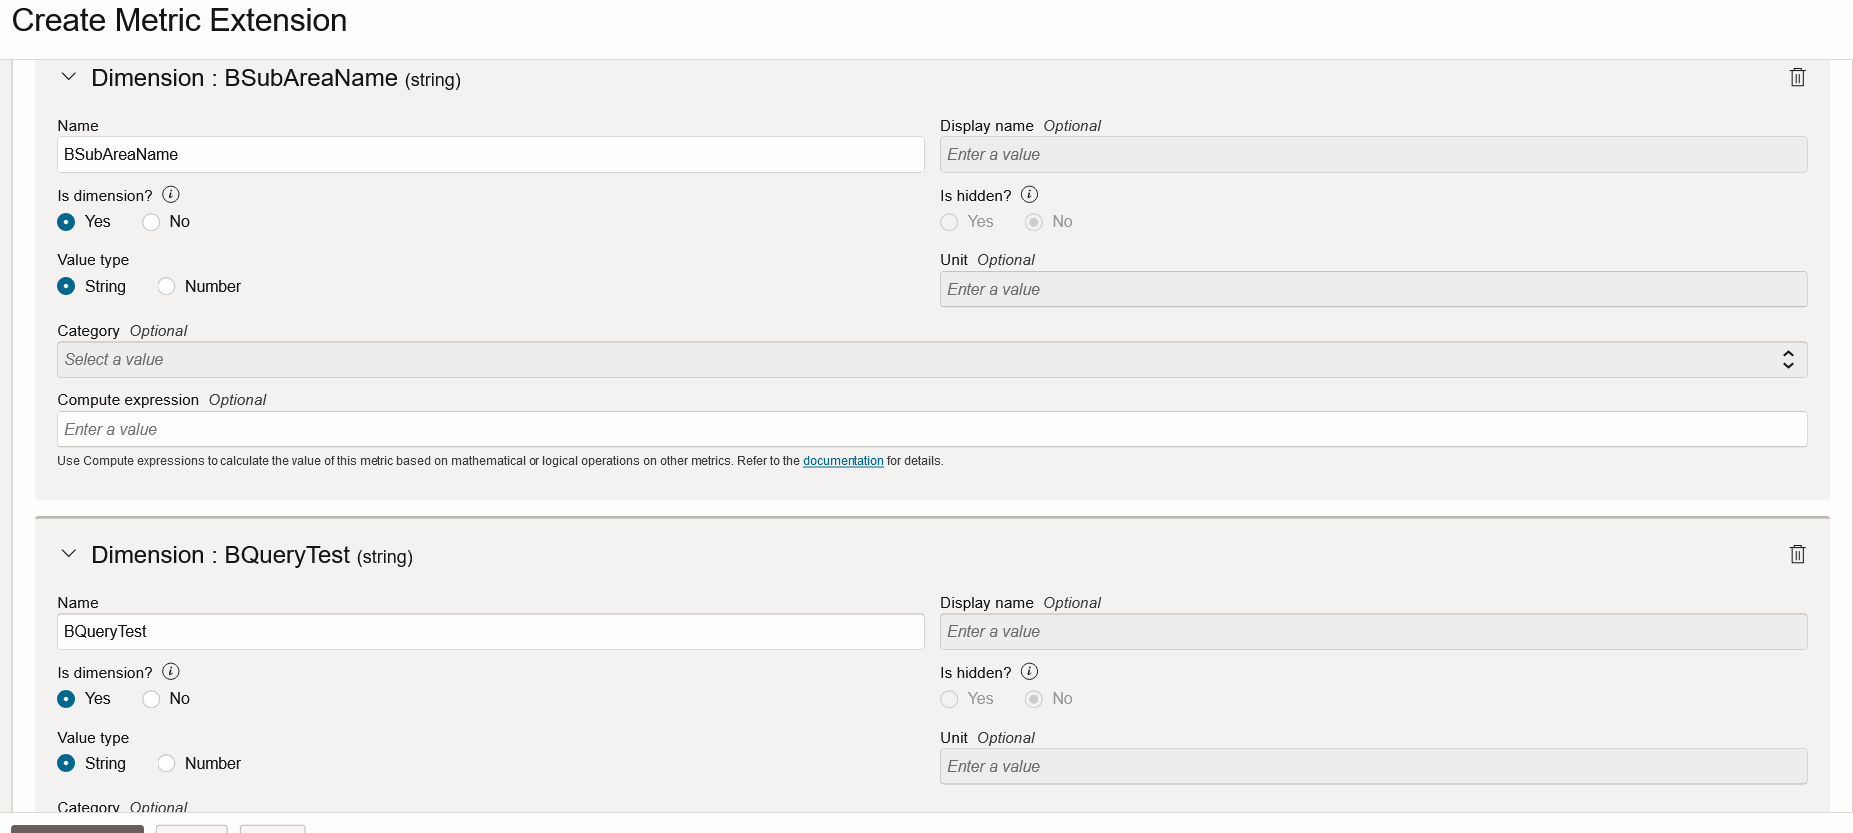
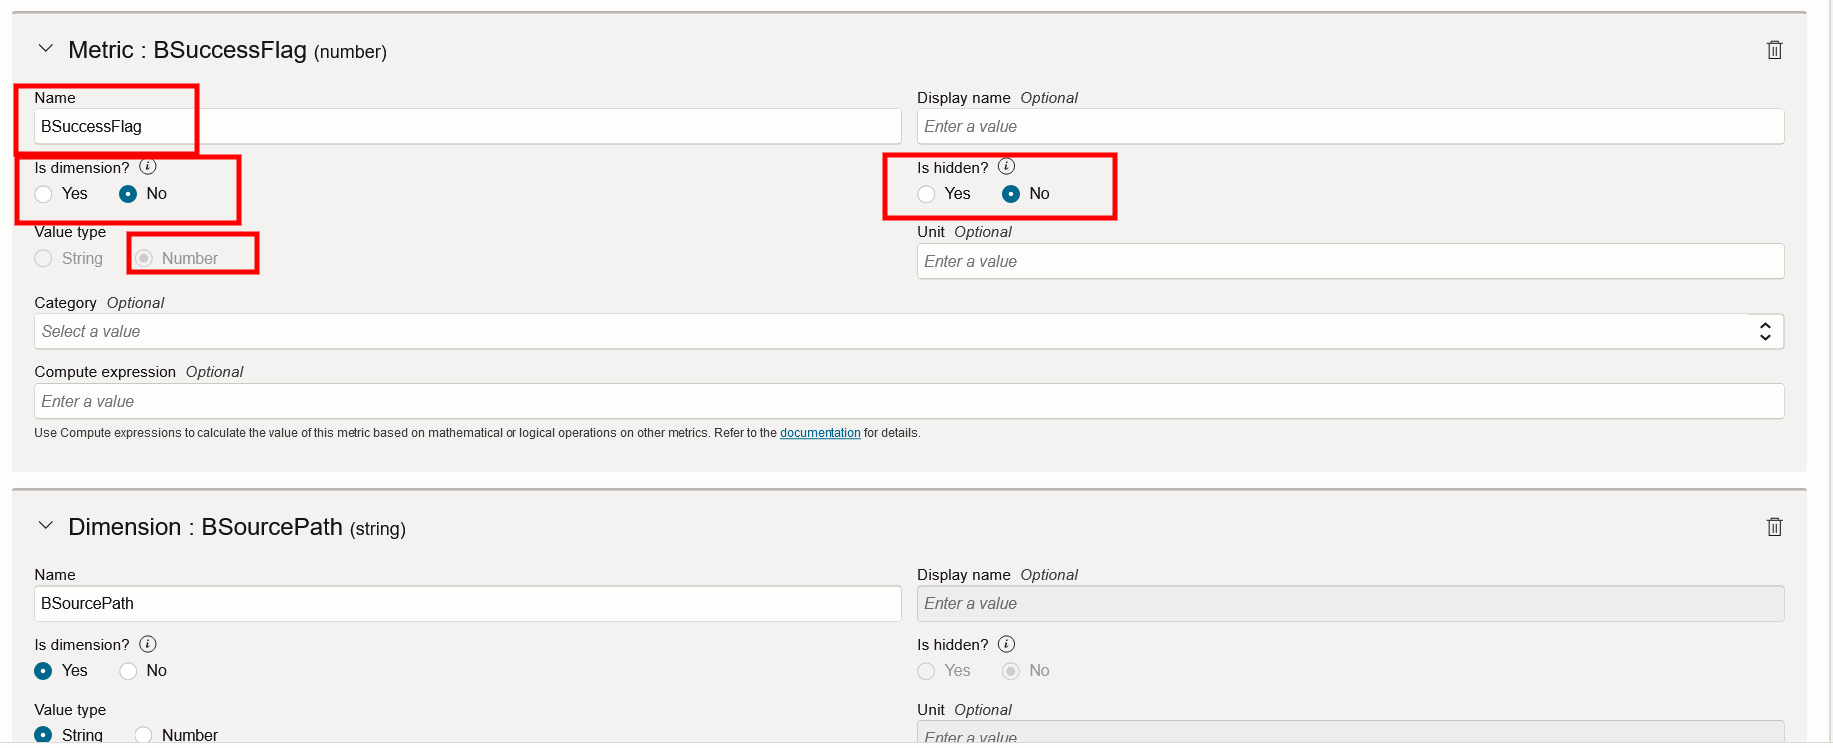
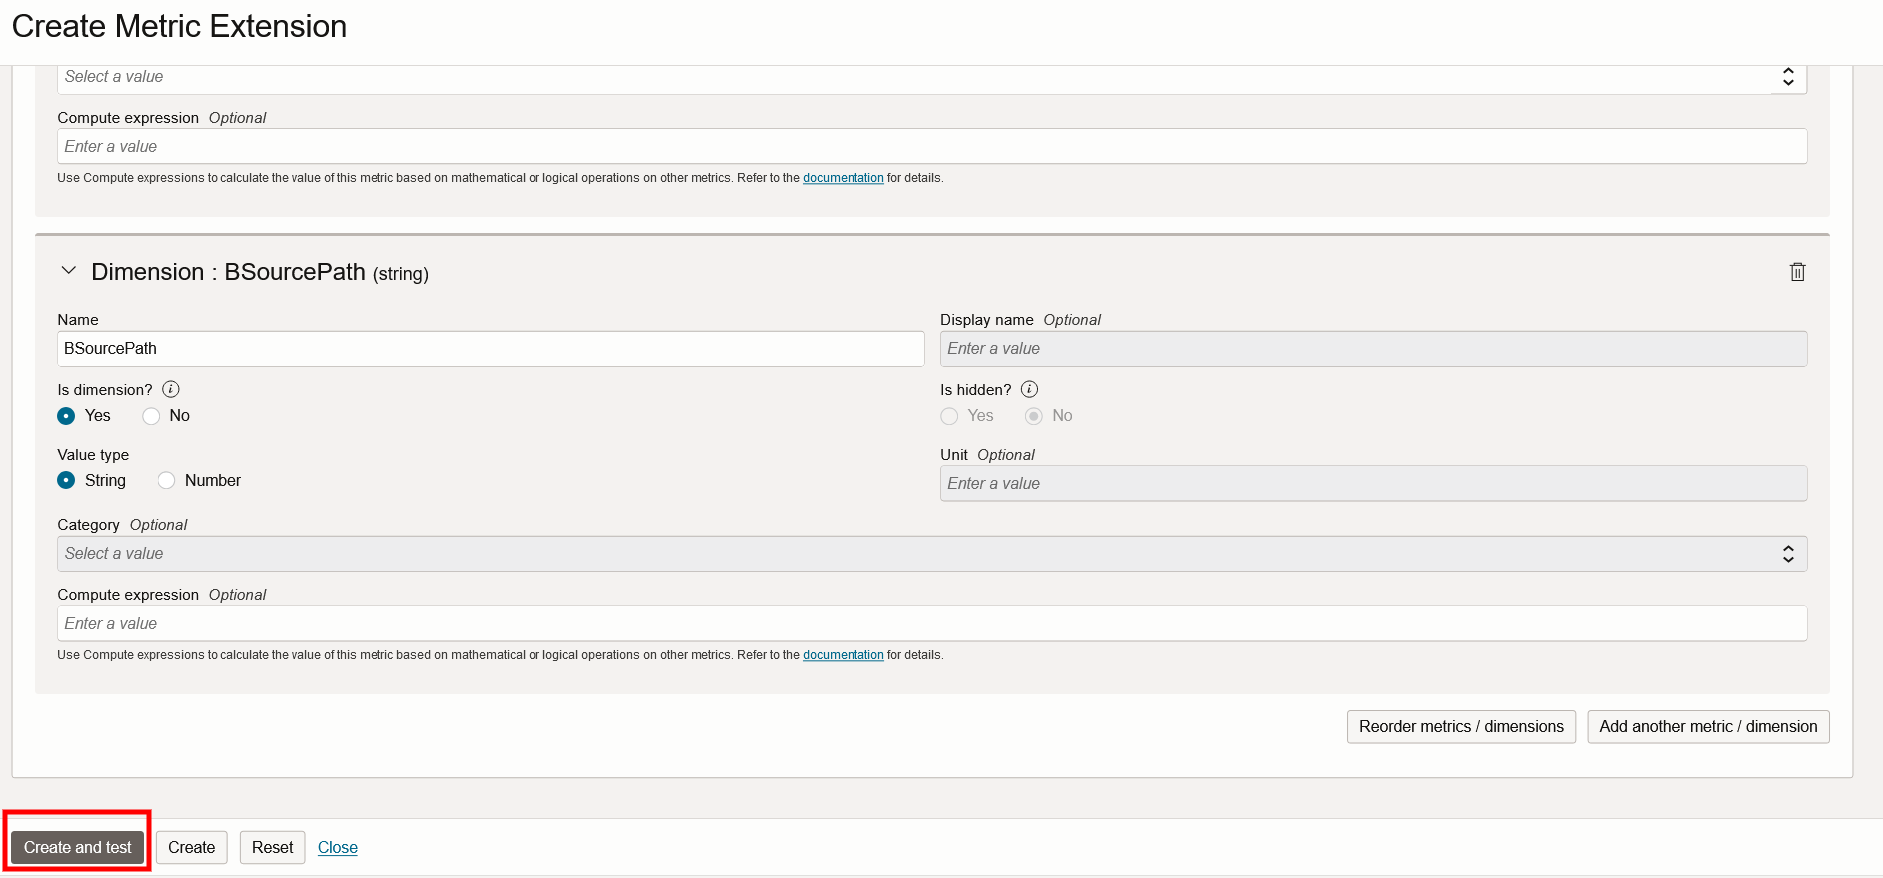
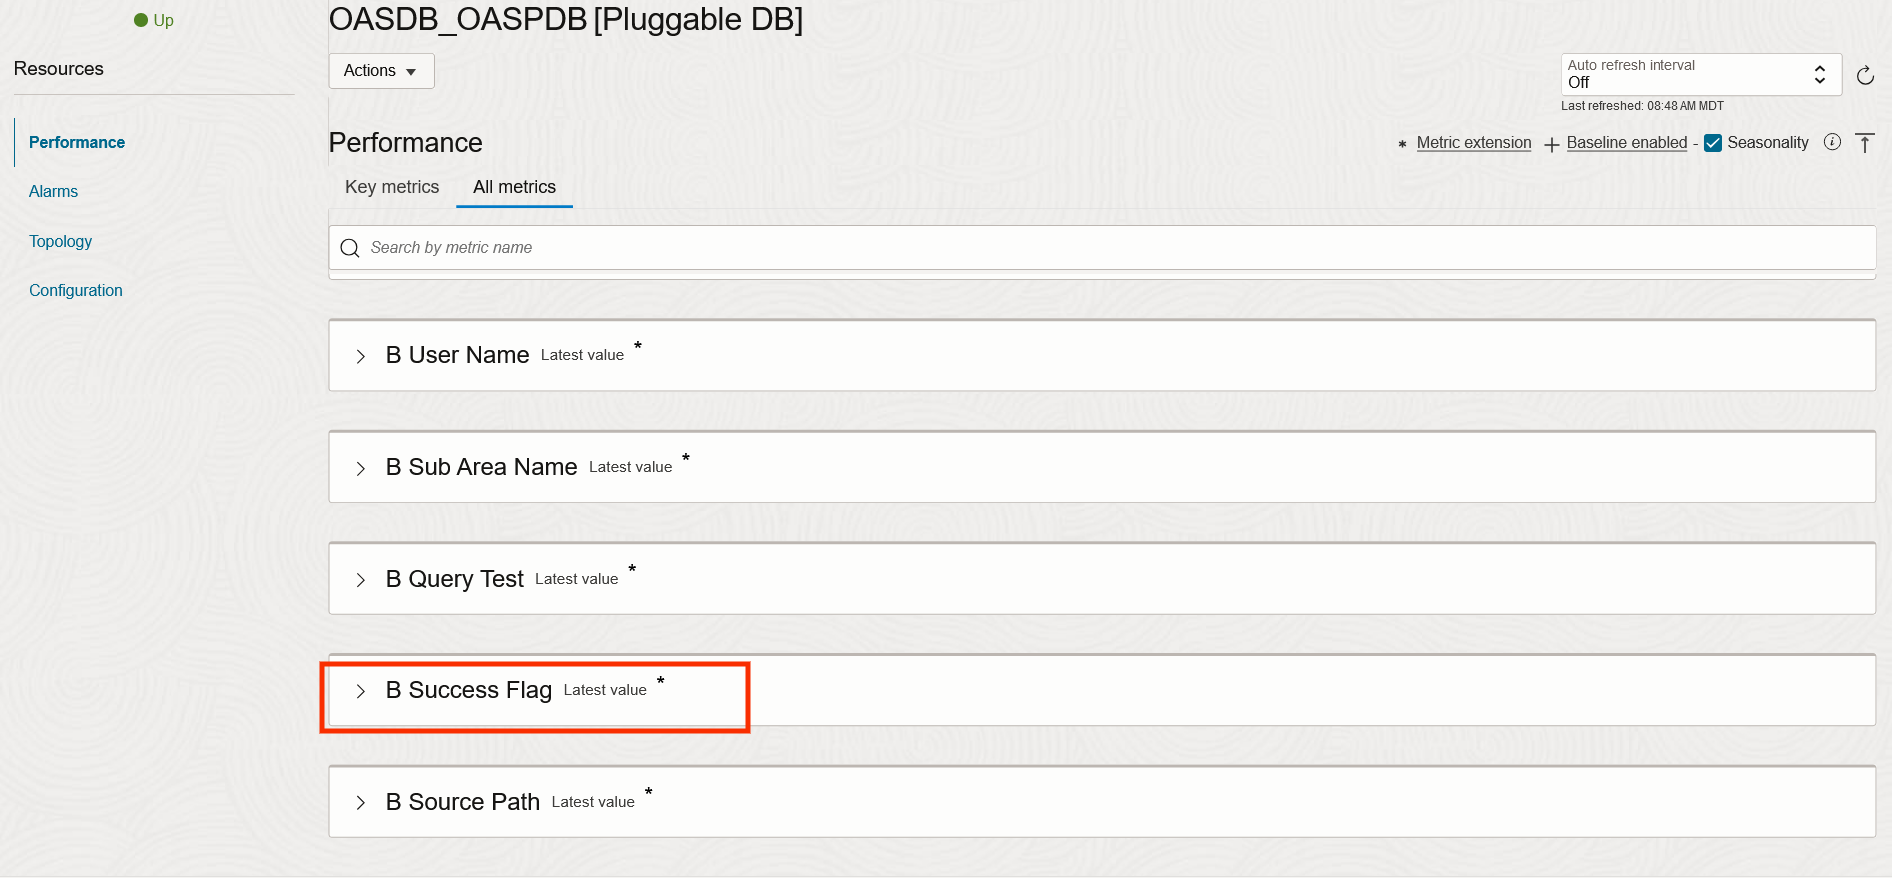
Step 2: Define Metric Extension Dimensions and Metrics
Now Start adding the Dimensions and Metrics to match the Data collected from the query.
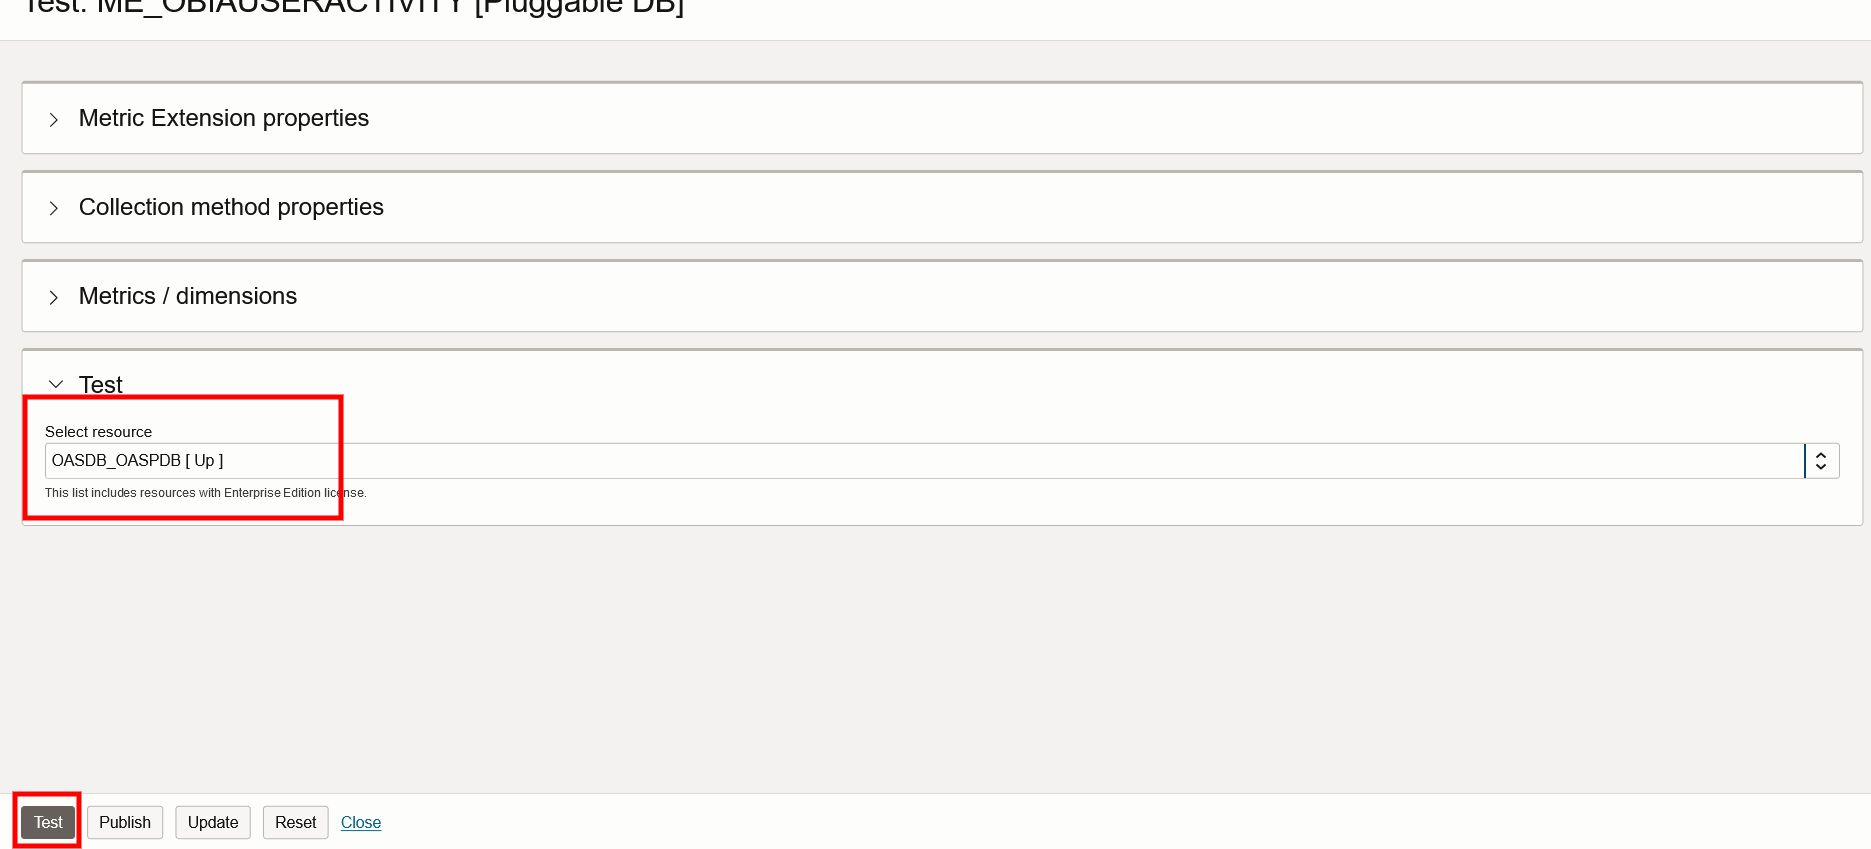
Step 3: Create and Test the Metric Extension
Once the Collection properties, Dimensions and Metrics are defined, Click on Create and test
Since we selected Pluggable Database as the Resource Type, any Pluggable Databases in the Current compartment will be displayed.
Select the database associated with the OBIEE environment.
Click on Test
Note: If the OBIEE database is not displayed, ensure the related Database System was assigned Enterprise Edition in Licensing.
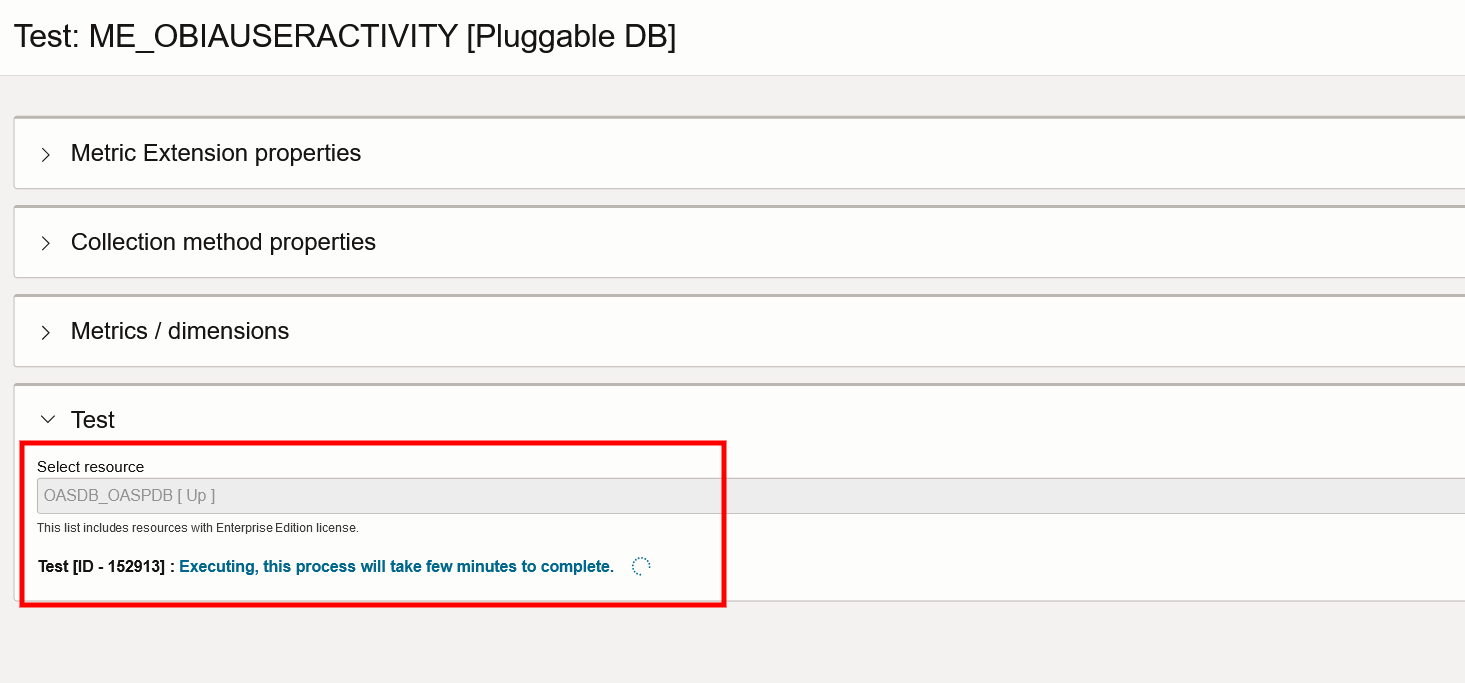
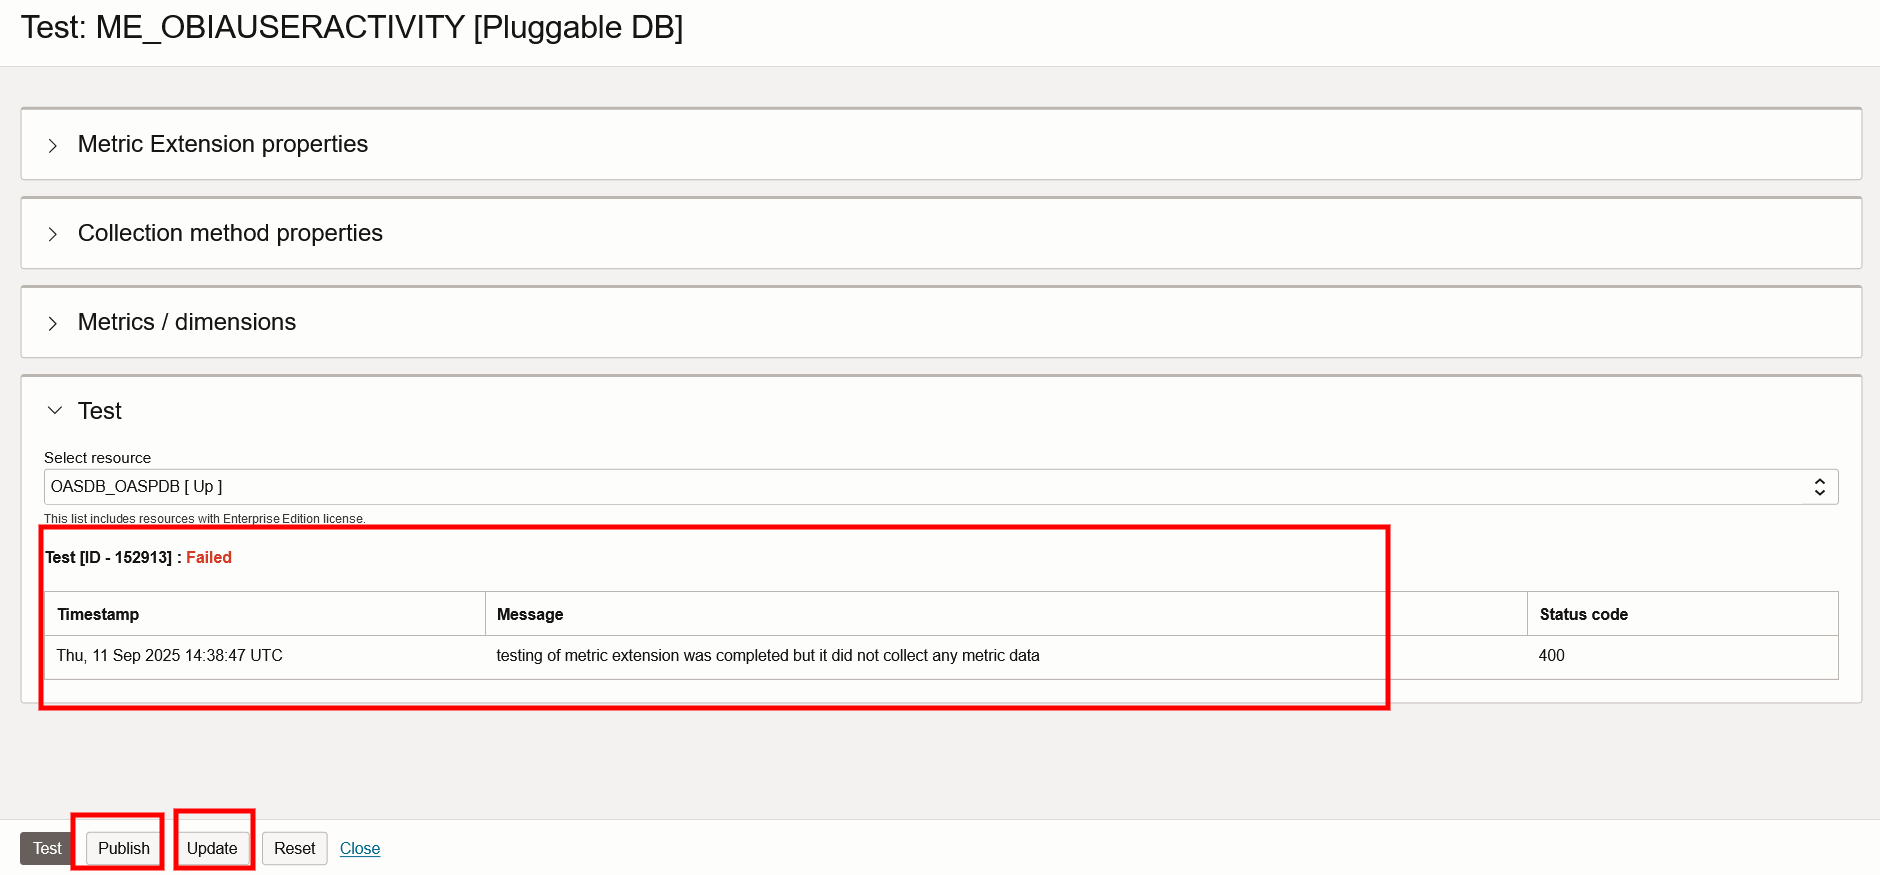
Step 4: Ensure Metric Extension test completes Successfully
Once the Test button is Clicked, Stack Monitoring Service will send the Metric Extension definition to the Management Agent that is associated to the selected Database. The definition is deployed and the Agent is restarted. The SQL query provided in the Extension definition is sent to the Database and returned results are transmitted to the OCI Console.
Any Errors should be fixed before the Extension can be published. Some of the key requirements for Successful completion are:
- There should be at least one data row returned by the query – this can be overridden and the Extension Published if you are sure the query will work when there is data that matches the query and all the requirements below will be met.
- All Metric Columns should return numeric values and cannot be NULL – if required, add a NVL clause to the query to replace NULL values with 0 or another valid value.
- Each row returned should be unique as a combination of all Columns – if required, add a DISTINCT clause to the query to eliminate this error.
Repeat the update/test iterations until all issues are fixed.
Step 5: Publish and Enable Metric Extension
Once the Test returns successfully, Click on Publish. Note that once an Extension is Published the definition cannot be modified. You can still clone this extension and make changes in the cloned extension.
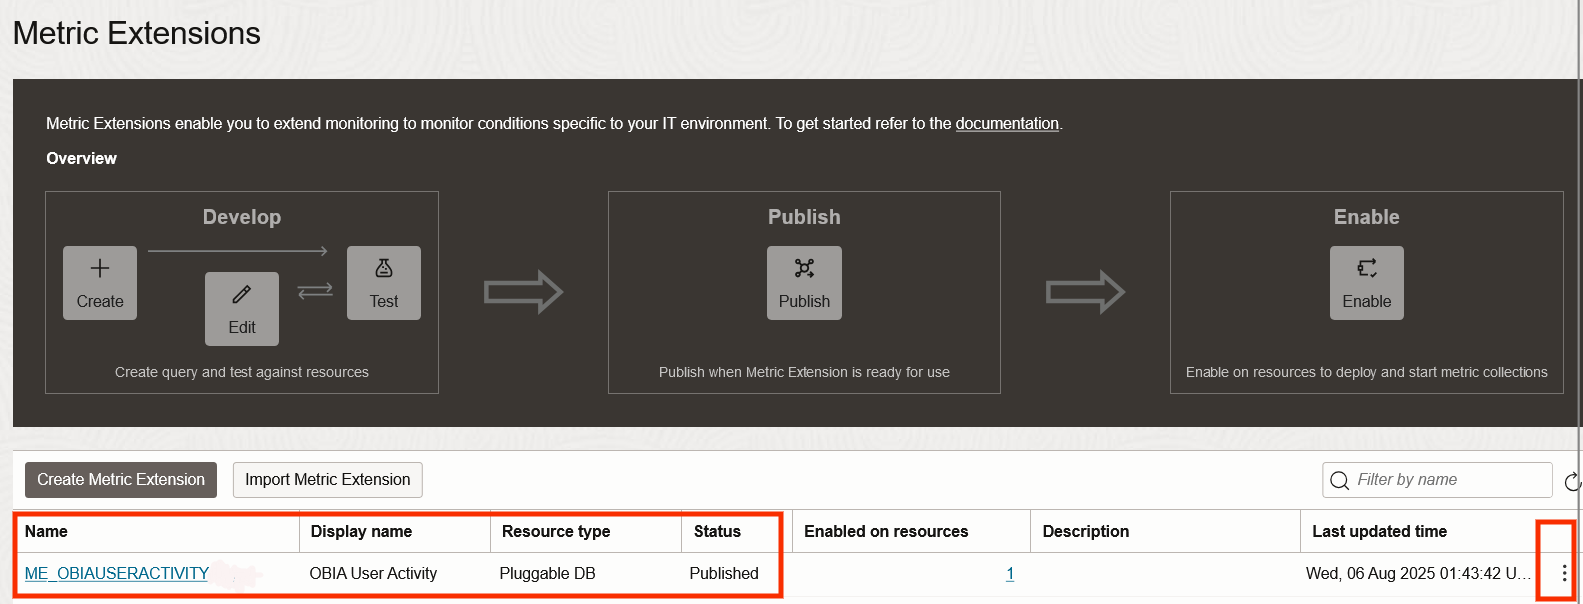
Enable the Extension by clicking on the 3 dots menu on the right of the row and select Enable
Select the database resource this Extension should be enabled on.
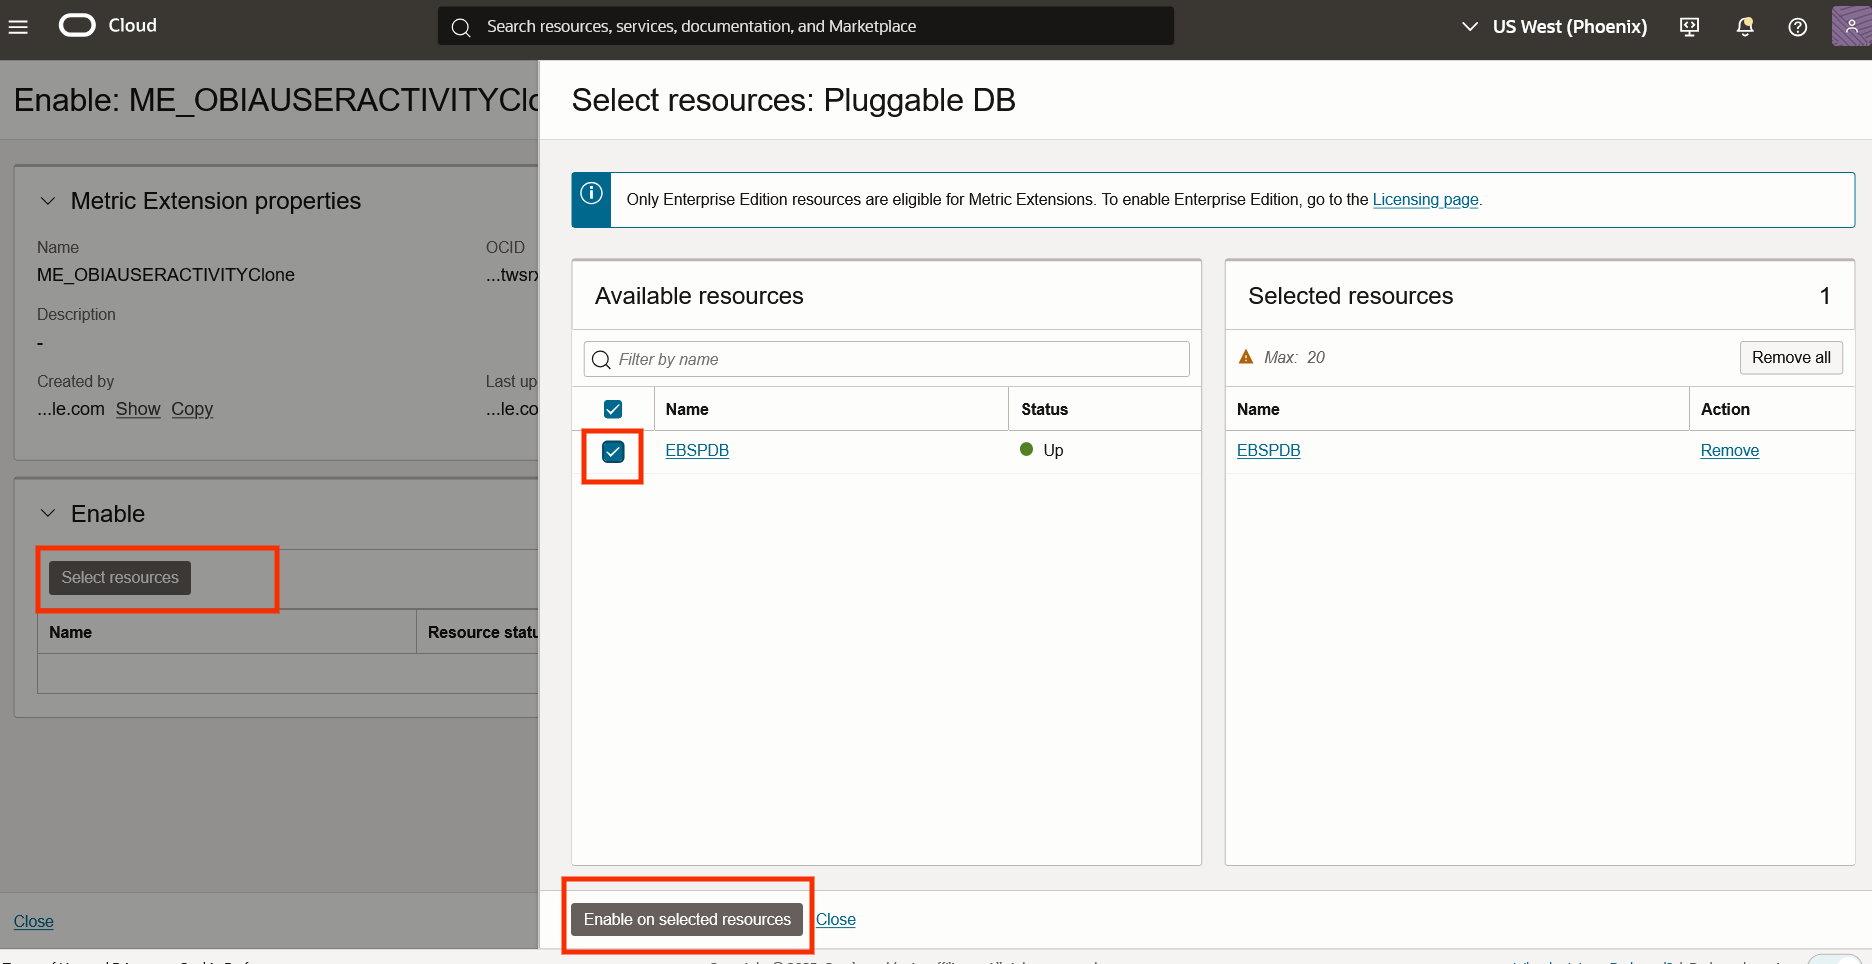
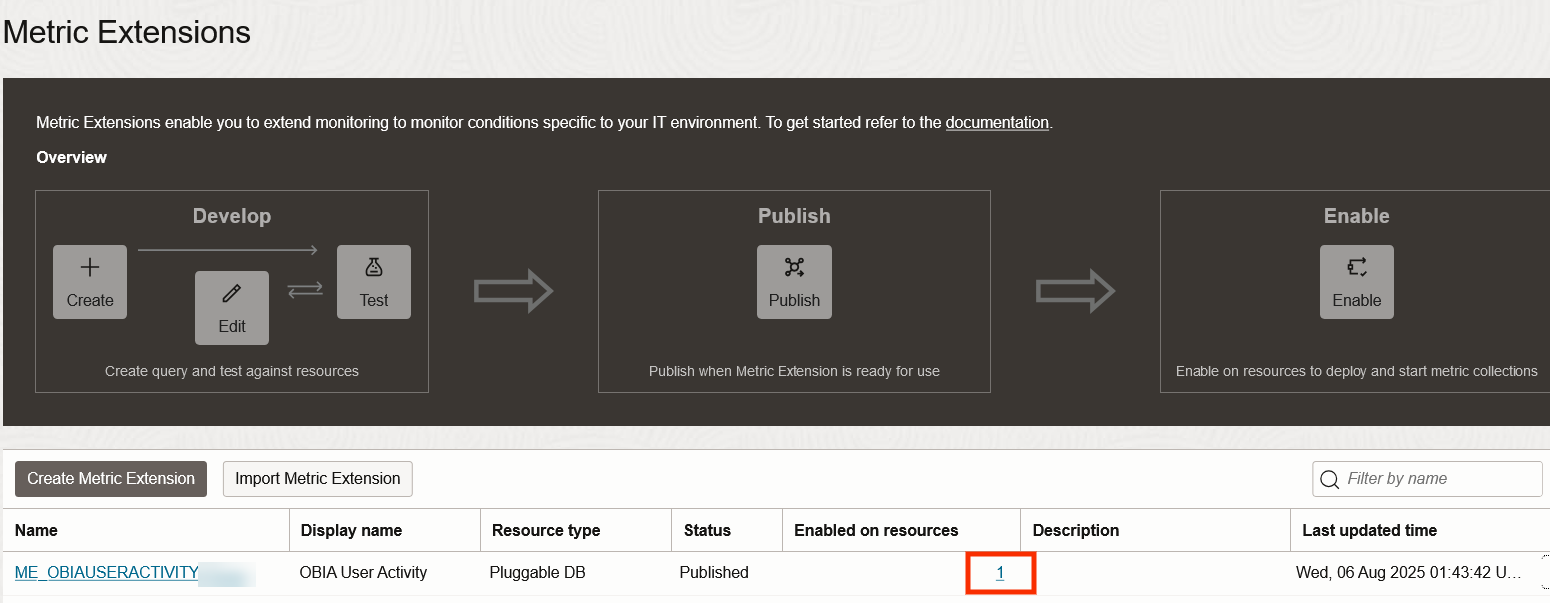
The Extension will now show that it is enabled on the selected resources and in a few minutes the metrics should start getting collected in OCI Monitoring.
.
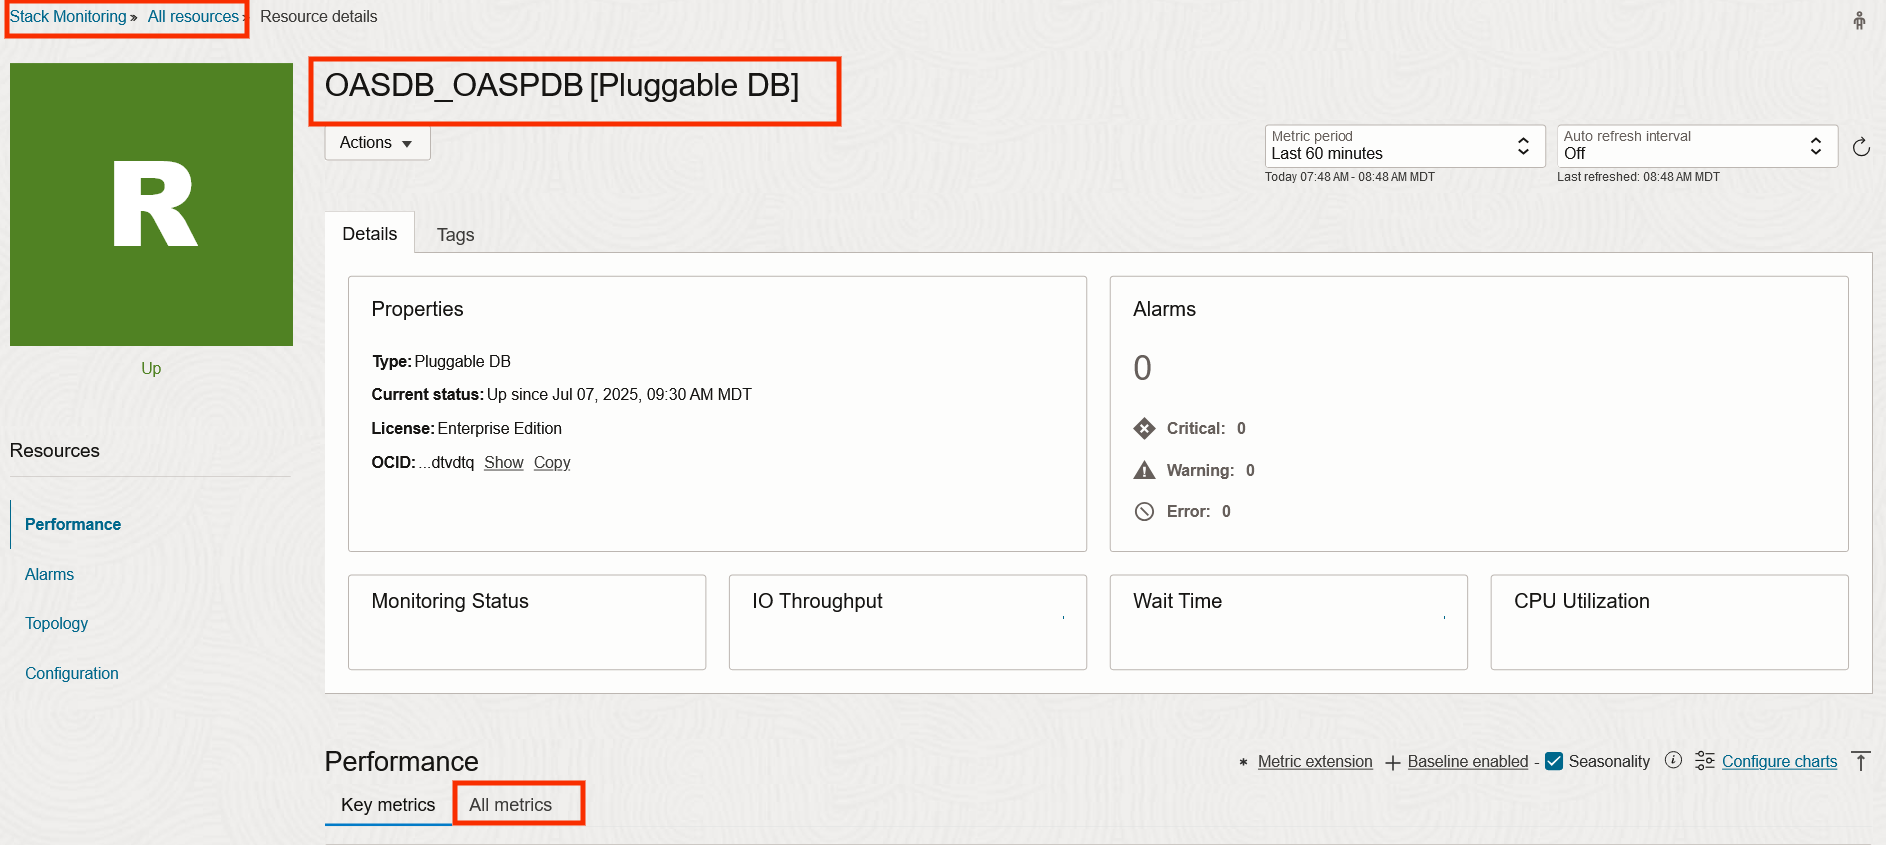
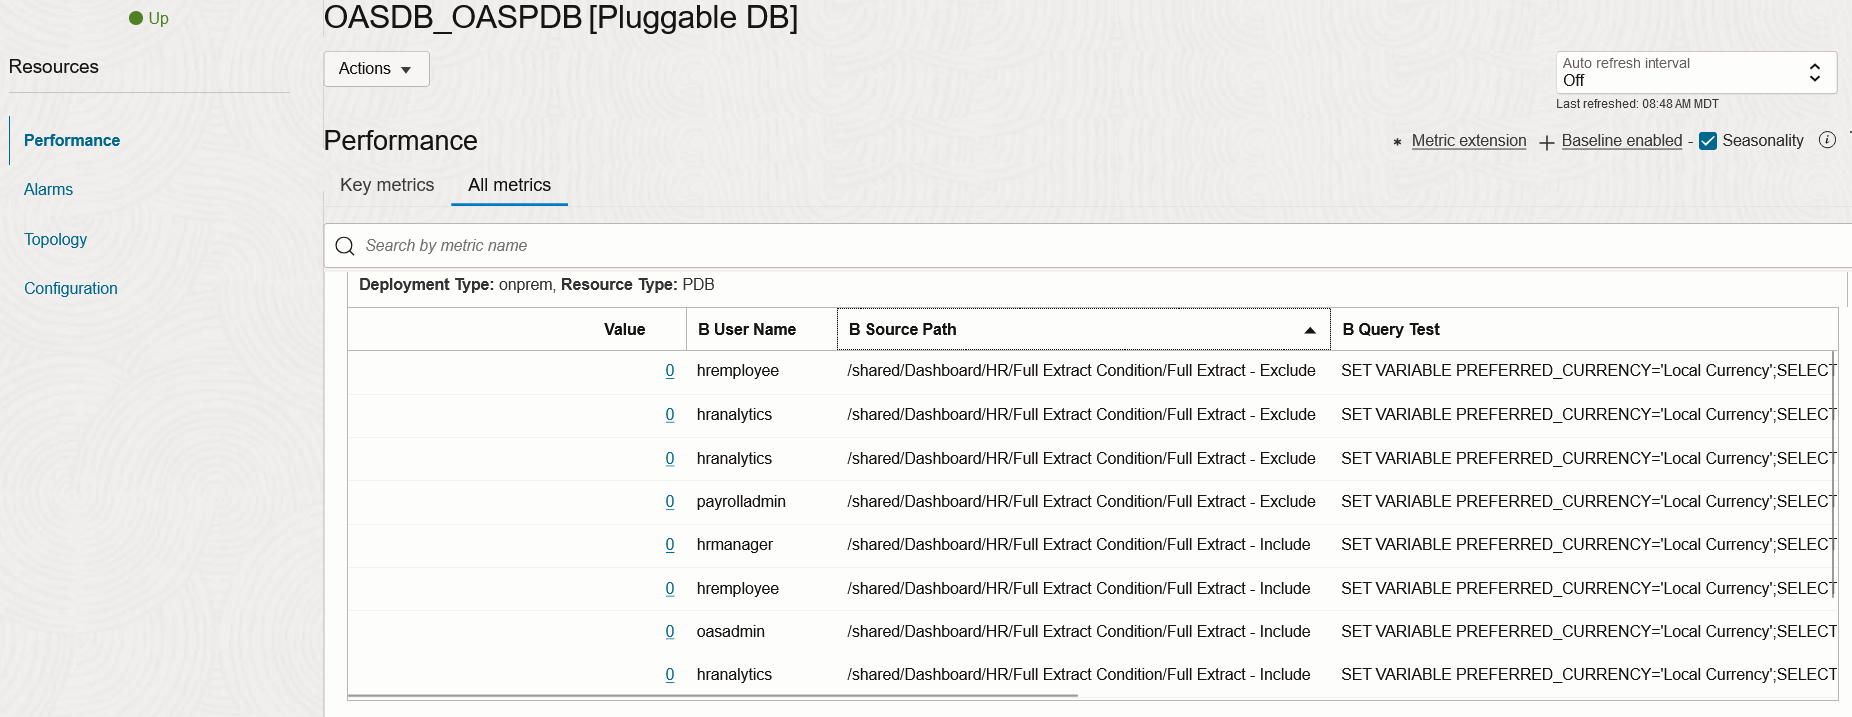
Step 6: View Custom Metrics
Within a few minutes, the pluggable database resource should start showing the new custom metrics that are being collected.
These metrics will also appear in OCI Metrics Explorer under oracle_metrics_extensions_appmgmt namespace.
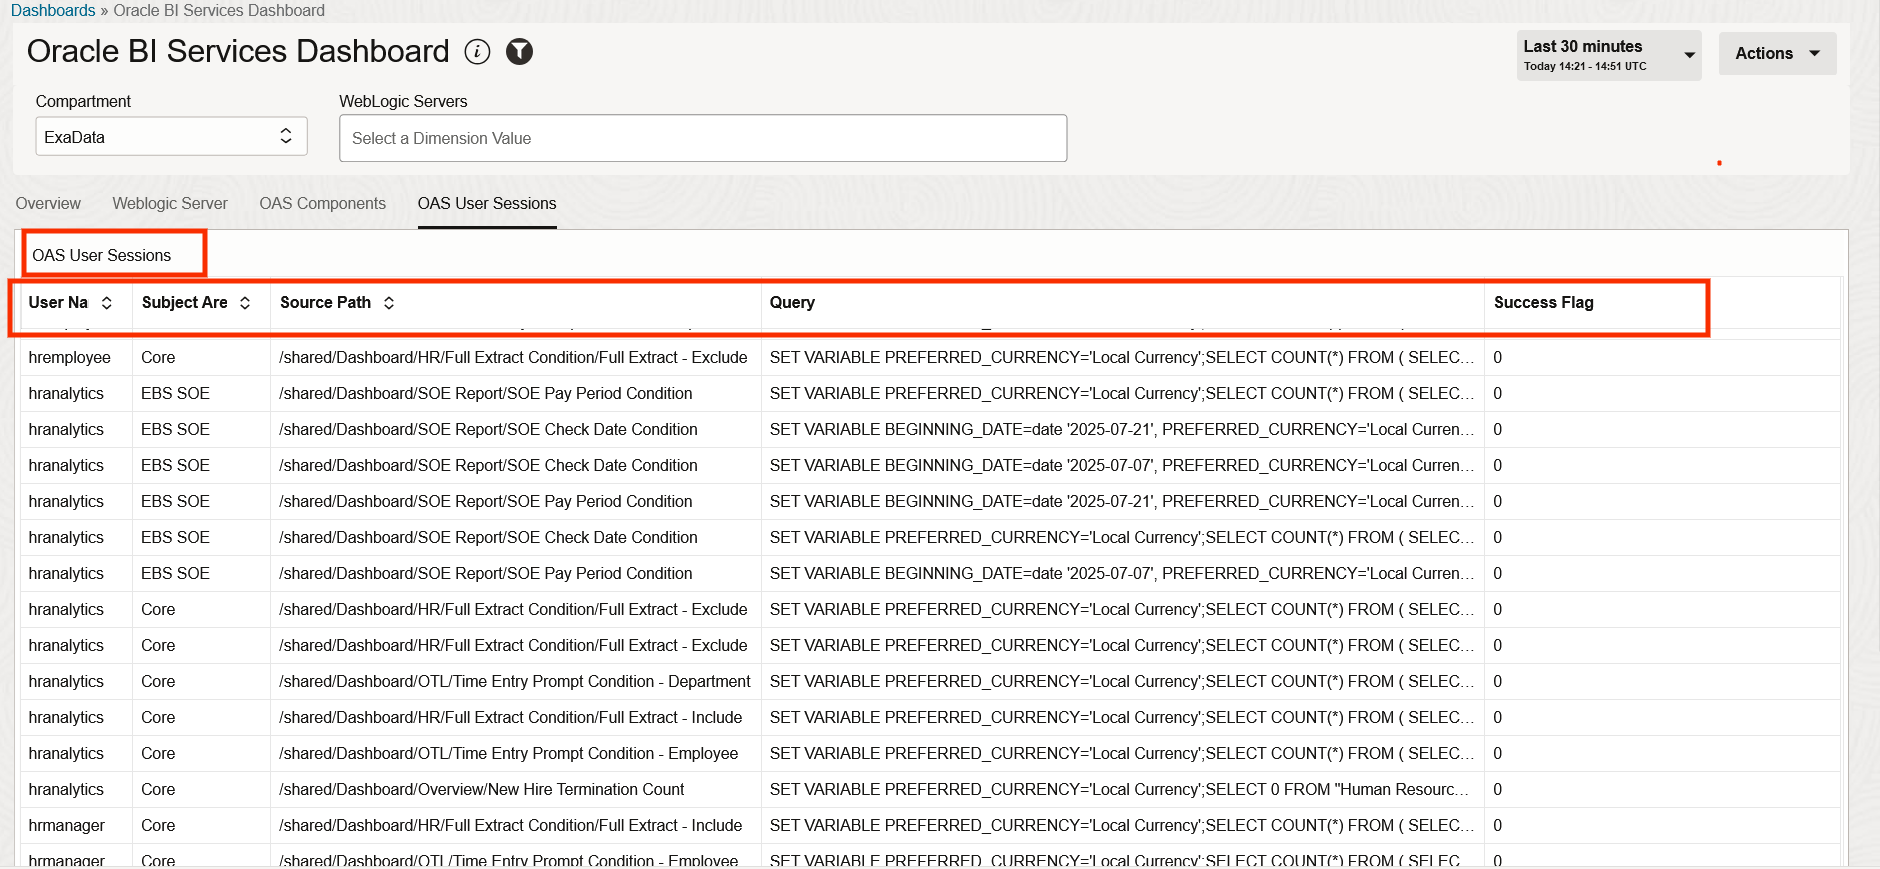
Step 7: Add Custom table widget to display the Usage Data in Health Dashboard
You can create a dashboard from scratch or duplicate a seeded dashboard and modify to add new widgets.
Here is a dashboard that has been created to include all the components of the OBIEE/OBIA Stack in multiple tabs.
Summary
Monitoring the OBIEE/OBIA application stack using Oracle Cloud Infrastructure (OCI) Stack Monitoring is essential for maintaining high availability, performance, and reliability in enterprise analytics environments.
In this blog, you learned to:
- Create Metric Extension in Stack Monitoring to collect OBIEE Usage Data
- Create a Custom Dashboard for OBIEE/OBIA
By integrating all components into a single observability layer, you gain a full-stack view of your BI platform, reduce downtime, and improve troubleshooting efficiency. Whether you are supporting OBIEE/OBIA or ETL pipelines, you can use the features provided by Stack Monitoring for a proactive approach to system management.
Note: A reminder that Oracle observability and Management services can be used to monitor applications running in other Clouds as well as On-Prem.
Resources and References
- Stack Monitoring – Discover WebLogic Domains
- Stack Monitoring – Discover Oracle Databases
- Stack Monitoring – Expand Monitoring Capability with Metric Extensions
- Stack Monitoring – Monitor the Status and Performance of Your Enterprise
- Monitor Oracle Business Intelligence Applications with Oracle Stack Monitoring – Part 1