Introduction
In this blog series we are going to discuss Oracle Cloud Infrastructure (OCI) networking best practices and provide you with some recommendations and tips to help you design, build, secure and manage your OCI network infrastructure. This is the fourth blog in this series and will cover OCI network monitoring, observability, and management best practices. The topics for this blog series are outlined below:
- Part One – OCI Network Design, VCN, and Subnets Best Practices, Recommendations, and Tips
- Part Two – OCI Network Security Best Practices, Recommendations, and Tips
- Part Three – OCI Network Connectivity Best Practices, Recommendations, and Tips
- Part Four – OCI Network Monitoring, Observability, and Management Best Practices, Recommendations, and Tips
- This blog series has also been adapted and published as a Solution Playbook in the Oracle Architecture Center
Understand and Utilize OCI Network Command Center Tools
Rationale
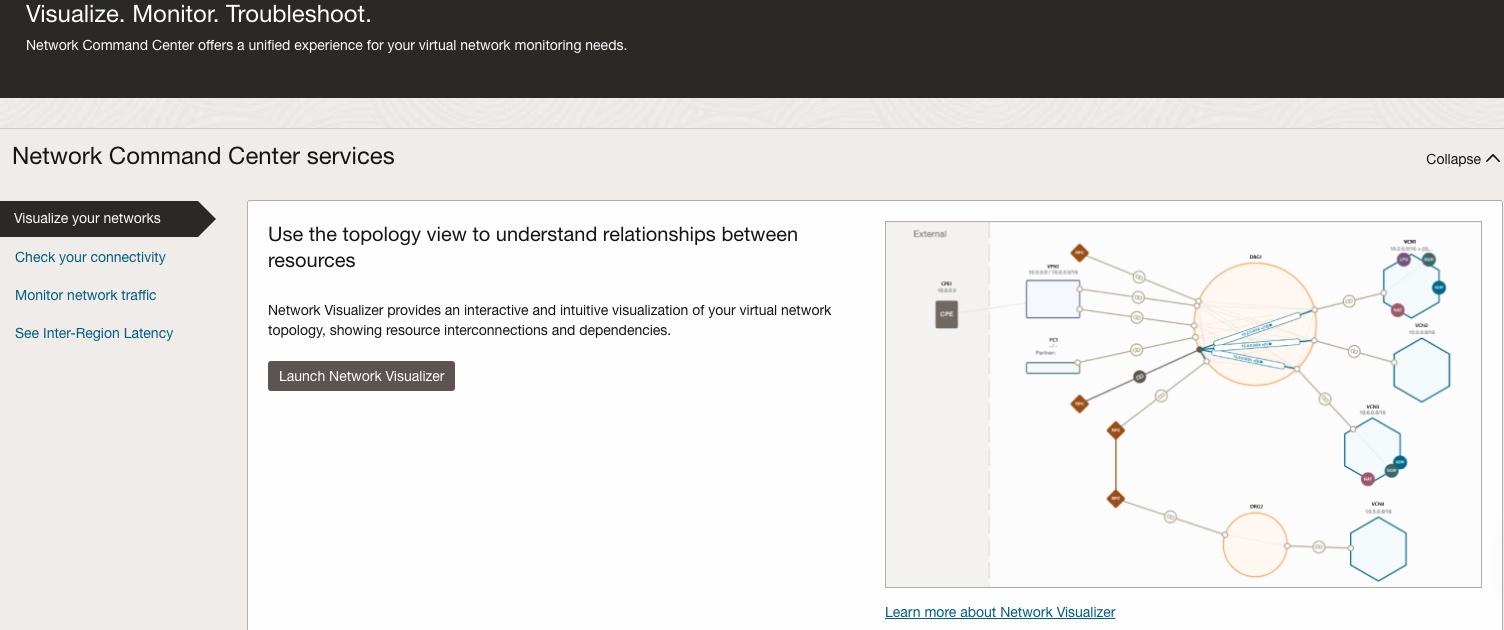
The OCI Network Command Center brings all of OCI’s native network observability tools together in one place for easier access and a unified user experience. Customers should be familiar with all of the OCI tools in the Network Command Center and how they can utilize them to simplify your operations and reduce the time to identify issues.
OCI Network Command Center offers the following observability tools to support various operations use cases:
-
Network Visualizer offers intuitive topology visualization to understand connections and relationships between your virtual network resources, inspect the configuration from one place, and visually troubleshoot any configuration issues.
-
Network Path Analyzer allows you to troubleshoot complex virtual network configurations when you have reachability problems. Network Path Analyzer provides automated configuration analysis to determine the network path the traffic takes, identify routing and security configuration issues, and provide the configuration information along the path.
-
Inter-Region Latency provides real-time and historical latency information between two OCI regions.
-
VCN Flow Logs offer network traffic telemetry critical to support your security and network operations use cases. With VCN flow logs, you can gain extensive insights on the network traffic, stream the flow logs to your chosen tool using standard protocols such as Kafka, and archive the flow logs in OCI Object Storage for compliance purposes.
-
Virtual Test Access Point (VTAP) offers traffic mirroring capabilities that enable full packet capture for security analysis, troubleshooting applications, or network performance issues. VTAP is also useful for troubleshooting complex network problems by analyzing the packet headers.
Recommendation
- Read through our documentation, blogs, and videos to become familiar with each of the Network Command Center tools capabilities and limitations
- Spend some time and play around with the Network Visualizer, Network Path Analyzer, Inter-Region Latency, and VCN Flow Logs as they are non-intrusive tools
- For VTAP, read the below blog links and videos for better understanding of how to utilize that tool and try it out in your environment
Tip: Pin the Network Command Center and relevant tools to your OCI Console Home page for quick and easy access
Tip: More tools and capabilities are coming from OCI and will be integrated into the Network Command Center so stay up to date. Below are a couple of links you can keep an eye on for new network features from OCI:
Setup Notifications to be Alerted When Key Network Changes are Made
Rationale
The OCI Audit service automatically records calls to all supported OCI public Application Programming Interface (API) endpoints and logs them to the Audit Log. This includes all API calls made by the OCI console, Command Line Interface (CLI), Software Development Kits (SDK), other OCI services. As a result, anytime a change is made to your OCI environment or resources it will show up in the Audit Log. Customers can utilize the OCI Events and Notifications service to be proactively alerted when a change is made to a critical or key network component.
Examples of some key or critical OCI network components that you may want to setup notifications on are, but many more are available in the Events service.
- Security List or Network Security Groups
- Dynamic Routing Gateway (DRG)
- Network Firewall
- Route Table
- Virtual Cloud Network (VCN) or Subnet
Notifications can be setup anytime these resources are created, deleted, or updated
Recommendation
- Identify the key and critical network resources that you want to be proactively notified when changes are made. Perhaps a specific security list applied to a particular public subnet is important and you want to know when someone adds, updates, or deletes a rule in that security list. Another example could be identifying network components in a production compartment to be notified on.
- Check out the below links for further information on how to configure these notifications:
Setup Alarms and Notifications to be Alerted When Key Network Metric Thresholds are Breached
Rationale
The OCI Monitoring service uses metrics to monitor resources and alarms to notify you when these metrics meet alarm-specificed triggers. Customers can create an alarm on any of these metrics that are being measured and collected in OCI. By combining these metrics and alarms with the OCI notification service, this allows customers to be notified when one of these thresholds on a specific metric is triggered.
Below are some examples of notifications customers can receive but there are many more:
- When the state of a FastConnect or Site-to-Site Virtual Private Network (VPN) goes from up to down
- When FastConnect or Site-to-Site VPN traffic goes above or below a set threshold
- When the Border Gateway Protocol (BGP) state on FastConnect or Site-to-Site VPN goes from up to down
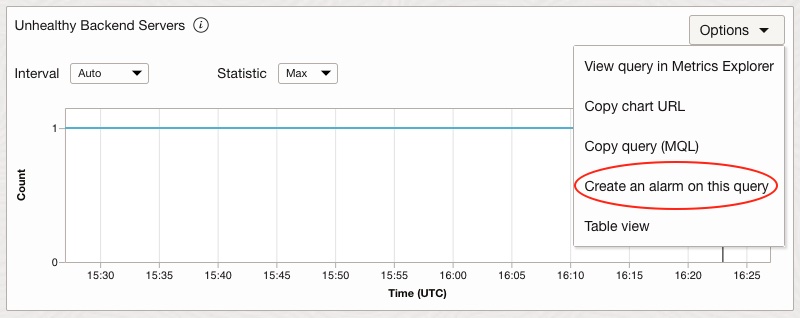
- When the number of unhealthy backends in a Flexible Load Balancer backend set hits a set threshold
Recommendation
- Identify the key and critical metrics and associated thresholds that you want to be notified on
- Read through and familiarize yourself with the OCI documentation for the relevant OCI services
Tip: You can create an alarm on any metric that you see inside the OCI console. On the metric graph, just click the options drop down on the top right corner and select “Create an alarm on this query”