
Interactive SSH activity is often where an investigation begins: an unexpected source address, a privileged command, or an unfamiliar user on a sensitive host. Conventional system, SSH, and audit logs establish that an event occurred, but they do not always show the terminal interaction that led to it.
This article describes a practical pattern for recording interactive Linux terminal sessions with tlog, centralising the resulting session events with OCI Logging and Logging Analytics, and optionally replaying selected recordings. The result is a searchable workflow that connects SSH access, privilege use, terminal I/O, and session replay.
What does this solution provide?
- Central visibility of successful and failed SSH activity, executed privileged commands
- Investigation dashboards that pivot by host/user/time/source IP address and a replay service for reviewing the recordings
- An enrollment pattern for new and existing Oracle Linux hosts
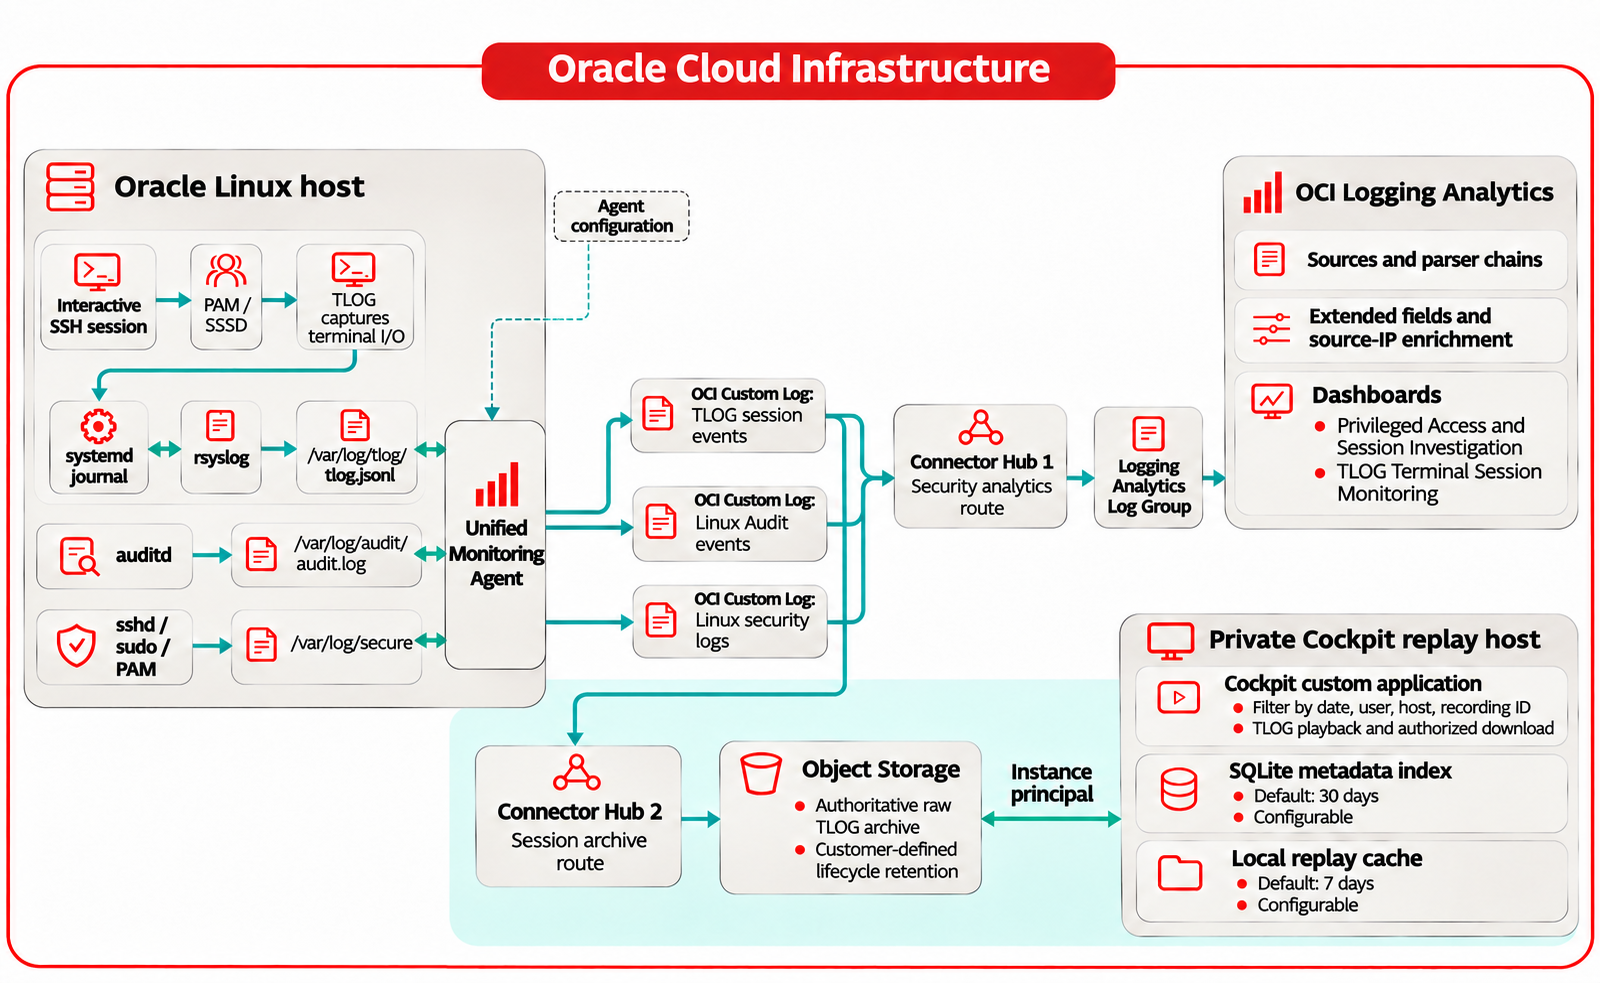
The design has three layers:
- Recorded hosts capture interactive terminal activity locally with TLOG.
- OCI observability services ingest and correlate TLOG, SSH/security, and audit logs.
- The replay-host retains a local cache and also retrieves historical recordings on demand. This layer (in green) is optional.
TLOG JSON events provide the bridge between the layers. Each event includes useful context such as the recording ID, user, host, terminal session ID, event sequence, event time, input, and output. Those fields make a terminal recording searchable alongside the system events that explain how a user reached the host and what privilege changes occurred.
Before you begin
This pattern records terminal input and output. That may include commands, output containing sensitive information, and secrets typed at a prompt. Treat session recordings as sensitive security evidence. At minimum, the implementation requires:
- OCI permissions to manage Compute instances, Logging, Log Analytics, OCI IAM, Object Storage, and Service Connector Hubs as applicable
- Oracle Linux hosts and approved root-level access for enrollment
- Outbound package-repository connectivity from recorded hosts, normally through an Internet Gateway, NAT Gateway, or approved internal repository
- A decision on (1) any user exclusions (2) whether input, output or both must be recorded
This article uses the all-user model deliberately with both input & output captured for replaying. All sample code and assets are available in the below repository:
https://github.com/toabose15/oci-tlog-session-recording-replayPrepare OCI for fleet collection
The OCI configuration should be created once and applied to hosts through a tag-based dynamic group. This keeps collection configuration centralized and avoids individually editing Unified Monitoring Agent settings on each instance.
1. Target the right instances
Apply a defined tag that identifies instances enrolled in terminal-session monitoring. Create a dynamic group whose matching rule selects only those instances and pair the group with the least-privilege policies required for the agent configuration. See Working with Dynamic Groups for detailed steps. This article uses the below tag namespace, dynamic group & IAM policies:
Tag namespace = 'Instances'
Tag definition = 'SessionMonitoring'
List values = 'True', 'False'
dynamic-group-1
All {instance.compartment.id = 'ocid1.compartment.oc1..XXX', tag.Instances.SessionMonitoring.value = 'True'}allow dynamic-group 'identity-domain-name'/'dynamic-group-1' to use log-content in compartment XXX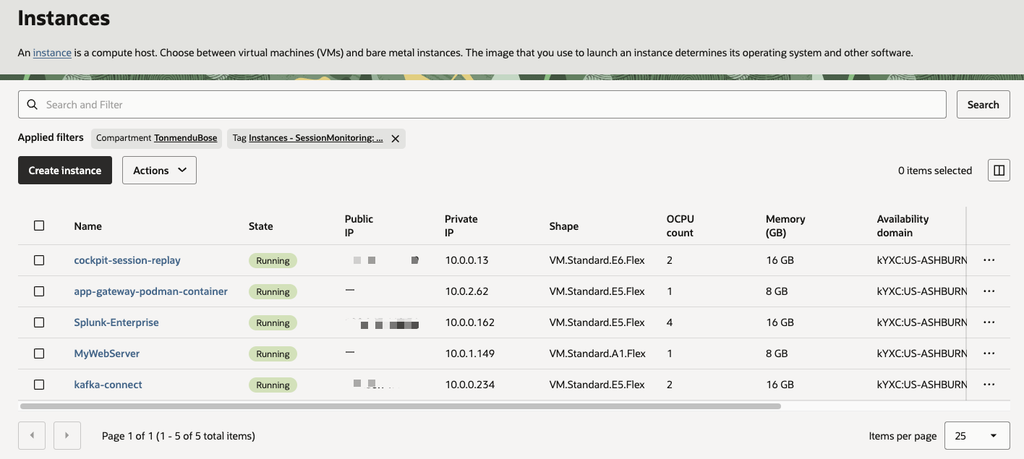
2. Create the custom log destinations
Create three different custom logs. Each of them serve a different purpose.
| Source | Host path | Why it matters |
|---|---|---|
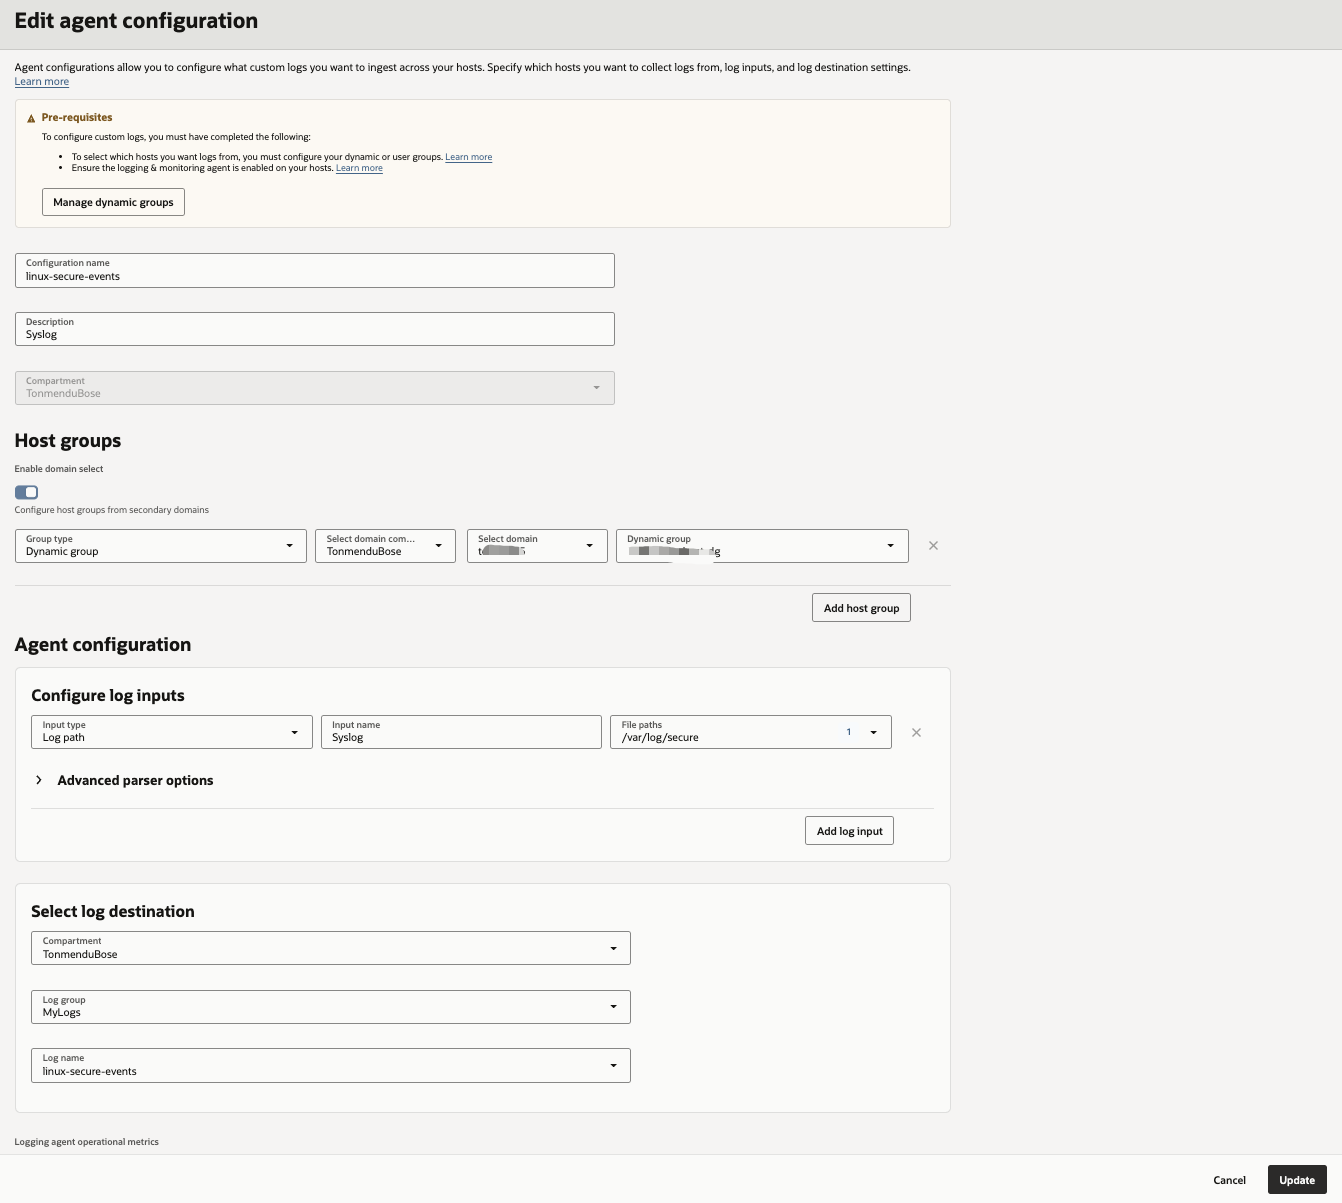
| TLOG session events | /var/log/tlog/tlog.jsonl | Captures terminal session I/O and recording metadata. |
| Linux security log | /var/log/secure | Captures SSH authentication and PAM/SSSD messages. |
| Linux audit log | /var/log/audit/audit.log | Captures audited privileged activity and operating-system security events. |
OCI custom logs are a two-part configuration: create the log resource first, then associate it with an agent configuration later. Oracle documents the model in Custom Logs.
3. Configure the Unified Monitoring Agent (UMA)
Next, enable the Custom Logs Monitoring Oracle Cloud Agent plug-in for the tagged instances. See Agent Configuration Management for the current console and API procedures. OCI supports agent configurations on Oracle Linux 8 and 9, review the current support matrix in the Agent Management Overview.
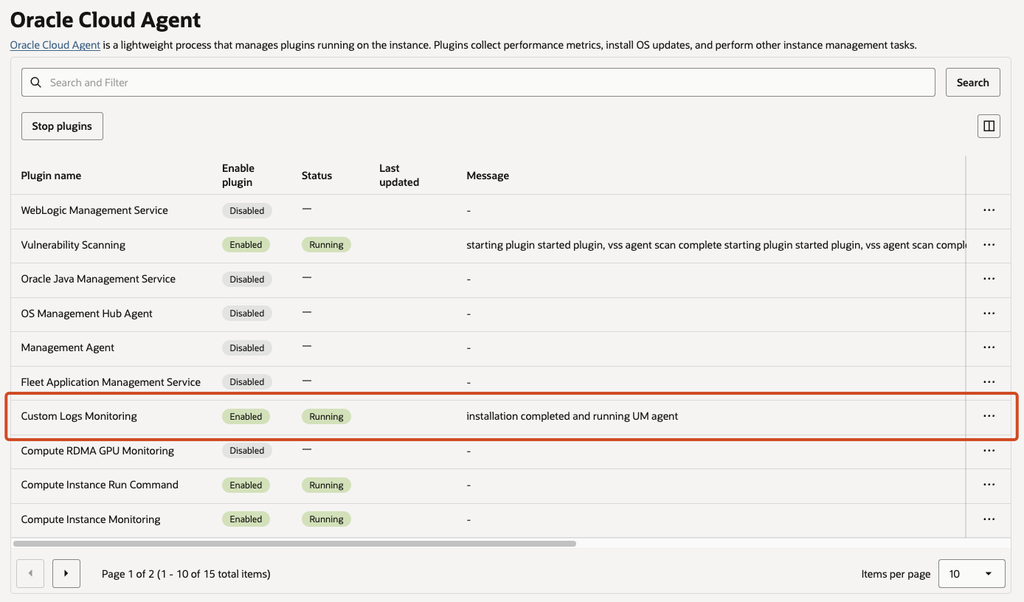
Now, create an agent configurations for each custom log created. This will reference the dynamic group created earlier, the local log path and the OCI log destination.
4. Enroll an Oracle Linux host
The enrollment scripts support Oracle Linux 8 and 9 and records all interactive users, including root. It installs TLOG and its supporting services, enables the local SSSD files domain, keeps the journal persistent, writes TLOG JSONL to /var/log/tlog/tlog.jsonl, and sets up log retention.
For existing hosts:
- Review any PAM, SSSD, or authselect customization before proceeding further
- Place the standalone script in a local directory
- Run as root to complete the enrollment
For new hosts:
- Use the cloud-init script
- Add the tags required for dynamic group membership
- Enable the Custom Logs plugin within Oracle Cloud Agent
Validate one host before fleet rollout
Open a new SSH session—the shell that executed the enrollment script will not retroactively become recorded. Run a harmless validation sequence and log out:
id
hostname
printf 'TLOG_OCI_INGESTION_TEST\n'
exit
On the host, confirm the local event and agent access:
sudo tail -n 1 /var/log/tlog/tlog.jsonl | \
  jq -c '{rec, user, host, time, in_txt}'

sudo -u oracle-cloud-agent head -n 1 /var/log/tlog/tlog.jsonl
Then confirm that the downloaded agent configuration contains all three expected paths:
sudo grep -n -E '/var/log/tlog/tlog\.jsonl|/var/log/secure|/var/log/audit/audit\.log' \
  /etc/unified-monitoring-agent/conf.d/fluentd_config/fluentd.conf
Only expand the tag-based rollout after this local validation and the corresponding OCI events have been confirmed.
5. Route evidence to Log Analytics
Send the three custom logs—TLOG session events, Linux security events, and Linux audit events—to one OCI Logging log group. Create a Service Connector Hub route that delivers that shared log group to Log Analytics. This keeps the collection destination centralized while allowing the imported sources and parsers to distinguish each event type.
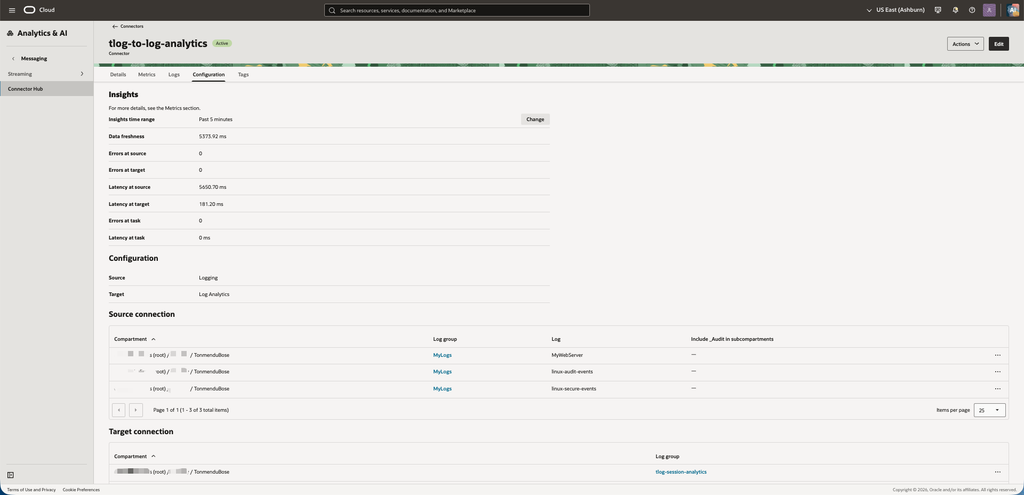
Configure the connector after the custom logs begin receiving data. Oracle documents Connector Hub and the supported pattern for ingesting OCI custom logs into Log Analytics.
Set up Log Analytics for session investigation
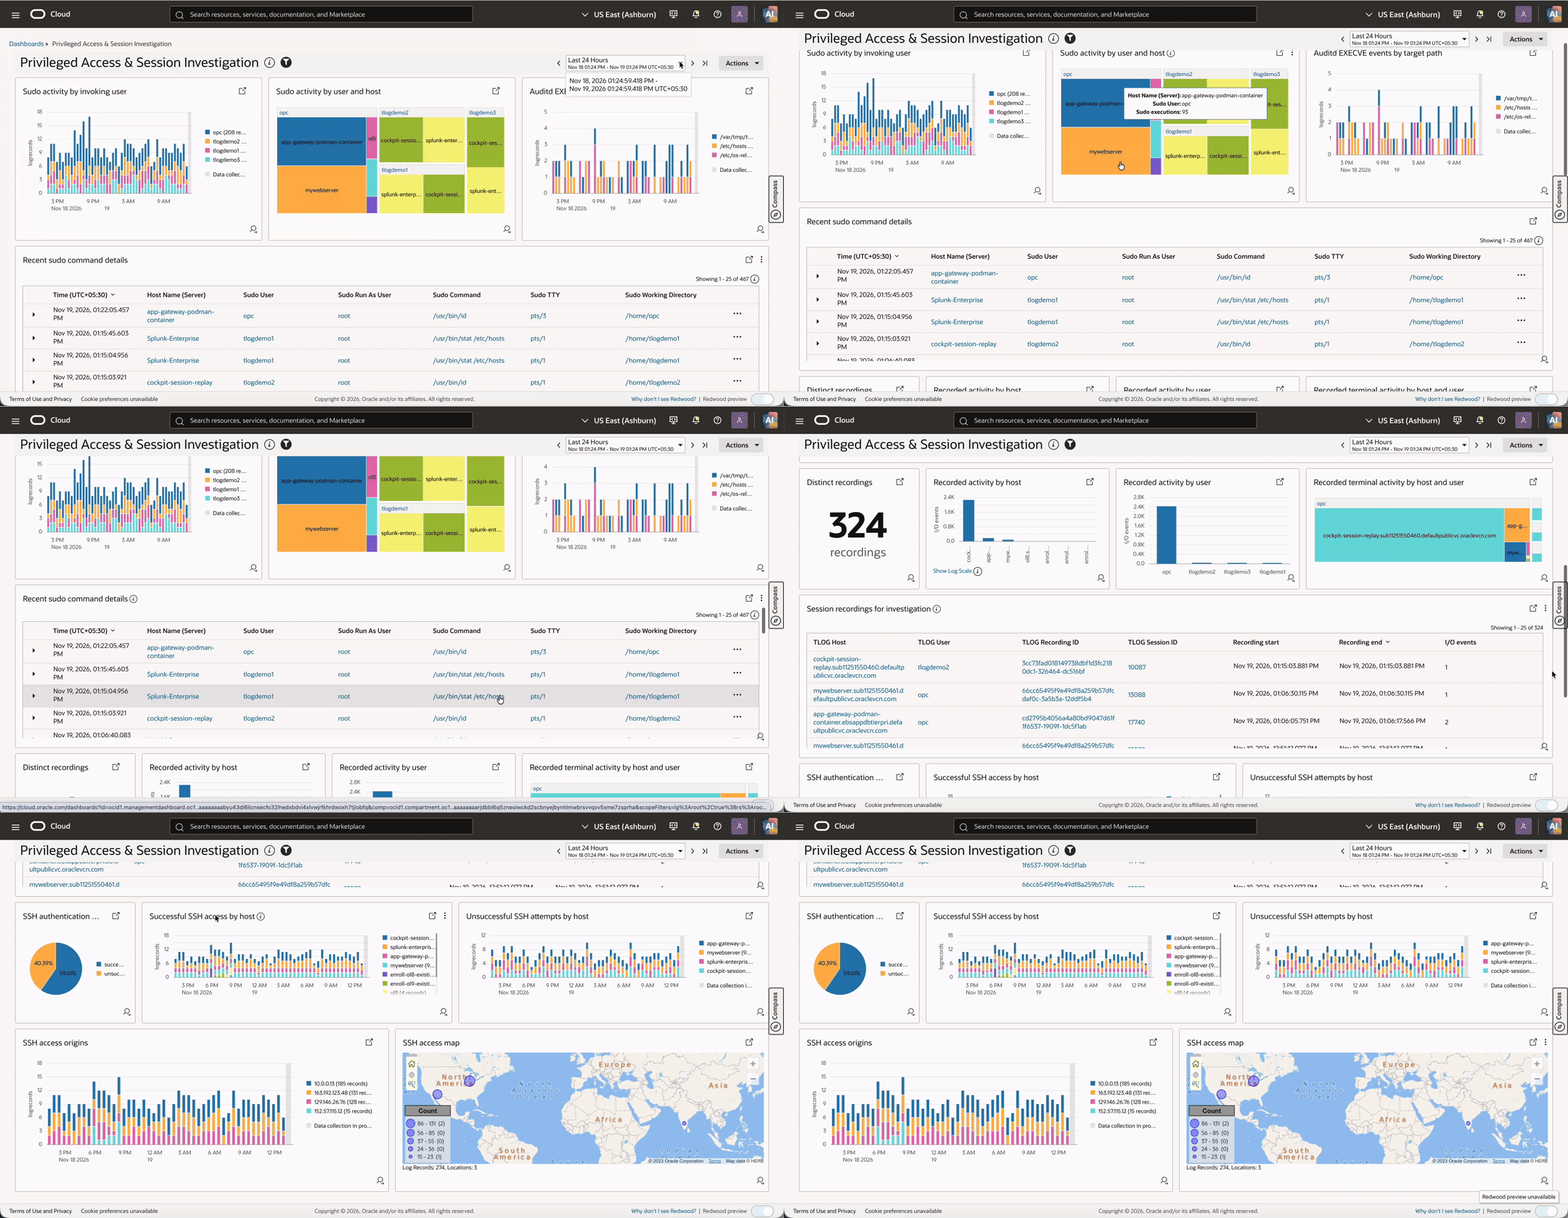
After OCI Logging delivers the custom log events, use Log Analytics to parse, enrich, search, and visualize the evidence. This implementation uses one dashboard: Privileged Access & Session Investigation. It brings together privileged commands, recording metadata, and SSH context without showing raw terminal input or output by default.
1. Import parsers and sources
Import the supplied parsers before their dependent sources. The repository contains parser definitions for the TLOG wrapper, TLOG session JSON, Syslog JSON, and Auditd JSON; it also contains sources for com.oraclecloud.logging.custom.tlog-session-raw, com.oraclecloud.logging.custom.Syslog, and com.oraclecloud.logging.custom.Auditd. Oracle documents the supported Log Analytics configuration import workflow.
Together, these definitions expose recording IDs, users, hosts, session IDs, timestamps, SSH source addresses, authentication fields, sudo context, and Auditd EXECVE command details.
2. Import the Log Analytics dashboard
Import the dashboard from the repository after creating the saved searches. The dashboard presents privileged activity first, session recordings second, and SSH insights last, so an investigator can move from an observed command to its associated recording and connection context. The widgets offer three investigation areas:
- Privileged activity — sudo activity by invoking user and by user/host, audited
EXECVEtarget paths, and recent sudo command details. - Session recordings — distinct recordings, I/O activity by host and user, host/user composition, and recording metadata for investigation.
- SSH insights — authentication outcomes, successful and unsuccessful activity by host, source-address activity, and source-location mapping.
Recording playback
Log Analytics identifies the relevant recording ID, user, host, and time window. Playback then provides the surrounding terminal context without re-running the original commands. There are two paths for playing back a session.
Path A: Replay from the originating host
For a quick review, an authorized administrator can connect to the originating host and replay a specific recording from the local system journal:
sudo tlog-play -r journal -M TLOG_REC=<recording-id>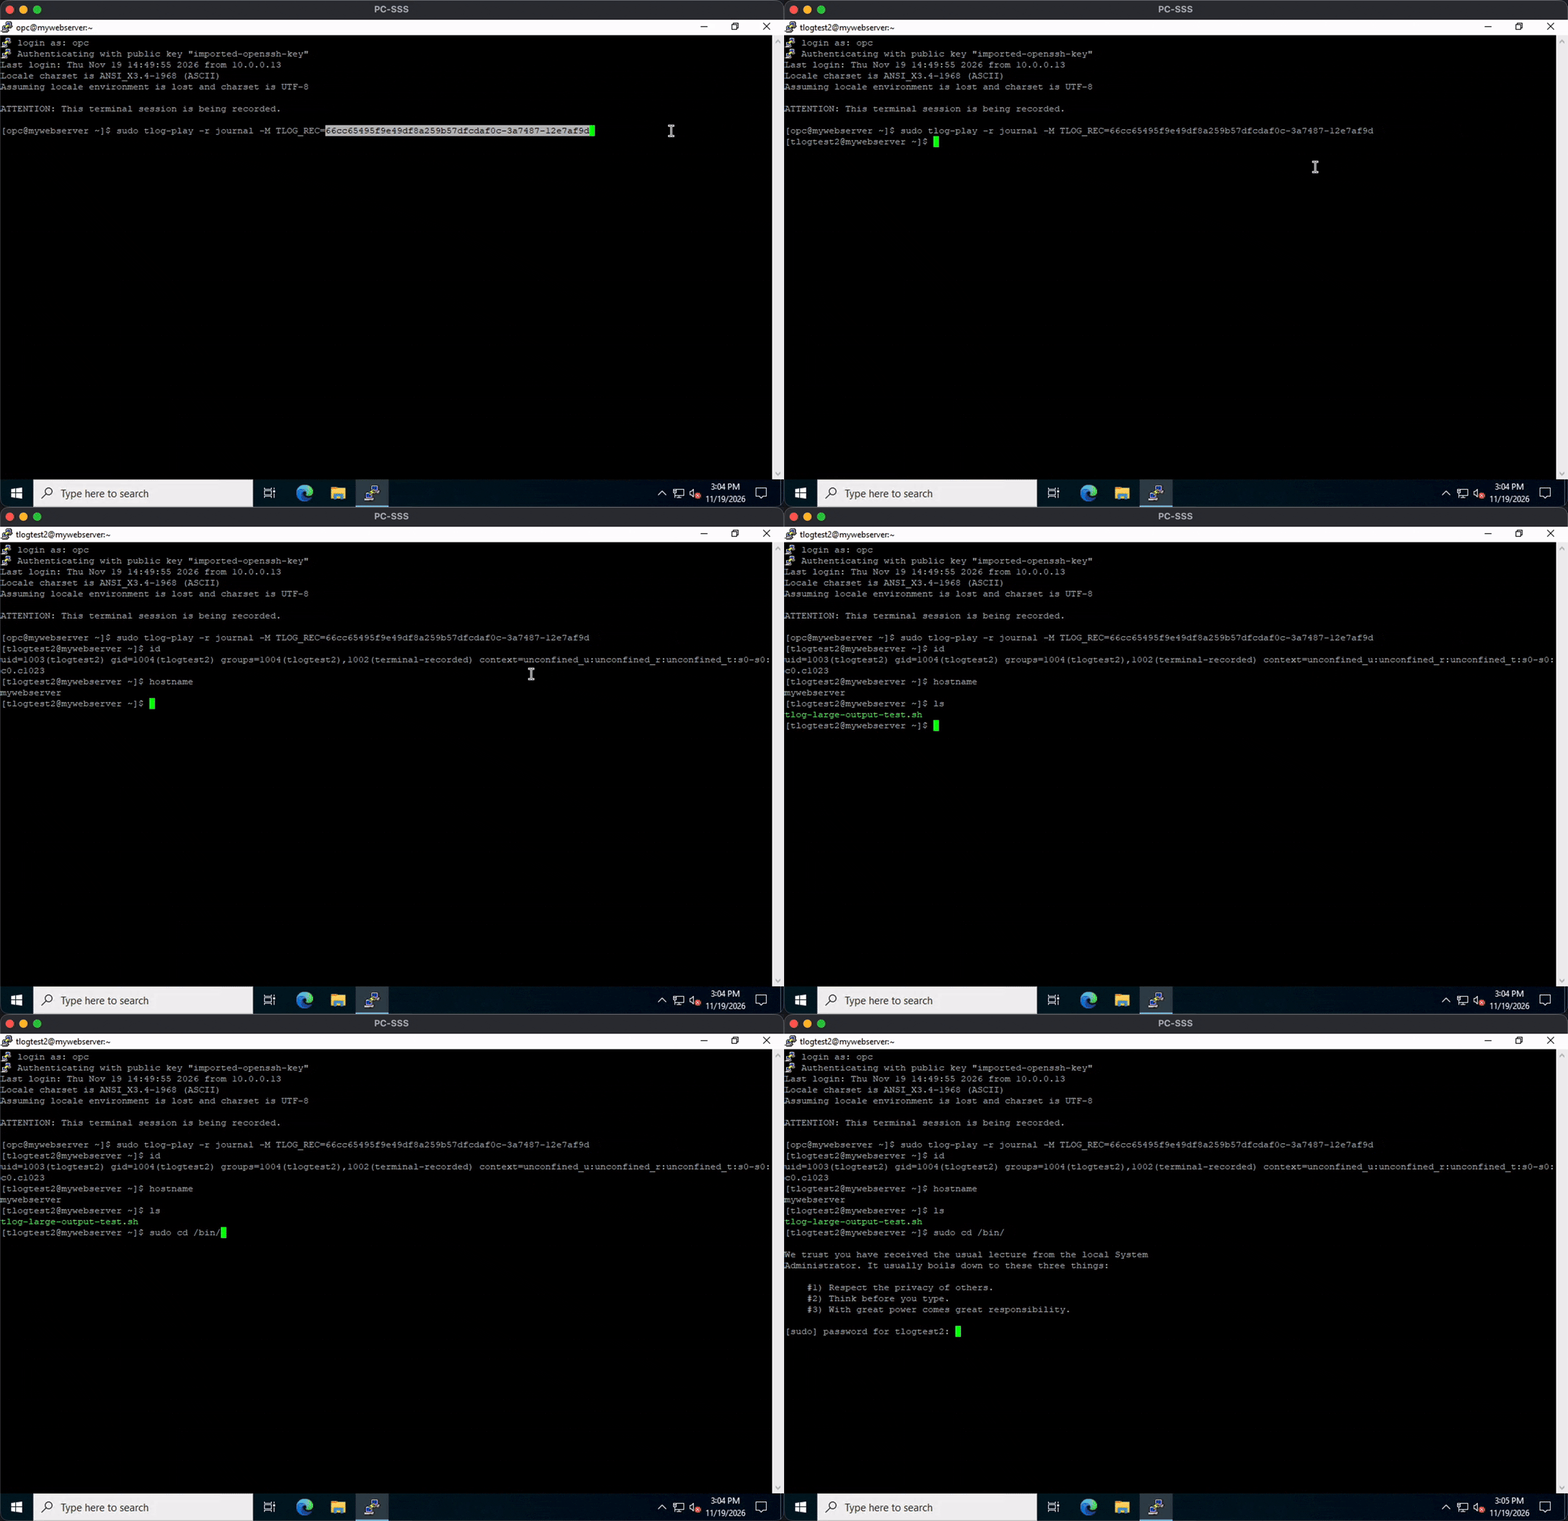
This approach is useful when the recording is recent and the reviewer already has approved administrative access to the host.
Path B: Replay through a dedicated Cockpit application
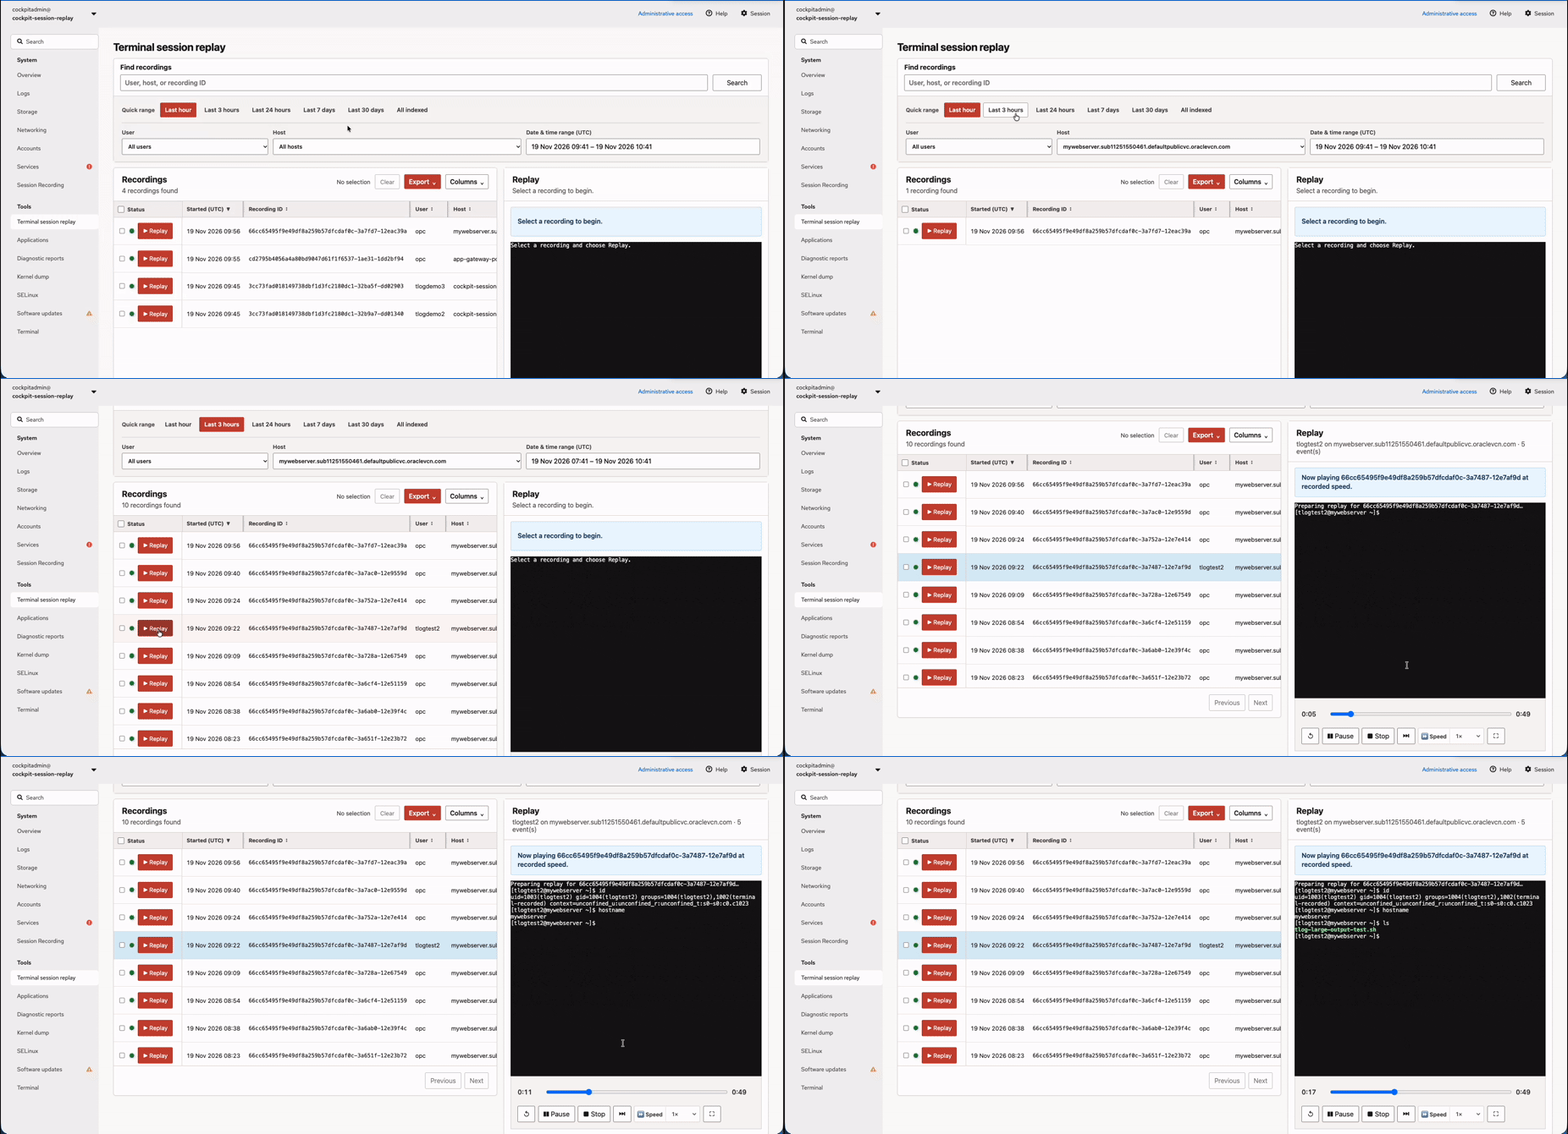
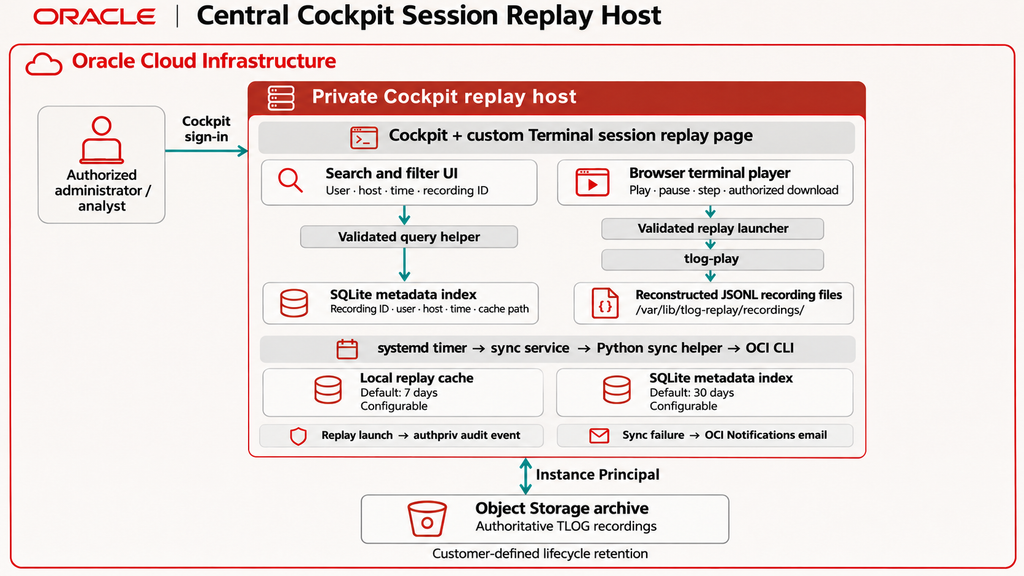
For centralized review, deploy a dedicated host that runs a custom replay application on Cockpit. It does not SSH to, or directly manage, recorded workload hosts. It retrieves approved session archives from an Object Storage bucket by using its instance principal and a least-privilege IAM policy.
The replay application provides:
- A searchable list of available recordings with filters for date and time, user, and host
- On-demand playback of the selected recording
- Download recordings as artifacts
1. Replay architecture
2. Deploy the centralized replay service
Create an Object Storage bucket for storing raw-sessions, then configure a second OCI Connector Hub route for the selected session-data stream, as shown in Figure 1. This complements the Log Analytics path used for search and investigation.
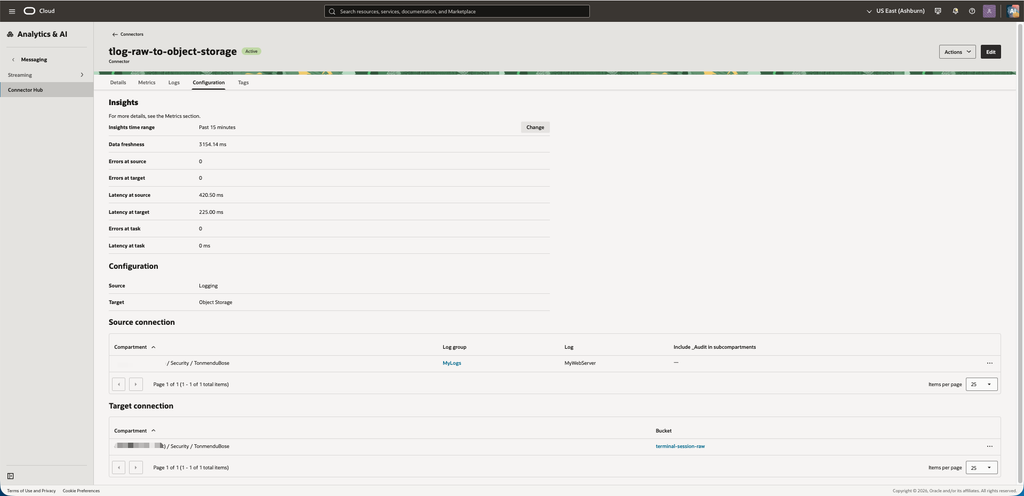
Next, create a Oracle Linux compute instance on a private subnet. Once done, setup a second dynamic group that makes it an instance principal.
dynamic-group-2

All {instance.id = 'ocid1.instance.oc1.iad.XXX'}
Then, reference the same group in the below IAM policies that grant read access to the bucket of recordings.
Allow dynamic-group 'identity-domain-name'/'dynamic-group-2' to read objectstorage-namespaces in tenancy
Allow dynamic-group 'identity-domain-name'/'dynamic-group-2' to read buckets in compartment XXX where target.bucket.name = 'terminal-session-raw'
Allow dynamic-group 'identity-domain-name'/'dynamic-group-2' to read objects in compartment XXX where target.bucket.name = 'terminal-session-raw'
Finally, use the deployment script to configure the replay application, its local catalogue and cache, and periodic archive synchronization. Supply the administrator credentials, archive retention, and network values as per the instructions. Post deployment, validate that admins can find and replay the recordings.
Conclusion
This solution gives auditors and security analysts a practical way to collect, search, and review SSH terminal-session evidence on OCI. SSH, audit, and sudo logs establish the access and privilege context; TLOG supplies the terminal interaction; Logging Analytics helps identify the relevant recording; and the dedicated replay application supports controlled review when deeper investigation is required.