Overview
Oracle E-Business Suite is the engine managing the business data behind many global enterprises. When unexpected events happen and the application performance gets degraded, finding the “why” in a haystack of various Logs produced by the EBS Application components can feel like a full-time forensic investigation.
By leveraging Oracle Cloud Infrastructure (OCI) Log Analytics and ingesting all your logs in a unified service, you can move from manual “grep-ing” to AI-powered insights.
Why Move Logs to the Cloud?
Traditional log management for EBS is often siloed: logs are located on the Application tier, the Database tier, or within the Concurrent Processing nodes. OCI Log Analytics provides:
- Unified Collection and Ingestion: You can push logs from Application nodes, Weblogic Clusters and even Database to Log Analytics. A number of seeded parsers automatically parse the logs as they are ingested creating a catalog of attributes that can be used for analysis including setting Error Labels.
- Cluster Analysis: Uses AI to group millions of log entries into a few dozen “signatures,” highlighting outliers and errors automatically.
- Build Dashboards and Event Notifications: Using the query language you can run complex queries and save the results showing the data in Charts or Tables that can be added to Custom Dashboards. You can also create Metrics based on Trigger conditions that can than be used to send Notifications using the Monitoring and Notification service.
Here is how you can setup log collection to Log Analytics and use it’s analytic capabilities to resolve issues.
Step 1: Onboard and Enable Log Analytics
Before collecting logs, you must enable the service in your OCI Tenancy:
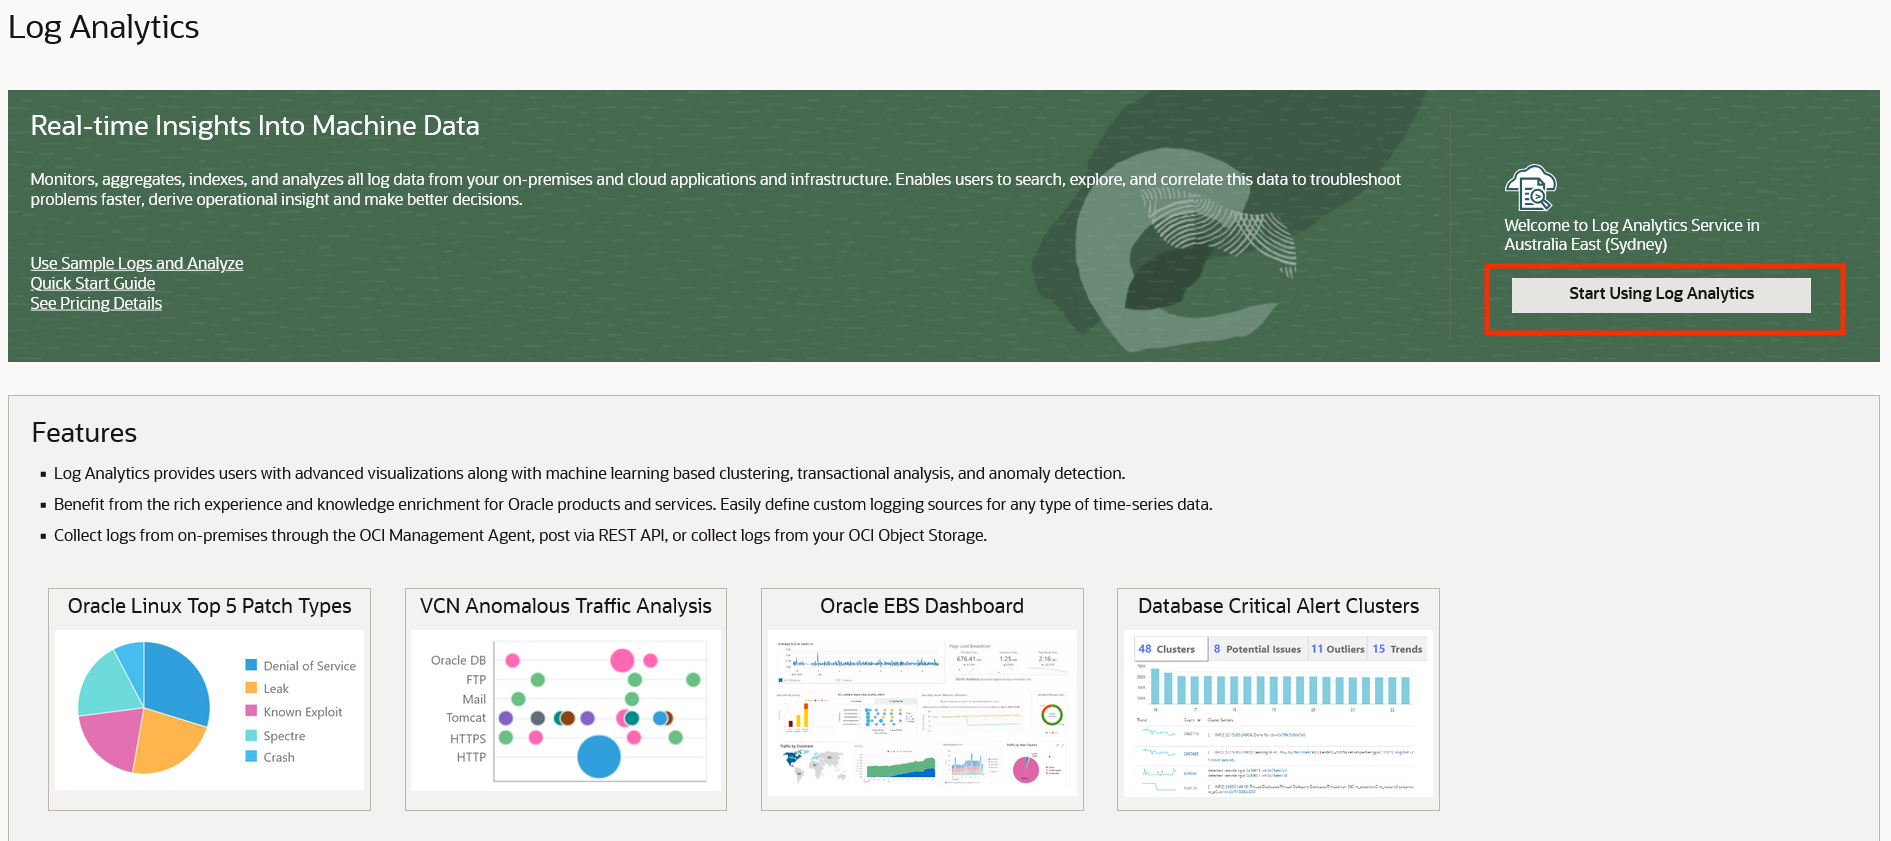
Navigate to Observability & Management > Log Analytics.
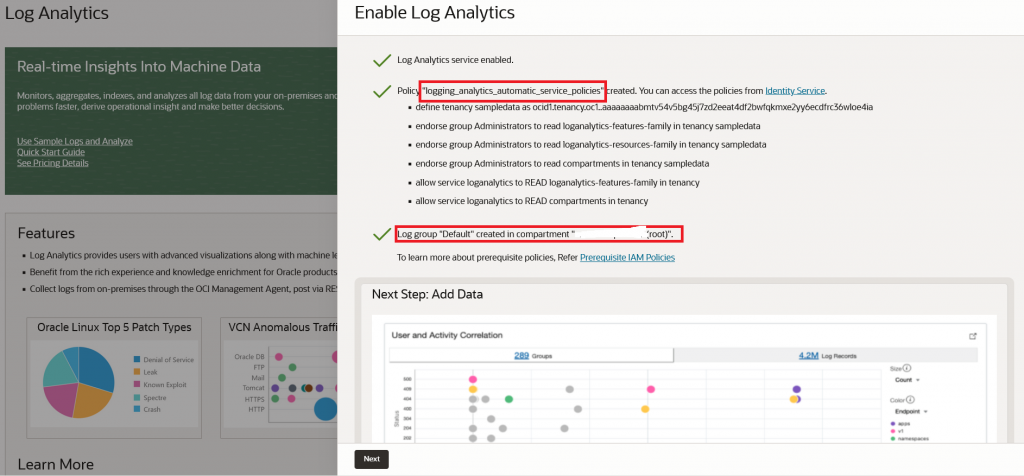
If it’s your first time, click Start Using Log Analytics. This automatically sets up the required IAM policies and a default log group.
Create a Log Group: Organize your EBS logs by creating a dedicated group (e.g., EBS_Production_Logs) to control access and retention.
Step 2: Install Management Agents
To bridge your Application hosts (OCI, on-premise or other Clouds) with Log Analytics service, you need the OCI Management Agent. For OCI Computes, this can be achieved by just activating the Management Agent Plugin from your Compute Details screen in OCI Console.
https://docs.oracle.com/en-us/iaas/management-agents/doc/management-agents-oracle-cloud-agent.html
For on-premise or other clouds, you can download and install the agent.
https://docs.oracle.com/en-us/iaas/management-agents/doc/install-management-agent-chapter.html
Install the Agent: Deploy it on each EBS application host.
Step 3: Discover Entities
The agent can automatically discover your EBS entity model, including the Concurrent Manager and WebLogic domains. This feature provided by Stack Monitoring Service is used by Log Analytics to discover and create entities.
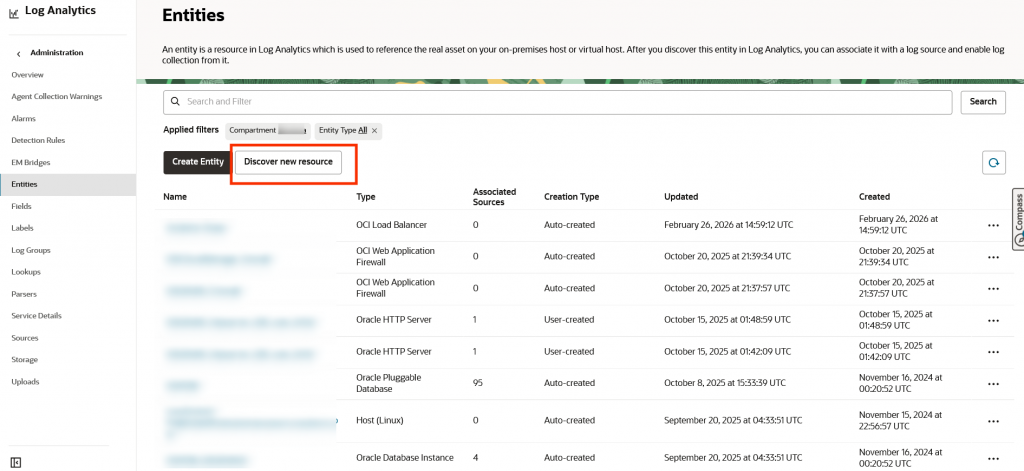
Go to Log Analytics Administration > Entities
There are prerequisites for enabling Stack Monitoring and setting up a monitoring account in the EBS database. Please follow the instructions from the “prerequisites” link before trying discovery.
Provide details of the EBS environment – Weblogic Admin node and Database details
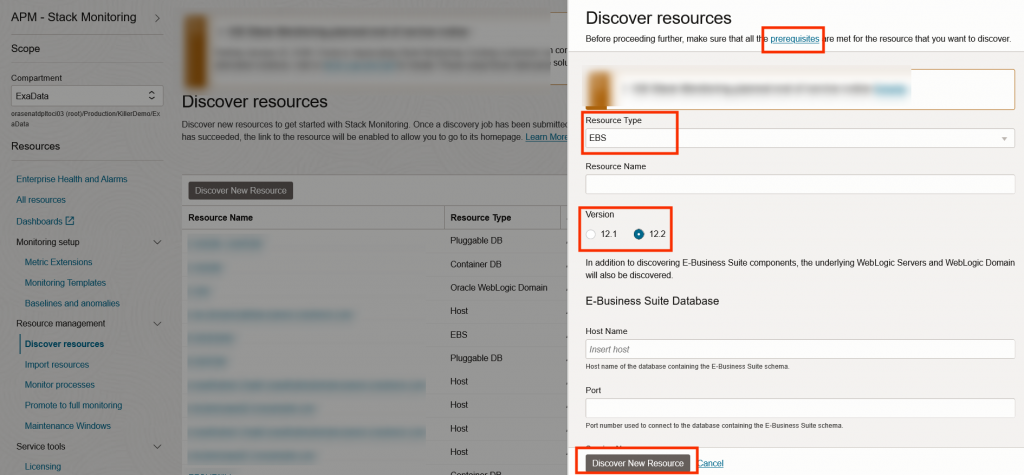
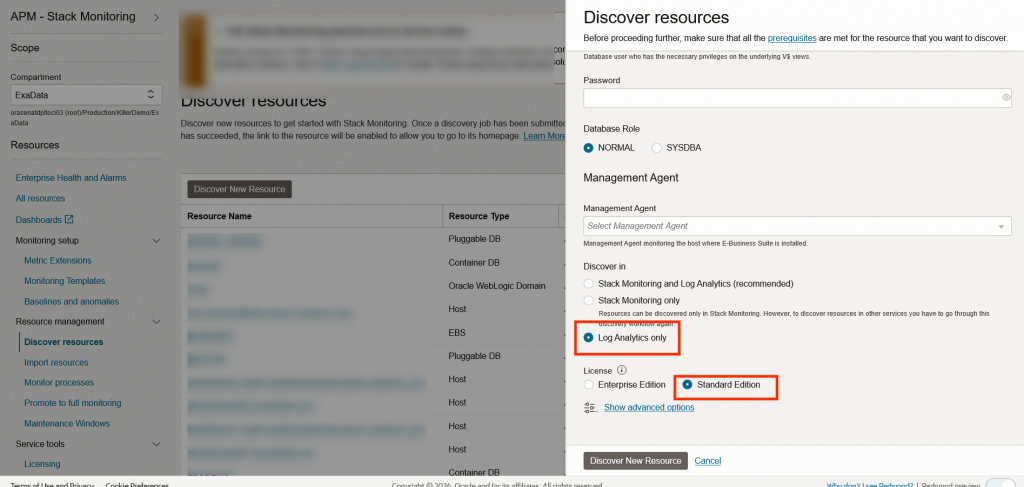
Unless you are interested in using Stack Monitoring Service, select “Log Analytics Only” option and “Standard Edition”
Entity Mapping: Once discovery is completed, go back to Log Analytics Administration > Entities to ensure your hosts are correctly represented.
Step 3: Associate Log Sources
Oracle provides many predefined log sources specifically for EBS. You don’t need to write complex regular expressions for standard logs.
Associate these sources with your discovered Entities. This tells the agent exactly which log files to monitor and upload.
In the Log Analytics Administration page, click Sources.
Here are a list of recommended Sources to be used for EBS:
- OCI Load Balancer Access Logs & Error Logs ( If your application is using OCI Load Balancer)
- OCI WAF Logs (If your application is using OCI Web Application Firewall)
- FMW OHS Access Logs
- FMW WLS Server Access Logs
- FMW WLS Server Logs
- FMW WLS Server STDOUT Logs
- Oracle EBS Concurrent Manager Logs
- EBS Concurrent Request Logs
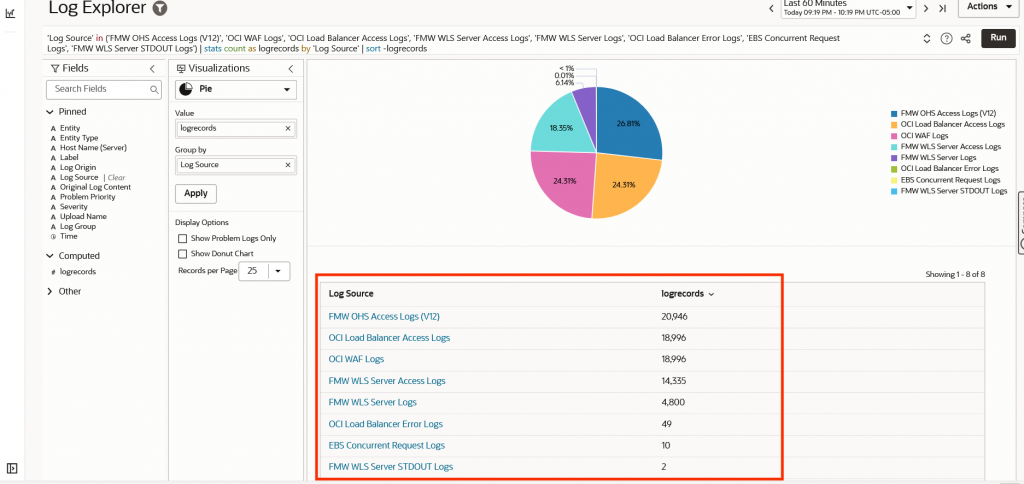
Once the Sources are associated with their respective entities, the management agents will start collecting logs. Navigate to Log Analytics – Log Explorer Page and you should see a listing of Logs collected
Step 4: Proactive Analysis with “Link” and “Cluster”
Once data flows in, use the Log Explorer to go beyond simple searching:
Link: Use the Link command to correlate logs across the stack. For example, link a specific Request ID from the Concurrent Manager logs to the corresponding database session logs to see where a bottleneck occurred.
Cluster: Click the Cluster button to let the ML engine identify patterns. It will highlight “Trends” (persistent issues) and “Anomalies” (sudden spikes in specific errors).
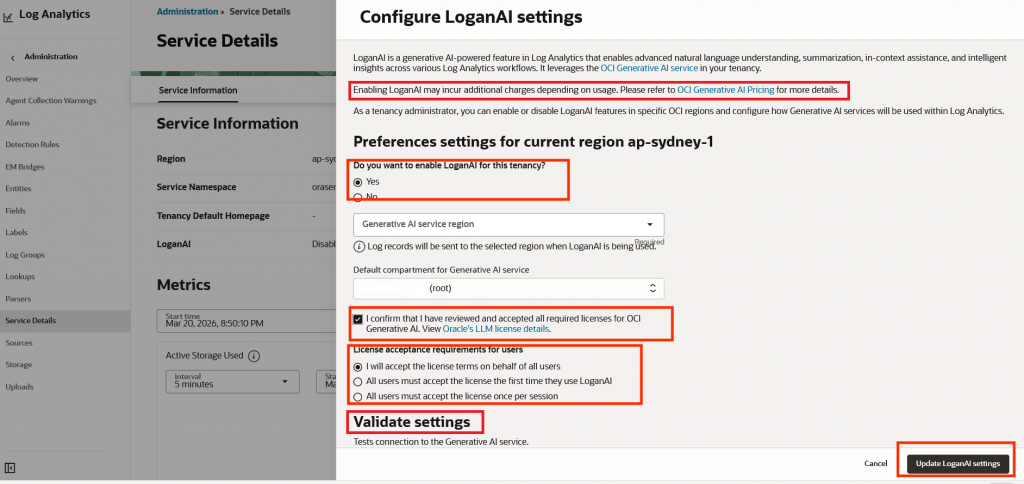
Step 5: Enable LoganAI (Optional)
You can optionally enable LoganAI to use Generative AI features in Log Analytics.
Please note that you will incur costs to use Generative AI in addition to the cost of Log Analytics Service. Review the details included in the documentation.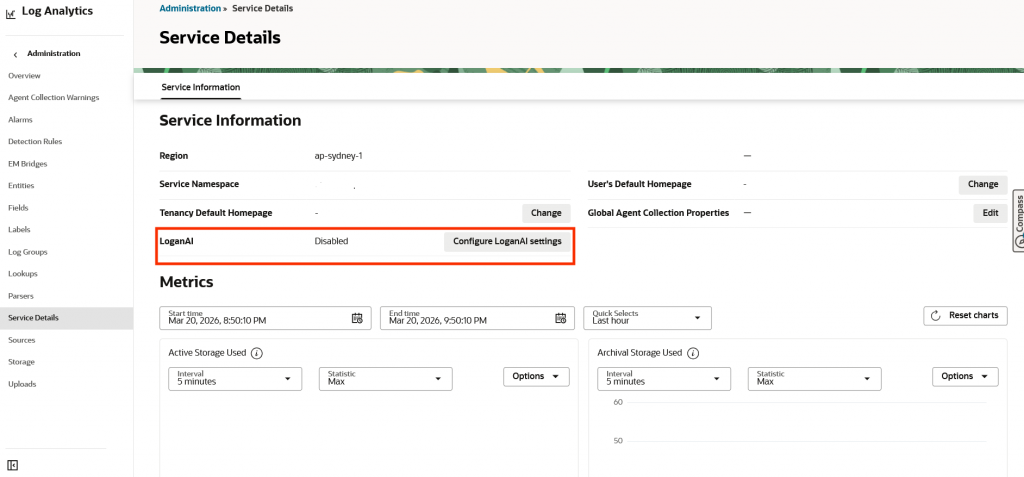
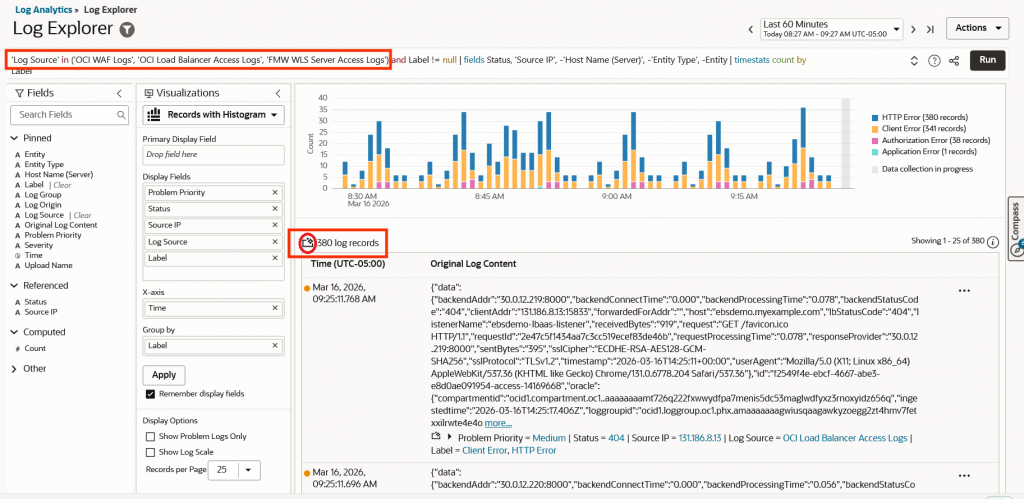
Once LoganAI is enabled you will start seeing a new icon next to the Log record count, Clicking on this icon will allow you to use the Generative AI features.
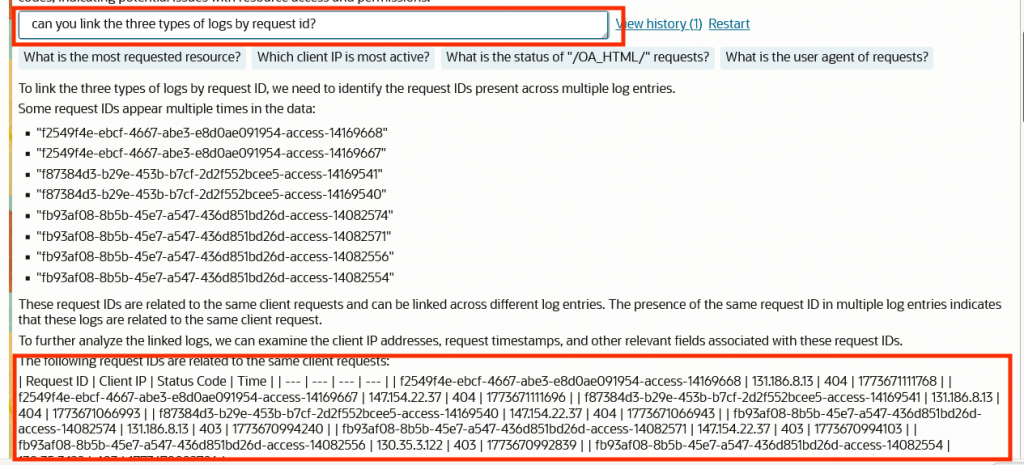
Step 5: Use LoganAI
Click on the LoganAI icon next to the Log Record count, Logan AI will review all the selected logs and provide a default analysis
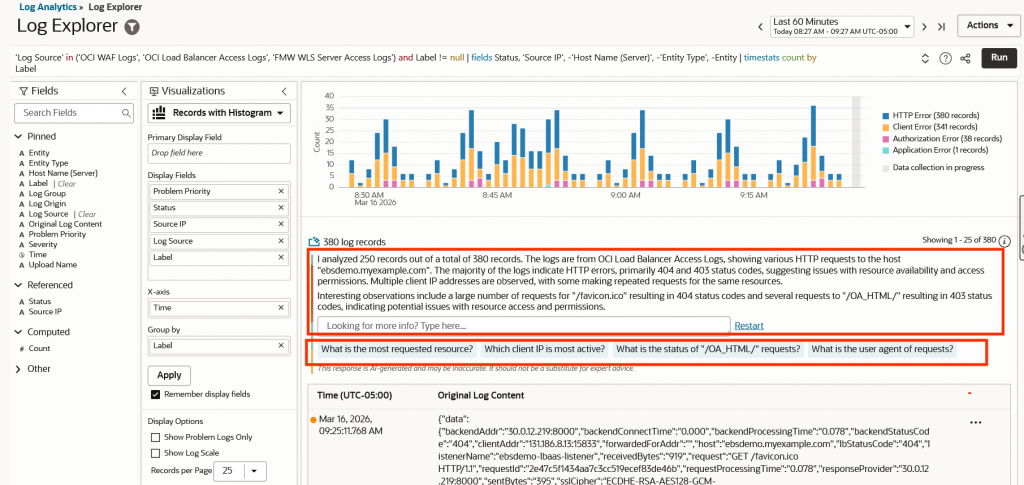
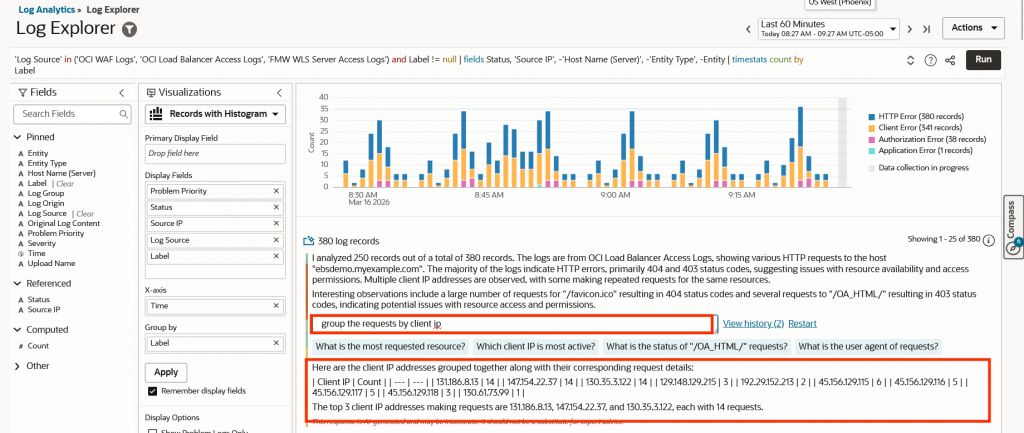
Now you can ask your own questions and get responses, here are some sample questions and responses:
Resources and References
- Log Analytics Documentation: Log Analytics Quick Start
- Prerequistes for using LoganAI: LoganAI Prerequisites
- Use LoganAI: LoganAI
- OCI Pricing Information: OCI Pricing