
In Part 1 of this series, we focused on distributed tracing using OpenTelemetry and OCI Application Performance Monitoring (APM), enriching traces with Kubernetes metadata to provide deeper visibility into application behavior.
However, traces alone only tell part of the story.
They help us understand what is happening within a request, but not always why the system is behaving a certain way—especially when issues originate from the platform layer.
In managed Kubernetes environments like Oracle Kubernetes Engine (OKE), the cloud provider abstracts away significant portions of the control plane and infrastructure. While this simplifies operations, it also introduces a new challenge: understanding how platform-level events influence application behavior.
In this post, I walk through two troubleshooting patterns: a failed checkout trace where the Kubernetes workload is healthy and Log Analytics reveals an application root cause, and a temporary crash-looping pod where the application continues serving traffic through healthy replicas. I also show how selected kube-state-metrics can be sent to OCI Monitoring through the OpenTelemetry Collector for lifecycle-focused metric views.
Observability options for Oracle Kubernetes Engine (OKE) on OCI
As a managed Kubernetes service, Oracle Kubernetes Engine (OKE) already exposes several observability paths out of the box. OCI lets you monitor cluster, node pool, and worker node status directly from the OKE console, and also provides OKE service metrics in the oci_oke namespace for health, capacity, and performance. These built-in metrics are useful for understanding cluster and worker-node behavior without adding extra collection components. See Monitoring Clusters and Kubernetes Engine (OKE) Metrics.
For worker-node and add-on visibility, OKE also supports managed health observation through the ObservabilityAgent and NodeProblemDetector add-ons. These collect infrastructure and platform metrics from sources such as kubelet, cAdvisor, CoreDNS, and KubeProxy, and help surface node-level issues such as resource saturation and network problems. See Observing Worker Node and Add-On Health.
OCI also provides several logging paths. You can view control plane service logs for components such as kube-scheduler, kube-controller-manager, cloud-controller-manager, and kube-apiserver through OCI Logging. You can also view audit logs for OKE operations and Kubernetes API server administrative activity through OCI Audit. For workloads, OCI documents how to collect and view application logs from managed nodes, self-managed nodes, and virtual nodes. See:
- Viewing Kubernetes Engine (OKE) Service Logs
- Viewing Kubernetes API Server Audit Logs
- Viewing Application Logs on Managed Nodes and Self-Managed Nodes
- Viewing Application Logs on Virtual Nodes
For teams that want a broader OCI-native Kubernetes observability experience, Oracle Log Analytics also provides the Kubernetes Monitoring Solution. This solution collects logs, metrics, and Kubernetes object/state information, and presents them through cluster, workload, node, and pod views. In practice, it adds a more unified exploration layer across logs, metrics, and Kubernetes object context.
See Kubernetes Monitoring Solution.
In this blog, I use the Kubernetes Monitoring Solution as a unified exploration layer across logs, metrics, and Kubernetes object context.
Architecture recap: application and telemetry flow
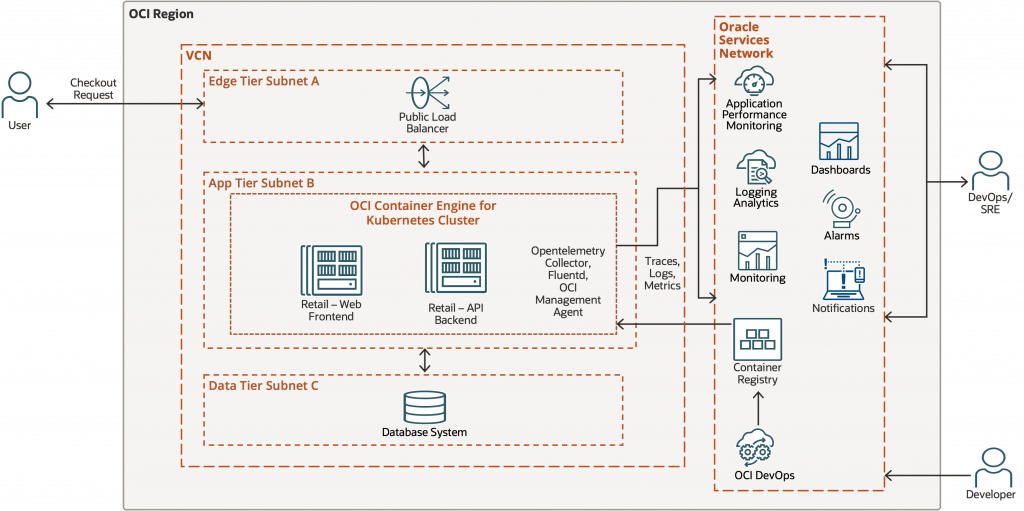
The application used in this series is a microservices-based retail checkout workflow deployed on Oracle Kubernetes Engine (OKE). Application requests flow through the frontend and backend services, with Python-based services instrumented using OpenTelemetry auto-instrumentation and selected manual spans. Telemetry is sent to an in-cluster OpenTelemetry Collector, which exports traces to OCI Application Performance Monitoring (APM), while logs and platform signals are analyzed through OCI observability services. The Kubernetes attributes shown later in the span details are added as trace metadata so that each request can be associated with the workload, pod, namespace, and node that processed it.
Using enriched traces to classify application and platform signals
In Part 1, we enriched application traces with Kubernetes metadata such as namespace, pod, node, and pod IP. In this section, we use that context during troubleshooting. The goal is to use the trace as an entry point, identify where the request ran, check whether the platform shows workload-health issues, and then pivot to logs for root cause analysis.
This distinction is important in Kubernetes environments. A failed request may be caused by application logic even when the pod and node are healthy. Conversely, a pod can be unhealthy while traffic continues through healthy replicas. Correlation helps classify the problem rather than prematurely assigning blame to one layer.
For the application-level scenarios, I also emit targeted application log messages from the API service so that request errors, trace identifiers, and workload context can be followed in Log Analytics. These records complement the platform and container logs collected through OCI.
Scenario 1: Failed checkout trace with workload-level analysis
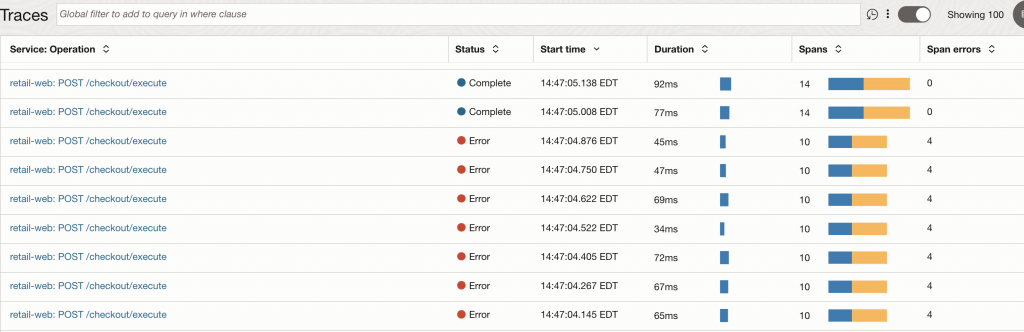
For this walkthrough, I triggered checkout requests that produced a mix of successful and failed traces. The failure appears during the payment stage, and the goal is to determine whether it is related to workload health or application logic.
The trace list in the image below shows that the same checkout operation sometimes completes successfully and sometimes fails. This gives us the first symptom: a request-level error is occurring during the checkout flow, but we do not yet know whether the issue is in the application, the workload, or the underlying platform.
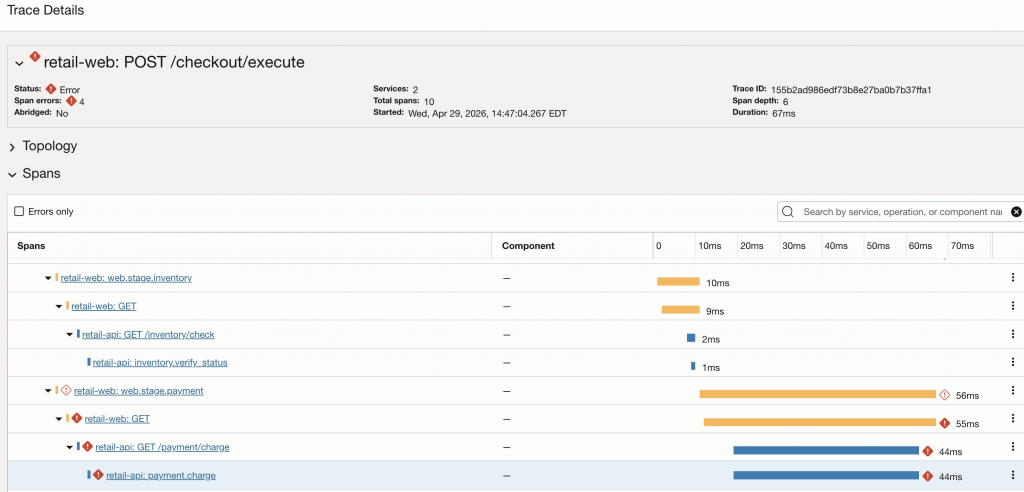
Opening one failed trace shows that the failure occurs in the payment portion of the workflow. The trace moves from the web service into the API service, and the error is visible on the payment_charge span. At this point, APM has narrowed the investigation from the entire application to a specific service and operation.
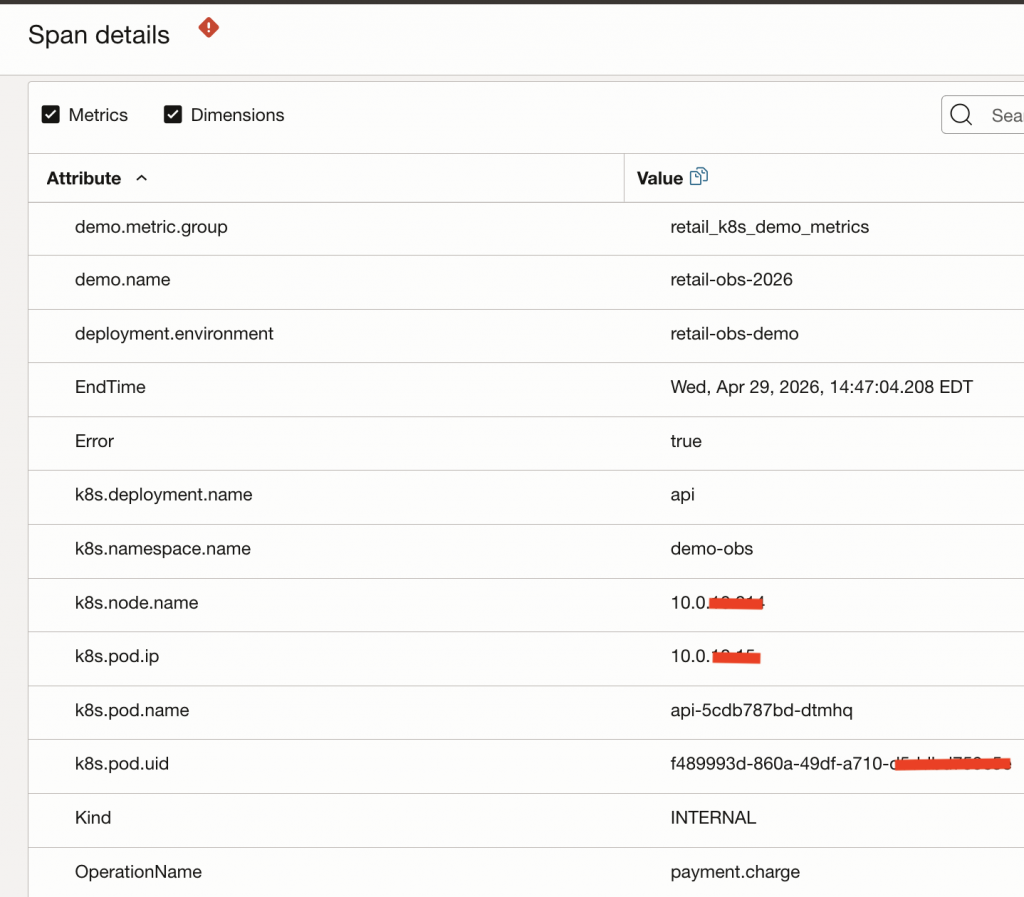
The span details include Kubernetes context such as deployment name, namespace, pod name, pod IP, and node name. This metadata is useful because it tells us exactly where this request was processed. Instead of searching the entire cluster, we can focus on the API workload and the specific pods involved in the failed request path.
Looking at another failed payment span shows a different API pod. This is an important clue: the failure is not obviously isolated to a single pod. If every failed trace pointed to one pod, we might suspect pod-local state, a bad replica, or node-specific behavior. In this case, failed spans appear across both API pods, which makes an application-level issue affecting the API service more likely.
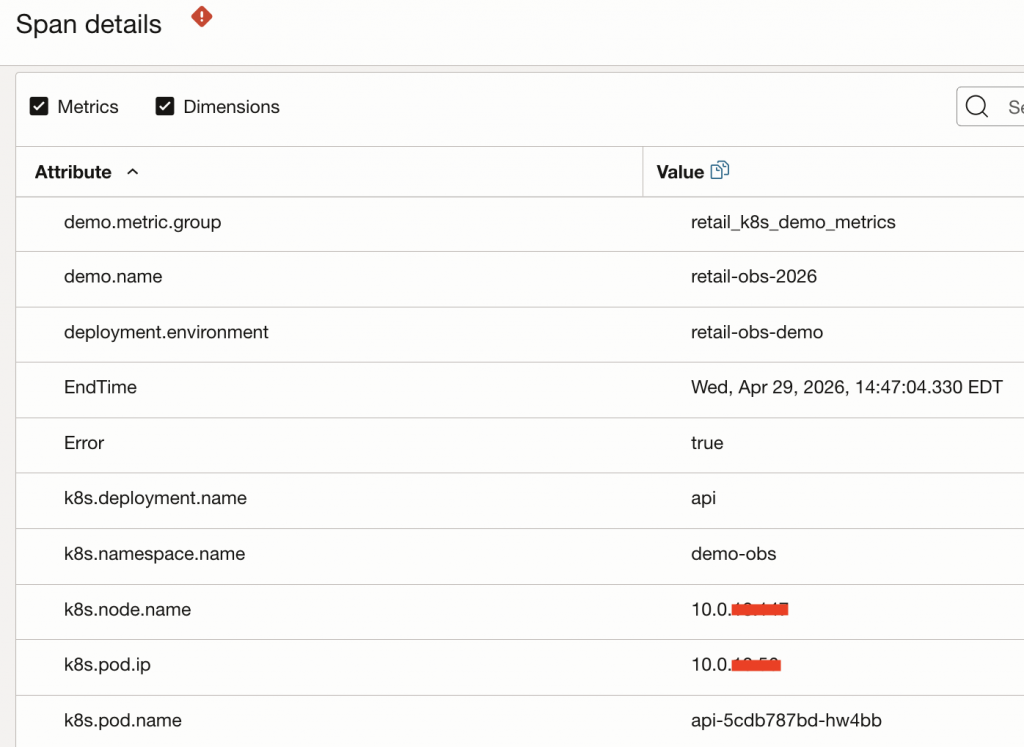
The failed span includes Kubernetes metadata such as deployment, namespace, pod, pod IP, and node. This metadata provides the workload context needed to continue the investigation in the Kubernetes Monitoring Solution.
In the Workload view, the solution summarizes recent workload issues across the collected logs. In this case, Logan AI identifies errors related to the retail-api and retail-web services and highlights a SQLite IntegrityError in the payment path. It also notes that related records share the same traceId, which connects the application trace to the log evidence.
I then use a follow-up question to ask for the source of the IntegrityError. Logan AI identifies the failure as a UNIQUE constraint violation on the payments.id column, occurring in the payment_charge function in api_app.py. This confirms that the failed checkout trace is caused by application logic/data handling rather than pod or node health.
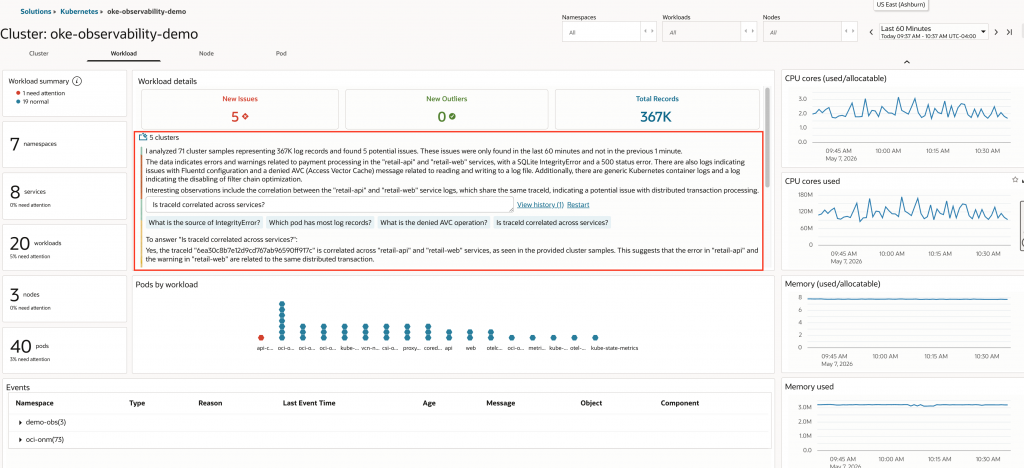
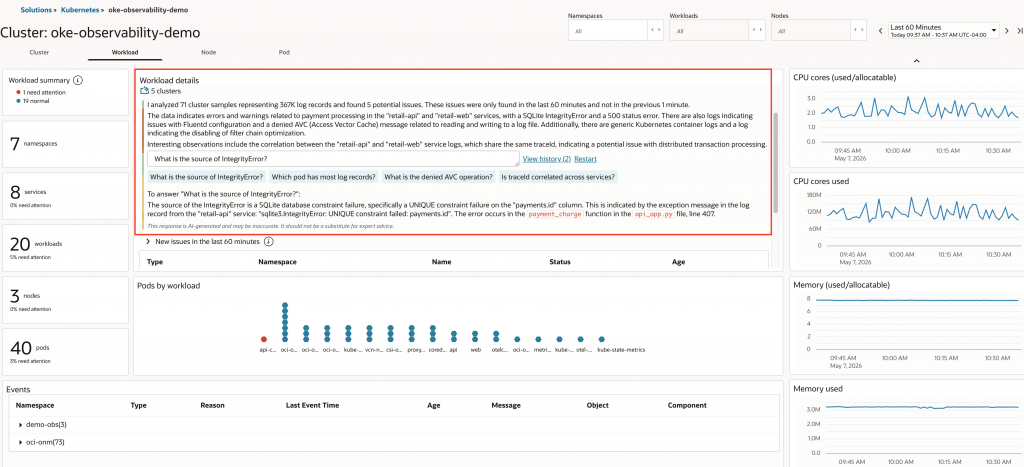
Key takeaway: Kubernetes metadata on traces does not mean Kubernetes caused the failure. It gives the context needed to decide where to investigate next. In this example, enriched traces helped identify the API pods involved, the OKE Monitoring Solution workload view summarized related service logs and helped identify the application error.
For deeper inspection, the same records can be opened in Log Explorer or searched directly by pod, log source, and error-like content.
APM-first or Log Analytics-first?
This walkthrough starts from APM because the scenario is request-centric: a checkout transaction failed, and we want to follow that specific request across services, spans, Kubernetes workload context, and logs. If the error pattern is already known, teams can also start from Log Analytics using clustering, saved searches, detection rules, or alarms to detect it proactively. In practice, both paths are useful: APM helps explain a specific failed transaction, while Log Analytics helps detect recurring patterns across the workload.
Scenario 2: Detecting a crash-looping pod while traffic continues through healthy replicas
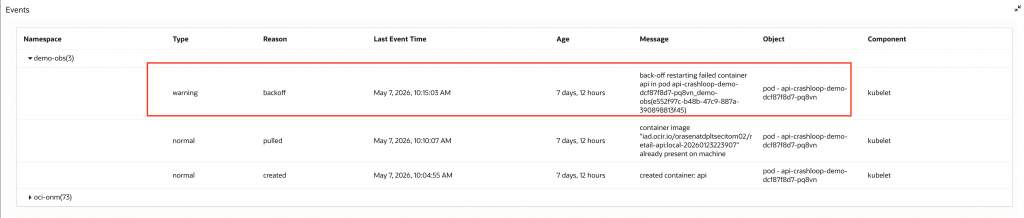
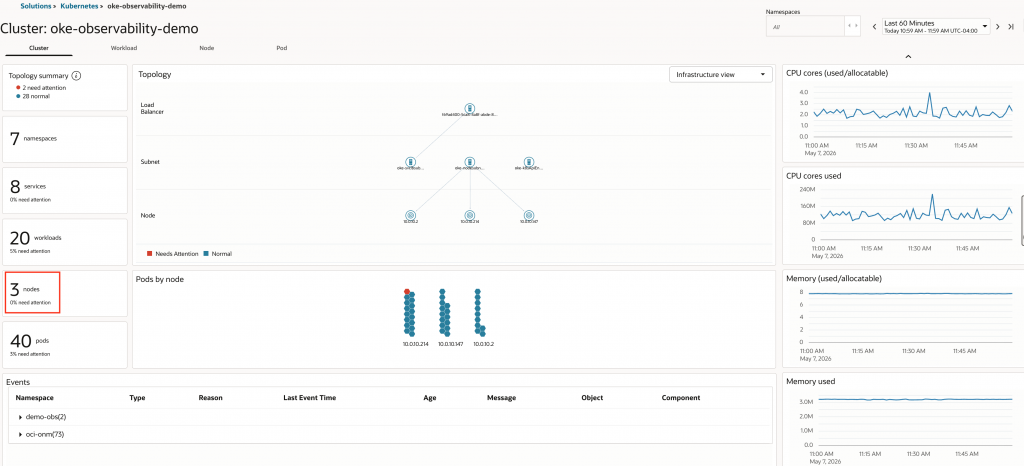
For this scenario, I created a temporary API pod that intentionally entered a CrashLoopBackOff state. I used the Kubernetes Monitoring Solution Cluster view to observe how the issue appears at the namespace, pod, and event levels while the application continues serving traffic through healthy replicas.
In the Cluster view, the topology summary shows resources that need attention, and the demo namespace is highlighted. The Pods by namespace view identifies the affected pod.
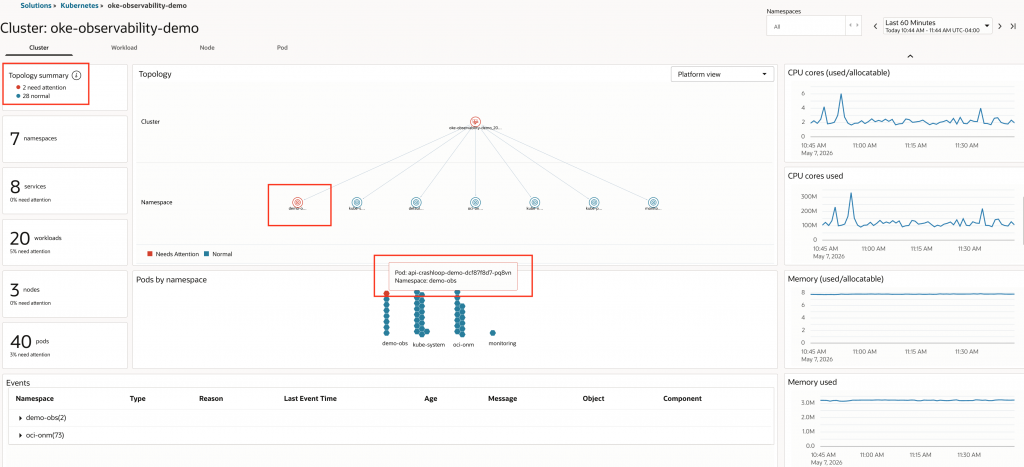
Expanding the Events panel shows the backoff warning generated by kubelet with the message back-off restarting failed container.
I also switched to the infrastructure view to check whether the issue was accompanied by node-level symptoms. In this case, the node view and resource charts did not indicate node pressure, which supports the conclusion that the issue is isolated to the temporary workload.
Optional extension: Sending Kubernetes state metrics to OCI Monitoring
The Kubernetes Monitoring Solution provides the primary troubleshooting view in this walkthrough. In addition, I sent a small set of kube-state-metrics to OCI Monitoring through the OpenTelemetry Collector so that lifecycle signals such as container restarts could be used in metric widgets or alarms.
kube-state-metrics
↓
OpenTelemetry Collector Prometheus receiver
↓
metric filtering
↓
OCI metric ingestion through the APM endpoint
↓
OCI Monitoring metric namespace
↓
Management dashboards widgets or Alarms
1. Deploy kube-state-metrics
kube-state-metrics exposes Kubernetes object state as Prometheus-format metrics. In this setup, I deployed it in the cluster and exposed it through a Kubernetes service similar to:
kube-state-metrics.monitoring.svc.cluster.local:8080This endpoint is then scraped by the OpenTelemetry Collector.
2. Add kube-state-metrics as a Prometheus scrape target
The OpenTelemetry Collector can scrape the kube-state-metrics endpoint using the Prometheus receiver.
A simplified receiver configuration looks like this:
receivers:
  prometheus/kube_state_metrics:
    config:
      scrape_configs:
        - job_name: kube-state-metrics
          scrape_interval: 60s
          static_configs:
            - targets:
                - kube-state-metrics.monitoring.svc.cluster.local:8080
In my setup, the collector was already deployed in-cluster, so this became an additional metrics receiver rather than a separate collection stack. Note that the snippet above show only the relevant collector sections; endpoint names, authentication, and exporter settings should be adjusted for your environment. A simplified receiver configuration looks like this:
3. Filter to a small metric set
Instead of forwarding every metric from kube-state-metrics, I filtered the stream to a small set of state and lifecycle metrics:
processors:
  filter/kube_state_metrics:
    metrics:
      include:
        match_type: strict
        metric_names:
          - kube_pod_container_status_restarts_total
          - kube_pod_container_status_ready
          - kube_pod_container_status_waiting_reason
          - kube_pod_container_status_terminated_reason
          - kube_deployment_spec_replicas
          - kube_deployment_status_replicas_available
These metrics focus on container and deployment state rather than resource utilization. They are useful for questions such as whether a container is restarting, whether it is ready, and whether a deployment has the expected number of available replicas.
4. Export through the existing collector pipeline
The metrics pipeline then sends the filtered metrics through the same collector export path used for OCI ingestion. A simplified pipeline looks like this:
service:
  pipelines:
    metrics/kube_state:
      receivers:
        - prometheus/kube_state_metrics
      processors:
        - filter/kube_state_metrics
        - batch
      exporters:
        - otlphttp/oci
5. Build a restart widget in OCI Monitoring
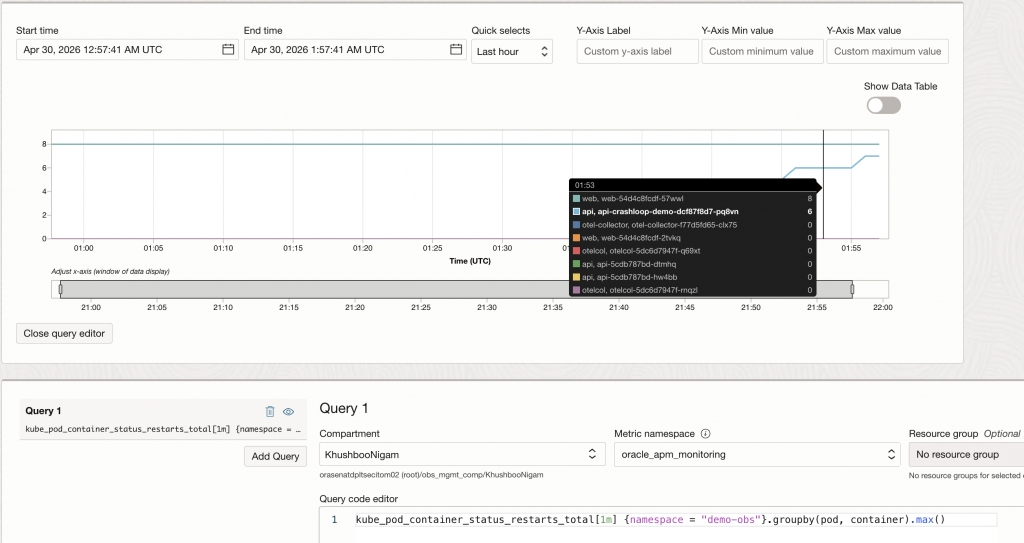
One useful query from this data is the restart count by pod and container:
kube_pod_container_status_restarts_total[1m]{namespace = "demo-obs"}.groupBy(pod, container).max()This is a cumulative counter, so the interpretation matters:
- a flat line means the restart count is not changing
- a rising line means the container is actively restarting
- a high value does not necessarily mean the problem is still active
In the CrashLoopBackOff test, this metric showed the temporary crash-looping pod accumulating restarts over time. That made it a useful numeric complement to the OKE pod events view.
In this walkthrough,
kube-state-metricsis the metric source, while the OpenTelemetry Collector is the collection and export path. I used this route because the collector was already deployed in the cluster and allowed me to filter the metric stream to a small set of Kubernetes lifecycle signals before sending them to OCI Monitoring. Another valid OCI-native option is to use OCI Management Agent with PrometheusEmitter to scrape Prometheus-format endpoints directly. The choice depends on whether a team wants to extend an existing OpenTelemetry pipeline or use Management Agent as the Prometheus scraping path.
Conclusion
Kubernetes observability is most useful when traces, logs, metrics, events, and topology are interpreted together. In the first scenario, OCI APM showed a failed checkout trace, and Kubernetes metadata identified the API pods involved in the request path. From there, the Kubernetes Monitoring Solution provided workload-level context, and Logan AI helped summarize the related log records to identify an application-level integrity error in the payment flow.
In the second scenario, the platform showed the opposite pattern. A temporary API pod entered CrashLoopBackOff, but the application continued serving traffic through healthy replicas. APM traces showed the request paths that continued to work, while the Kubernetes Monitoring Solution exposed workload instability outside the active request path through topology, pod, and event views.
The key lesson is that Kubernetes metadata on traces does not automatically mean Kubernetes caused the failure. It gives teams the context needed to classify where the problem belongs: application code, workload health, deployment behavior, or platform state. The Kubernetes Monitoring Solution then provides a broader cluster and workload view, while Logan AI can accelerate triage by summarizing patterns across the collected logs.
For teams that want selected Kubernetes lifecycle signals available as metrics, kube-state-metrics can also be scraped by the OpenTelemetry Collector and sent to OCI Monitoring. In this walkthrough, the restart count metric provided a useful numeric complement to the pod events view.
In Part 3, we will build on this foundation and look at how observability signals can help detect deployment-induced regressions and support CI/CD troubleshooting.