

Introduction
Within Oracle Cloud Infrastructure (OCI), there are many forms of telemetry generated whether it be audit Logs, network logs, and service logs. And these logs are essential as the telemetry can be used to trigger alerts for potential incidents such as authorized access. However, due to the amount of logs generated, the problem of management arise since the logs are not in a centralized viewpoint which may lead to inefficient observability of the cloud environment. Therefore, a Security Information and Event Management (SIEM) Solution serves to address this issue by aggregating telemetry to create quick dashboards and trigger alerts based on the logs.
One possible SIEM Solution is Wazuh which we will be diving into with these series of posts:
- Part 1: Deploying Wazuh on Oracle Kubernetes Engine (This post)
- Part 2: Forward OCI Telemetry into Wazuh (WIP)
This post explains the process of deploying Wazuh within Oracle Cloud Infrastructure (OCI) through a private Oracle Kubernetes Engine (OKE) Cluster. A private OKE cluster is not required to run Wazuh. This guide uses a private cluster because it keeps the Kubernetes API endpoint, worker nodes, and Wazuh Dashboard off the public internet, which is appropriate when processing sensitive security telemetry. A public cluster can also be used when its endpoints are appropriately restricted and it meets the organization’s security requirements. Additionally, Wazuh has other deployment models which can be found on Wazuh’s Installation page and Alternative Installation page. Moreover, there is an Quickstart Deployment which works on Ubuntu (or other supported OS) in an OCI Compute Instance, and this can be used to quickly deploy Wazuh if a Kuberenetes environment is not warranted. For now, we’ll focus on the Deployment on Kubernetes section for this blog.
By the end of this blog, you will have:
- Created a private OKE Cluster
- Configured a Virtual Cloud Network (VCN), Subnets, and Network Security Groups (NSG)
- Established SSH Tunnel access to the private Wazuh Dashboard
- Prepared OCI Block Volume
- Deployed and Validated Wazuh
What is Wazuh?
Wazuh is a centralized Security Information and Event Management (SIEM) solution with extended detection and response capabilities. And so, the platform is intended for administrators who need a centralized collection of data such as Operating System (OS) Logs, Application Logs, or Network Logs for logging, monitoring, and alerts.
Further, Wazuh is comprised of four components:
- Wazuh Indexer stores indexed event data, agent inventory, vulnerability and security findings, and alerts generated by the Wazuh Server. For example, a repeated failed-login event can be indexed as an authentication alert for investigation in the Dashboard.
- Wazuh Server is the analytics engine. It receives endpoint data, correlates it with relevant events, and creates alerts when configured detection conditions are met.
- Wazuh Dashboard visualizes alerts and data from the Wazuh Server and Indexer, and highlights where agents are deployed.
- Wazuh Agents run on monitored endpoints and forward data such as operating systems and application logs or file-integrity events to the Wazuh Server.
The Wazuh Indexer, Wazuh Server, and Wazuh Dashboard are required for this deployment. Wazuh Agents are optional and are installed only on supported endpoints when host-level telemetry is needed. OCI-native services, including Audit Logs and VCN Flow Logs, do not require Wazuh Agents. Those logs are exported from OCI and forwarded through an OCI-to-Wazuh integration, which is outside the scope of this post and covered in Part 2.
Deployment
Required for this deployment are an OKE cluster, persistent storage, network connectivity among the Wazuh components, and the Wazuh Indexer, Server, and Dashboard. The private OKE topology, Quick Create networking, internal load balancer, node sizing, and Compute jumpbox are example-specific choices. OCI Bastion and Cloud Shell are alternatives to the Compute jumpbox.
Deploy with OKE
Configuring OKE Cluster
OKE allows for two creation methods for clusters which are Quick Create or Custom Create. For this blog, we will be using Quick Create as it provisions the Virtual Cloud Network (VCN), Internet Gateway (IG), NAT Gateway (NAT), Service Gateway (SGW), Cluster, and Node Pool for us.
When creating the OKE cluster through Quick Creation, we will have the following values: The values below are examples only. Use CIDRs, node sizing, Kubernetes versions, regions, and security rules which align to your organization’s standards and existing OCI network design.
| Component | Value |
| Cluster | <Your-Cluster-Name> |
| Cluster type | Basic |
| Kubernetes | v1.36 |
| Network type | OCI VCN-native |
| Kubernetes API Endpoint | Private |
| Node Type | Managed |
| Kubernetes Worker Nodes | Private |
| VCN | Quick Create-generated VCN |
| VCN CIDR | <Your-Cluster-CIDR> |
| Private API subnet | <Your-Private-API-Endpoint-Subnet> |
| Private API endpoint | <Your-Private-API-Endpoint> |
| Worker-node subnet | <Your-Worker-Node-Subnet> |
| Service LB subnet | <Your-Service-LoadBalancer-Subnet> |
| Kubernetes Service CIDR | <Your-Kubernetes-Service-CIDR> |
| Network Security Groups | NSGs scoped to required traffic for our jumpbox |
| Security Lists | Quick Create-generated lists; avoid broad access rules |
| Node Count | 3 |
| Node Shape | VM.Standard.E5.Flex |
| Number of OCPUs | 2 |
| Memory (GB) | 8 |
| Node Image | Oracle Linux 8 |
For this blog, the following public subnet, security list, and network security group (NSG) will be created in the OKE VCN for Wazuh access via a Compute Instance through a local forwarding SSH tunnel. This instance will be our jumpbox.
| Component | Value |
| Compute Subnet | <VCN-Appropriate-CIDR-Range> |
| Security List | OKE-Wazuh-Compute |
| Security List Ingress | None |
| Security List Egress | All to 0.0.0.0/0 |
| Network Security Group | OKE-Compute-NSG |
| NSG Ingress | SSH from approved CIDRs |
Administrative access follows this path:
- An administrator connects from their workstation to the jumpbox using SSH.
- The jumpbox, located in the same VCN, accesses the private OKE Kubernetes API endpoint to administer the cluster.
- An SSH local-forwarding tunnel sends browser traffic from the workstation to the Wazuh Dashboard’s private OCI load balancer.
- The dashboard communicates internally with the Wazuh Indexer and Wazuh Server through Kubernetes services.
Security telemetry follows a separate path. Wazuh Agents send endpoint telemetry to the Wazuh Server when agents are deployed. OCI-native logs, such as Audit Logs and VCN Flow Logs, are forwarded from OCI through a separate ingestion integration described in Part 2.
Configuring Wazuh
There are multiple ways to access a private OKE cluster for configuration, including OCI Bastion, OCI Cloud Shell, or a Compute instance. This guide uses a Compute instance as a jumpbox because the OKE API endpoint and Wazuh Dashboard load balancer are private and cannot be reached directly from an administrator’s workstation over the public internet. The jumpbox needs network access to the private OKE API endpoint and the private Dashboard load balancer, and it requires controlled inbound SSH access from approved administrator CIDRs. A jumpbox is not required; OCI Bastion or Cloud Shell are supported alternatives, subject to the organization’s access-control model.
For this example, create an Oracle Linux 9 Compute instance in your compute subnet to serve as the jumpbox. After the instance is running, connect to the instance with SSH.
ssh -i <ssh-key> opc@<public address of the instance>Afterwards, install the OCI CLI onto the instance, and configure and the configuration file. This guide assumes the OCI CLI is configured with an API Token, but an instance principal may be used instead. Further, an instance principal ensures the instance follows the principal of least privilege.
Next, configure kubeconfig for the private endpoint.
mkdir -p "$HOME/.kube" && oci ce cluster create-kubeconfig --cluster-id <YOUR-OKE-CLUSTER_OCID> --file "$HOME/.kube/config" --region <your-region> --token-version 2.0.0 --kube-endpoint PRIVATE_ENDPOINTAdditionally, we will need to install Kubectl onto our instance which can be found at the Oracle Cloud Native Environment guide and the Install kubectl guide.
Then, we can clone the Wazuh-Kubernetes repository onto the jumpbox. You may also need to install git.
sudo dnf install gitgit clone --branch v4.14.6 --depth 1 https://github.com/wazuh/wazuh-kubernetes.git
cd wazuh-kubernetesNext, generate the self-signed certificates for Wazuh.
./wazuh/certs/indexer_cluster/generate_certs.sh

./wazuh/certs/dashboard_http/generate_certs.sh
After the certificates have been generated, update the Kubernetes manifests to use OCI internal load balancers.
Updating the docker images in the deployment files
The following files located in the wazuh-kubernetes repo need to have the image value updated.
- wazuh/indexer_stack/wazuh-dashboard/dashboard-deploy.yaml
- wazuh/wazuh_managers/wazuh-master-sts.yaml
- wazuh/wazuh_managers/wazuh-worker-sts.yaml
- wazuh/indexer_stack/wazuh-indexer/cluster/indexer-sts.yaml
Within each YAML file, the image value is formatted as wazuh/<service>. Update it to docker.io/wazuh/<service> to avoid CRI-O image-name resolution errors.
For example, in wazuh/indexer_stack/wazuh-dashboard/dashboard-deploy.yaml, update wazuh/wazuh-dashboard:4.14.6 to docker.io/wazuh/wazuh-dashboard:4.14.6. Apply the same docker.io prefix to each previously listed image.
Additionally, during this step, you may increase the CPU and memory resources allocated to the Wazuh nodes.
Updating PVCs to use OCI Block Volume
Update the following file
- envs/local-env/storage-class.yaml
For provisioner, replace microk8s.io/hostpath with blockvolume.csi.oraclecloud.com.
Updating Service Manifests in Wazuh to use Private OCI Load Balancers
The default manifest values are not tailored for OCI, so update the following service manifests.
- wazuh/indexer_stack/wazuh-dashboard/dashboard-svc.yaml
- wazuh/indexer_stack/wazuh-indexer/cluster/indexer-api-svc.yaml
- wazuh/wazuh_managers/wazuh-master-svc.yaml
- wazuh/wazuh_managers/wazuh-workers-svc.yaml
For dashboard-svc.yaml, comment out any non-OCI annotations and add service.beta.kubernetes.io/oci-load-balancer-internal: "true" in the annotations section. If copying and pasting, double check the quotes to ensure no stylized text is copied and pasted into the YAML file.
And the wazuh-master-svc.yaml and wazuh-workers-svc.yaml, the annotations section will also be updated.
The YAML file will appear similar to the following:
apiVersion: v1
kind: Service
metadata:
  name: dashboard
  namespace: wazuh
  labels:
    app: wazuh-dashboard
  annotations:
    service.beta.kubernetes.io/oci-load-balancer-internal: "true"
spec:
  type: LoadBalancer
  selector:
    app: wazuh-dashboard
  ports:
    - name: dashboard
      port: 443
      targetPort: 5601
Lastly, indexer-api-svc.yaml will have the type variable updated to type: ClusterIP as shown in the following example.
apiVersion: v1
kind: Service
metadata:
  name: indexer
  namespace: wazuh
  labels:
    app: wazuh-indexer
spec:
  type: ClusterIP
  selector:
    app: wazuh-indexer
  ports:
    - name: indexer-rest
      port: 9200
      targetPort: 9200
Validate and Deploy Wazuh
Render the manifests before applying them to validate the resulting Kubernetes resources.
kubectl kustomize envs/local-env/ > /tmp/wazuh-rendered.yamlThen deploy the manifests.
If you want Kubernetes to validate the resources without persisting them, first run
kubectl apply --dry-run=client -k envs/local-env/( or use --dry-run=server to validate against the API server).
kubectl apply -k envs/local-env/To check pods status, use:
kubectl get pods -n wazuh -wOnce the pods are running, use the following commands to confirm connectivity from Wazuh Dashboard to Wazuh Indexer and Wazuh Manager.
kubectl exec -n wazuh deployment/wazuh-dashboard -- \
  sh -c 'curl -skI https://indexer:9200/'

kubectl exec -n wazuh deployment/wazuh-dashboard -- \
  sh -c 'curl -skI https://wazuh:55000/'
A 401 Unauthorized response is expected. It confirms that the service is reachable, and that authentication is enforced.
To obtain the private Dashboard load-balancer address, run:
kubectl get svc dashboard -n wazuhFrom your workstation, establish a local port-forward through the jumpbox to the private Dashboard load balancer:
ssh -i <ssh-key> -N -T -o ExitOnForwardFailure=yes -L 127.0.0.1:8443:<dashboard-private-ip>:443 opc@<jumpbox-public-ip>To retrieve the Wazuh credentials from the jumpbox, run:
kubectl get secret indexer-cred -n wazuh -o jsonpath='{.data.username}' | base64 --decode; echo

kubectl get secret indexer-cred -n wazuh -o jsonpath='{.data.password}' | base64 --decode; echo
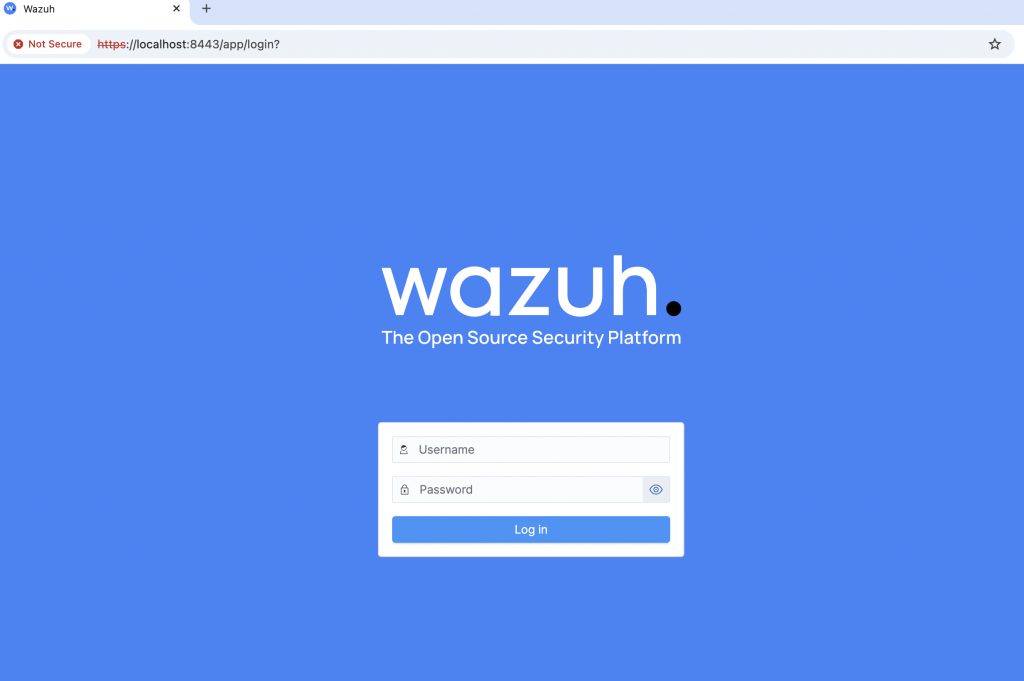
On your workstation, open https://localhost:8443 in a browser. Because the certificate is self-signed, your browser will display a warning. After you acknowledge the warning, the Wazuh Dashboard’s Login Screen opens.
Note: The Wazuh Dashboard may take a moment to be fully ready.
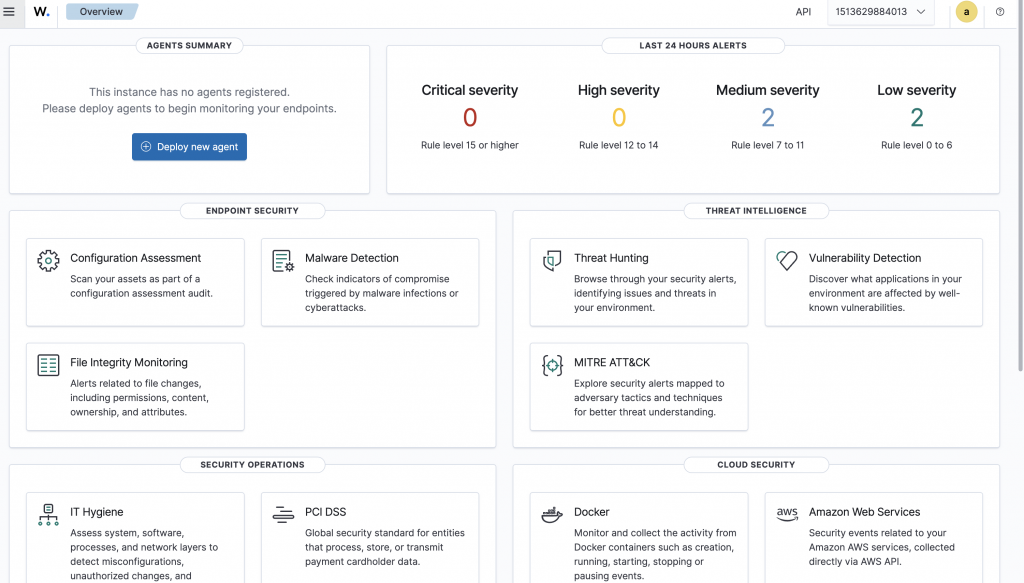
After logging in, the Wazuh Dashboard opens with the overview page, highlighting all known alerts in the past 24 hours and currently running agents. Since this is a simple deployment, there are no current agents nor OCI-related logs being ingested to Wazuh.
Conclusion
You have now deployed Wazuh on OCI OKE with a private Kubernetes API endpoint and private load balancers. In total, we’ve done the following:
- Created a private OKE Cluster
- Configured a Virtual Cloud Network (VCN), Subnets, and Network Security Groups (NSG)
- Established SSH Tunnel access to the private Wazuh Dashboard
- Prepared OCI Block Volume
- Deployed and Validated Wazuh
As it stands currently, Wazuh will not be ingesting any additional information unless the connectors (such as the Wazuh Agents on Instances or OCI related Logs Ingestion) are properly configured. However, this deployment ensures that Wazuh is simply up-and-running in an OCI environment.
In the next part, we will highlight how to forward OCI native logs to Wazuh.