In my previous blog, Turning Chaos into Clarity: Analyze Oracle E-Business Suite Logs with Oracle Cloud Log Analytics, I discussed how Oracle Cloud Log Analytics can help simplify troubleshooting and operational visibility for Oracle E-Business Suite (EBS) environments.
In this follow-up article, we take the next step toward full-stack observability by showing how to correlate requests across multiple infrastructure and middleware layers using a common request identifier.
By linking:
- OCI Load Balancer Access Logs
- WebLogic Access Logs
administrators and support teams can trace a single user transaction end-to-end across the environment, dramatically reducing resolution time.
Why Log Correlation Matters
Troubleshooting distributed enterprise applications often involves jumping across multiple log sources:
- Did the request reach the load balancer?
- Which managed server processed it?
- Was the request rejected at the middleware layer?
- Did an application error occur downstream?
Without a shared correlation identifier, these investigations become manual and time-consuming.
Using a unique request ID propagated through the stack enables teams to:
- Trace requests across tiers
- Identify bottlenecks quickly
- Correlate errors and latency
- Improve root cause analysis
- Build unified dashboards in Oracle Cloud Log Analytics
Architecture Overview
The following components participate in the request flow:
- OCI Load Balancer
- Oracle HTTP/Web Tier
- WebLogic Access Logs
- WebLogic Server/Application Logs
- Oracle Cloud Log Analytics
The key enabler is the propagation of an X-Request-ID header throughout the request lifecycle.
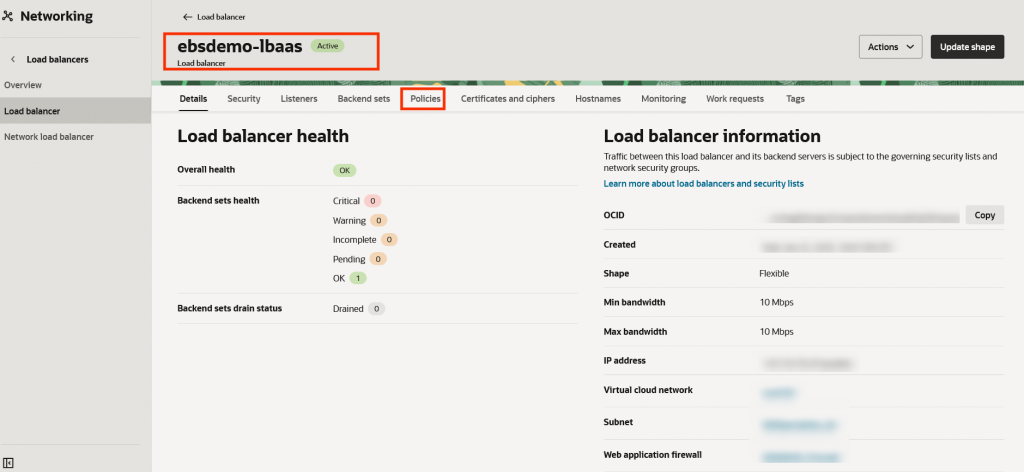
Step 1: Configure OCI Load Balancer to Inject X-Request-ID
OCI Load Balancer can be configured to insert a unique request identifier into incoming requests.
This allows every request entering the environment to carry a correlation token that downstream systems can log.
Add Request Header Rule
Configure a request header rule on the load balancer listener:
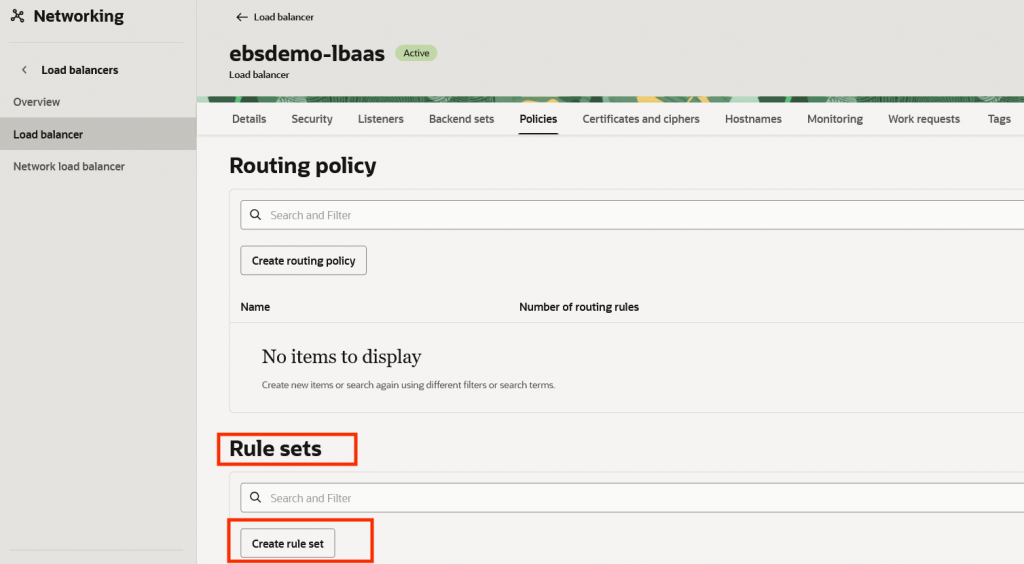
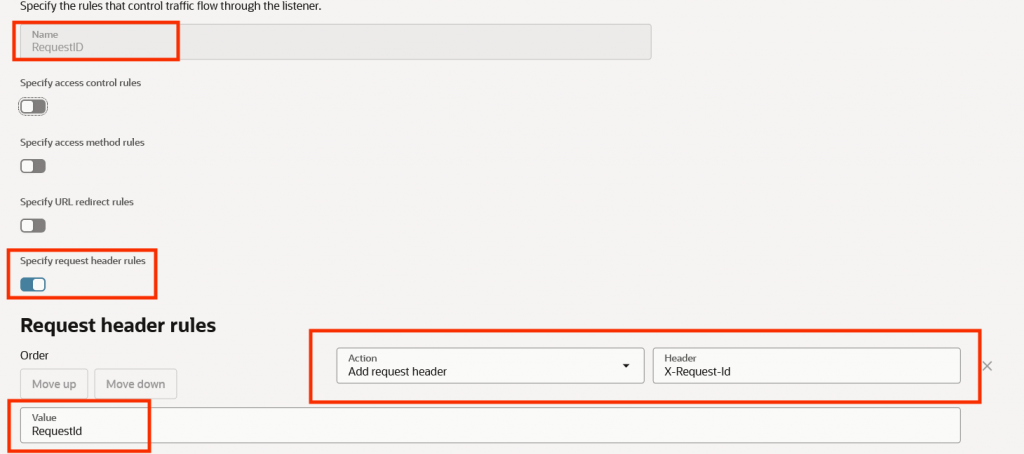
This ensures each inbound request receives a unique identifier generated by the load balancer.
Sample Load Balancer Access Log Entry
"request": "POST /OA_HTML/RF.jsp?function_id=MAINMENUREST&security_group_id=0 HTTP/1.1",
    "requestId": "112cebe0acba14125558dcaec7f5b059",
Benefits
- Unique request tracking
- End-to-end traceability
- Correlation across infrastructure and middleware
- Easier debugging of intermittent issues
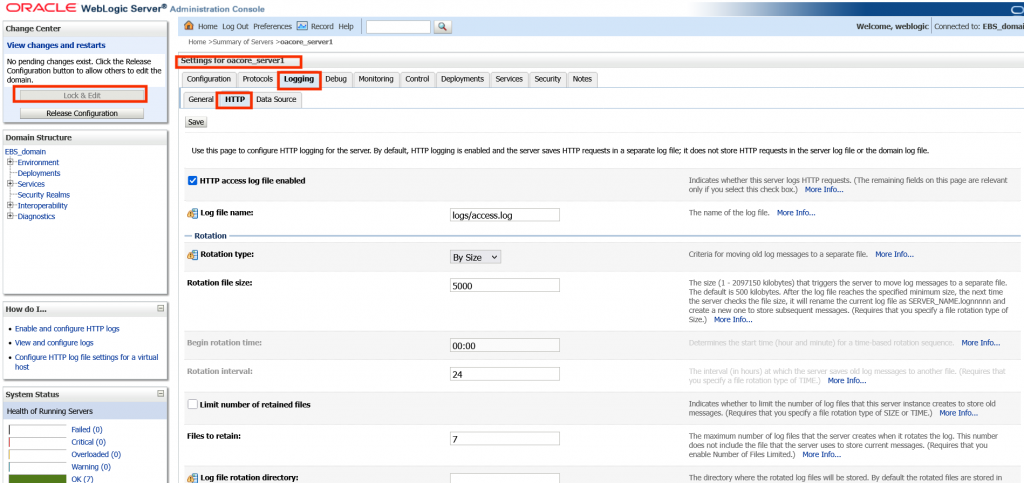
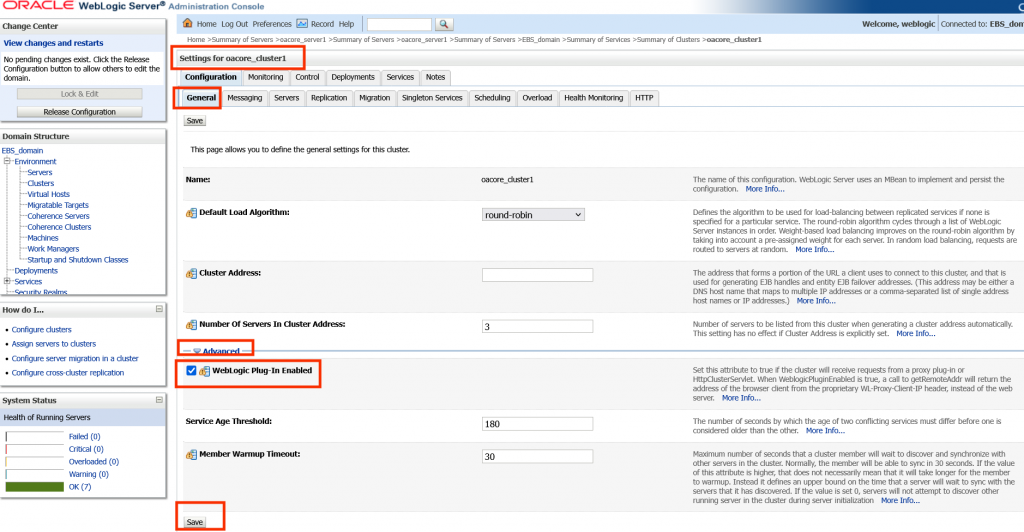
Step 2: Enable Extended Logging in WebLogic Access Logs
Next, configure WebLogic HTTP access logging to capture the propagated request ID.
Enable Extended Log Format
Update the WebLogic access log configuration to use the Extended Log Format (ELF).
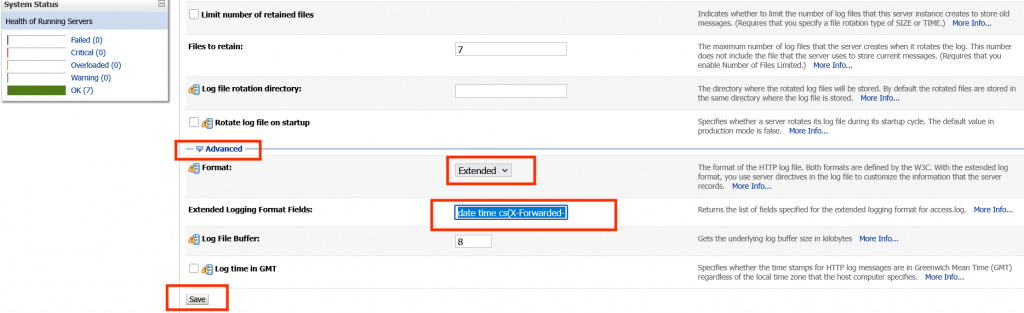
Example:
date time cs-method cs-uri sc-status time-taken cs(X-Request-ID)
This ensures the request ID appears in every WebLogic access log entry.
Sample Weblogic Server Access Log Entry
2026-05-07 09:38:57 "130.35.3.122" "112cebe0acba14125558dcaec7f5b059" POST /OA_HTML/RF.jsp?function_id=MAINMENUREST&security_group_id=0 200 spanId=bf3c89073e7ad6a6 traceId=b2a2161a47b7d6a08cdf3d64e12980cdNow requests can be tied directly back to OCI Load Balancer logs.
At this point, a single request ID can be traced across:
- Load Balancer logs
- Access logs
- Application logs
- Error logs
Step 3: Ingest Logs into Oracle Cloud Log Analytics
Once the logs are collected into Oracle Cloud Log Analytics, the shared request ID becomes the correlation key.
Using Log Analytics, teams can:
- Search all related logs instantly
- Build dashboards by request ID
- Correlate latency across tiers
- Detect failure patterns
- Create alerts for problematic transactions
Example search:
'112cebe0acba14125558dcaec7f5b059'
This returns all log records associated with the same transaction across all monitored components
Conclusion
Correlating logs across OCI Load Balancer, WebLogic Access Logs, and WebLogic Server Logs significantly improves observability for Oracle E-Business Suite environments.
By propagating a simple X-Request-ID header through the stack and analyzing logs centrally using Oracle Cloud Log Analytics, organizations can move from fragmented troubleshooting to true end-to-end operational visibility.
Resources and References
- Log Analytics Documentation: Log Analytics Quick Start
- Prerequistes for using LoganAI: LoganAI Prerequisites
- Use LoganAI: LoganAI
- OCI Pricing Information: OCI Pricing
If you have not already explored Oracle Cloud Log Analytics for EBS environments, be sure to read the original article:
👉 Turning Chaos into Clarity: Analyze Oracle E-Business Suite Logs with Oracle Cloud Log Analytics